Futures market

EUR/USD Resumes Bearish Trend Below $1.176FenzoFx—EUR/USD trades bearish, below the 100-SMA, and is currently testing the bullish FVG as support. Yesterday, Euro failed to pass the immediate resistance at $1.176; therefore, we expect the bearish bias to resume.
In this scenario, EUR/USD's downtrend could extend to the next support level at $1.151. Please note that the bearish outlook should be invalidated if Euro closes and stabilizes above $1.176.

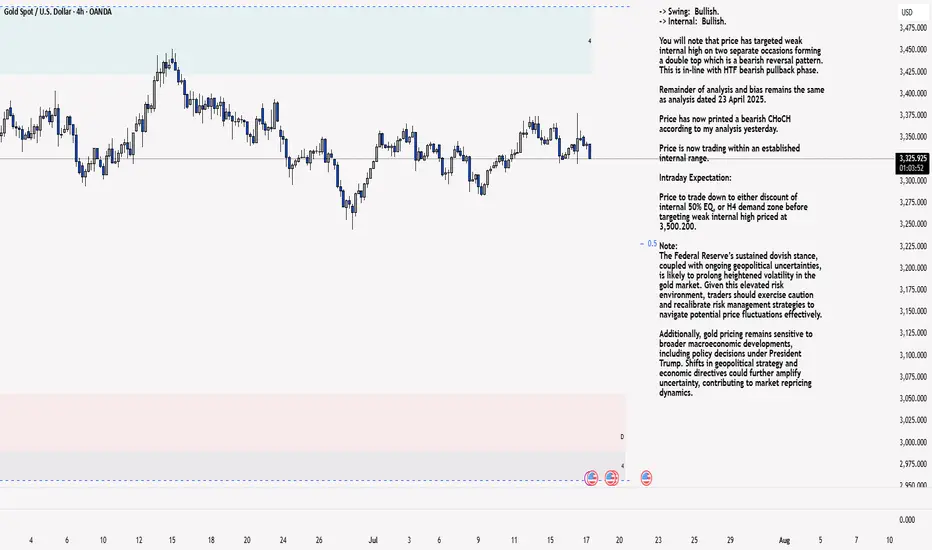
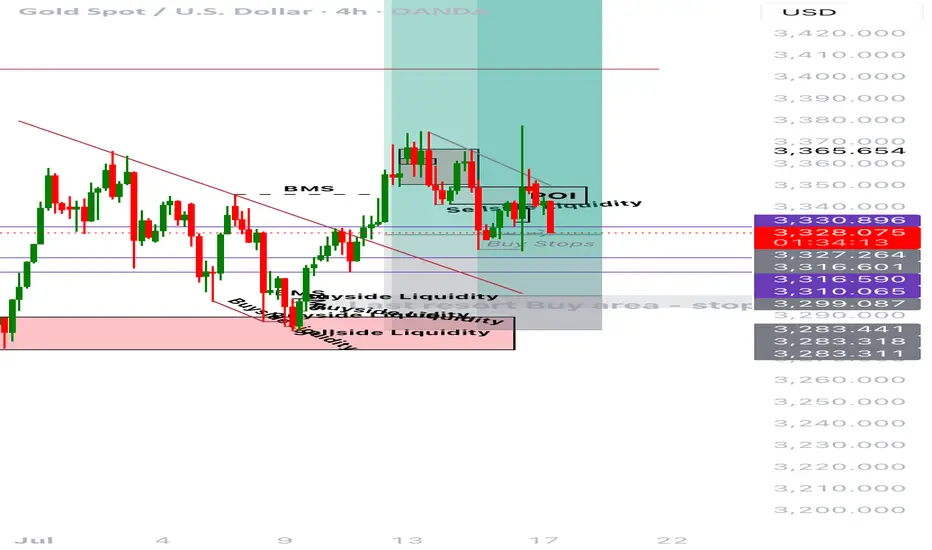
XAU/USD 17 July 2025 Intraday AnalysisH4 Analysis:
-> Swing: Bullish.
-> Internal: Bullish.
You will note that price has targeted weak internal high on two separate occasions forming a double top which is a bearish reversal pattern. This is in-line with HTF bearish pullback phase.
Remainder of analysis and bias remains the same as analysis dated 23 April 2025.
Price has now printed a bearish CHoCH according to my analysis yesterday.
Price is now trading within an established internal range.
Intraday Expectation:
Price to trade down to either discount of internal 50% EQ, or H4 demand zone before targeting weak internal high priced at 3,500.200.
Note:
The Federal Reserve’s sustained dovish stance, coupled with ongoing geopolitical uncertainties, is likely to prolong heightened volatility in the gold market. Given this elevated risk environment, traders should exercise caution and recalibrate risk management strategies to navigate potential price fluctuations effectively.
Additionally, gold pricing remains sensitive to broader macroeconomic developments, including policy decisions under President Trump. Shifts in geopolitical strategy and economic directives could further amplify uncertainty, contributing to market repricing dynamics.
H4 Chart:
M15 Analysis:
-> Swing: Bullish.
-> Internal: Bullish.
H4 Timeframe - Price has failed to target weak internal high, therefore, it would not be unrealistic if price printed a bearish iBOS.
The remainder of my analysis shall remain the same as analysis dated 13 June 2025, apart from target price.
As per my analysis dated 22 May 2025 whereby I mentioned price can be seen to be reacting at discount of 50% EQ on H4 timeframe, therefore, it is a viable alternative that price could potentially print a bullish iBOS on M15 timeframe despite internal structure being bearish.
Price has printed a bullish iBOS followed by a bearish CHoCH, which indicates, but does not confirm, bearish pullback phase initiation. I will however continue to monitor, with respect to depth of pullback.
Intraday Expectation:
Price to continue bearish, react at either M15 supply zone, or discount of 50% internal EQ before targeting weak internal high priced at 3,451.375.
Note:
Gold remains highly volatile amid the Federal Reserve's continued dovish stance, persistent and escalating geopolitical uncertainties. Traders should implement robust risk management strategies and remain vigilant, as price swings may become more pronounced in this elevated volatility environment.
Additionally, President Trump’s recent tariff announcements are expected to further amplify market turbulence, potentially triggering sharp price fluctuations and whipsaws.
M15 Chart:
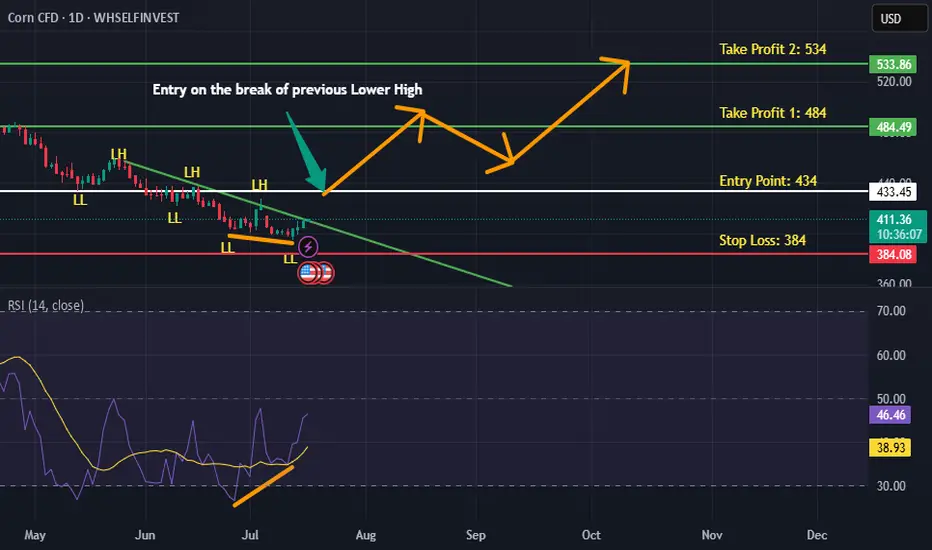
CORN is BullishPrice was in a strong downtrend, however the bullish divergence with trendline break hints the return of bulls. If previous lower high is broken with good volume then we can expect a strong reversal as per Dow theory. Targets are mentioned on the chart.
MCL Just RAN the Highs and Died. Beautiful. You ever watch price grind into a supply zone like it’s got no clue what's coming, then slap the trend line like it owes it money? That’s what MCL did this morning. It ran the previous day high, tapped into a juicy supply zone, gave us a textbook order block rejection and I said, “bet.”
I’m not here for 300 IQ Fibonacci spirals or Jupiter retrograde entries I just want clean structure, manipulated highs, and a breakdown that pays the bills. Let’s dig in.
Setup Overview (15-Min Chart)
Bias: Bearish
Setup Type: Liquidity Run ➝ OB Retest ➝ Trend Continuation
Context & Narrative:
PDH (67.01) was swept early. Liquidity grab? Price got yeeted from supply after faking momentum. We got a clean Order Block Retest at 66.59, respecting the descending EMA and HTF structure.
Entry Structure:
- Entry - 66.39 Retest rejection + momentum shift
- TP1 - 66.10 Intra-day structure low
- TP2 - 65.80 Demand zone front-run
- PDL - 65.40 Potential deeper fade if momentum holds
Confluence Checklist:
- Sweep of prior highs (PDH liquidity grab)
- Strong supply reaction + OB retest
- Bearish EMA slope holding price down
- Momentum shift + clean intraday structure
- Entry gives >2R to TP1, >4R to TP2
Risk Notes:
If price reclaims 66.70+ and closes above OB → bias invalidated. Don’t marry the trade this is oil, not Tinder.

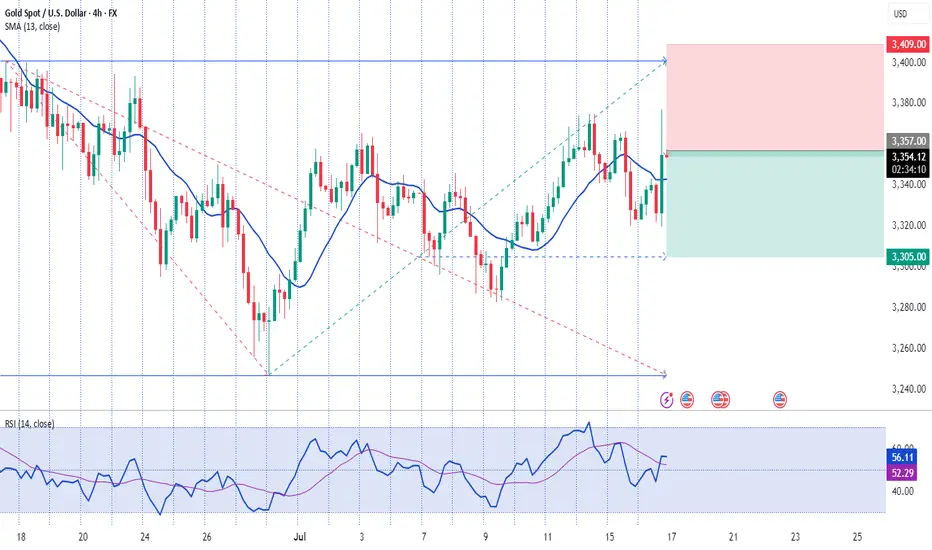
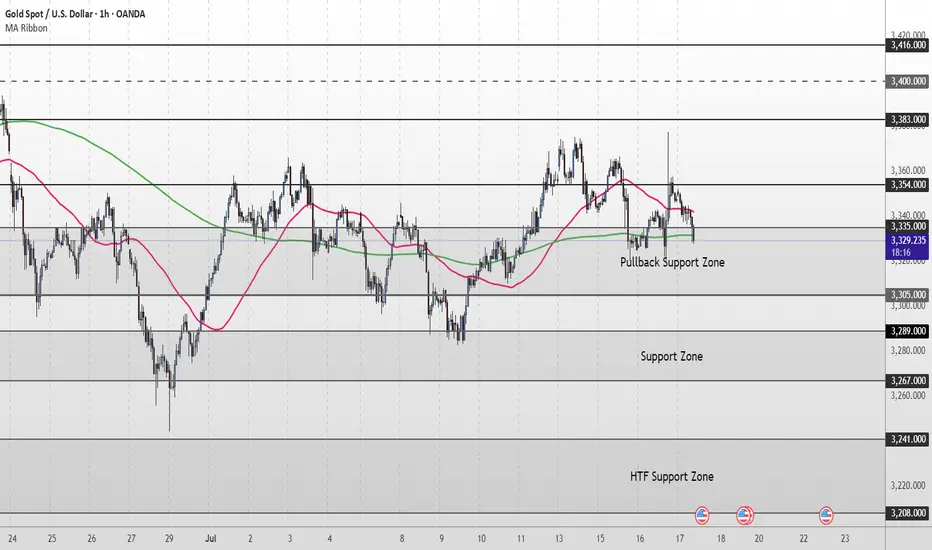
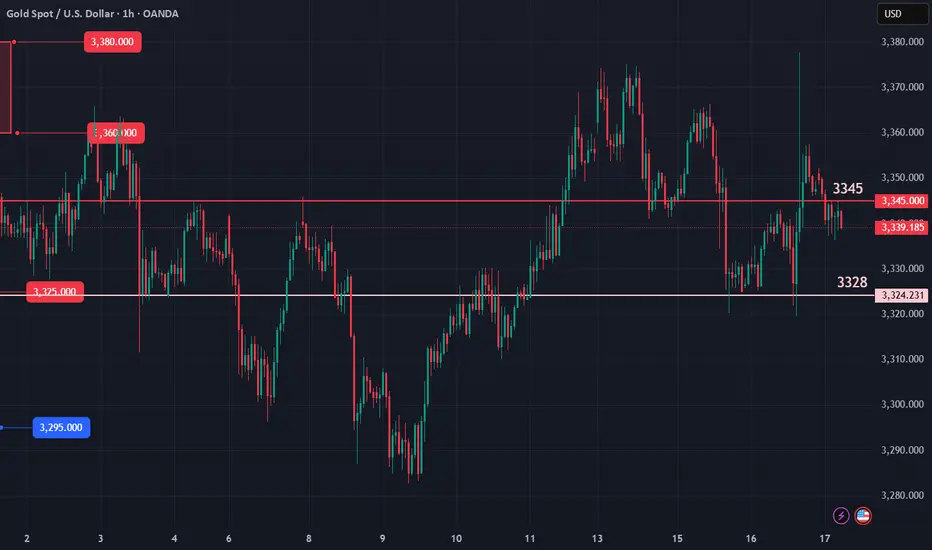
Gold Short Term OutlookYesterday, gold staged a strong rally, pushing up toward 3,377, which was followed by a strong rejection. Price has pulled back sharply and is now testing the Pullback Zone once again.
Currently trading around 3,329, price is caught between the 50MA overhead acting as dynamic resistance and the 200MA below offering dynamic support.
For the bullish structure to regain momentum, we need to see a clean break and hold back above 3,354. This would reopen the path toward 3,383 and 3,400, with 3,416 as a higher‑timeframe target.
If buyers fail to defend the Pullback Support Zone, and price breaks decisively below 3,305, attention shifts to the Support Zone (3,289–3,267). A deeper selloff could then expose the HTF Support Zone (3,241–3,208).
📌 Key Levels to Watch
Resistance:
‣ 3,354
‣ 3,383
‣ 3,400
‣ 3,416
Support:
‣ 3,335
‣ 3,305
‣ 3,289
‣ 3,267
‣ 3,241
🔎 Fundamental Focus – High‑Impact U.S. Data Today
A packed U.S. calendar could drive volatility:
📌Core Retail Sales m/m and Retail Sales m/m
📌Unemployment Claims
📌Philly Fed Manufacturing Index
These red‑folder releases can create sharp intraday swings.
Additionally, multiple FOMC member speeches later in the session could add headline‑driven moves.
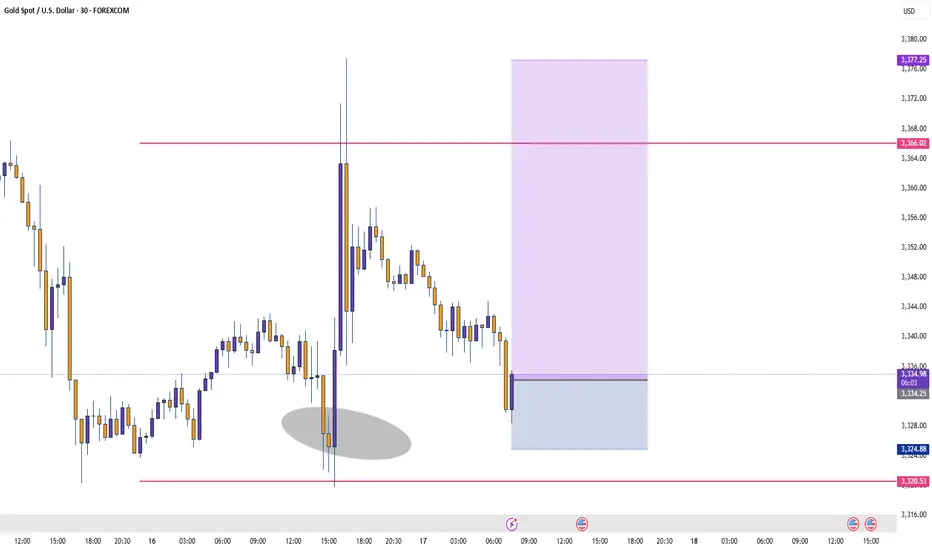
No clear indication yet…📝 Trade Journal Entry – XAUUSD (Gold Spot)
Date: July 17, 2025
Platform: TradingView (Demo Account)
Timeframe: 1H (Live Management), 4H Bias
Direction: Originally Long → Reassessing
Status: Active — Protective Stop Adjusted
Current Price: 3,328.920
Stop Adjusted To: Below recent swing low
Potential Loss: ~£40
Rationale for Change: Loss of bullish structure — no BOS to the upside
⸻
🔍 Market Context
• Price reacted well off the POI but failed to break bullish structure.
• No confirmation of BOS on the 1H or 15M timeframe.
• Price action appears to be trapped within a range, not confirming intent.
• Downward pressure and failed follow-through makes long continuation questionable.
⸻
⚠️ New Trade Decision
• Stops moved to below recent swing lows for capital protection.
• Will accept minor loss (~£40) to maintain discipline and avoid emotional averaging.
• Buy bias now on pause — waiting for clean structure shift or deeper mitigation into demand.
⸻
🎯 Plan Going Forward
• Reassess once price reaches demand at ~3,283 zone.
• Watch for:
• Clean BOS
• Rejection + SFP
• HTF confluence and re-alignment
• Stay out of long trades until confirmed strength returns.
⸻
😐 Emotional Reflection
Felt uncertain watching price stall. Happy I didn’t add recklessly or average down. Taking a small hit is a win when the logic isn’t there anymore.
⸻
✅ Reflection Questions
• Did I adjust my bias correctly when structure changed?
• Was I emotionally attached to the idea of a buy?
• Did I move my stop based on logic or fear?

BuyRejection Level
Daily Volume
Market Structure Shift
London Session
Trend Line Break
Untapped Order Point
SEIZE THE OPPORTUNITY: IS GOLD POSITIONED FOR A DOWNSIDE MOVE?FUNDAMENTAL ANALYSIS
Current Price: $3341
Target Range: $3310 - $3320
While gold has enjoyed a recent run-up, the technical landscape suggests that this upward momentum is encountering significant resistance. Multiple indicators point to a potential short-term pullback, offering a compelling selling opportunity for astute traders.
Key Resistance Holds Strong: Gold has consistently met stern resistance around the $3345-$3375 area. This zone has proven to be a formidable barrier for further upside, with recent attempts to break through being met with decisive selling pressure.
Decisive Pullback from Highs: After touching recent highs, gold has already shown a sharp pullback from $3354, indicating that buyers are losing conviction at these elevated levels. This suggests that the current price around $3341 is vulnerable to a continuation of this corrective move.
US Dollar Strength on the Rise: The US Dollar is gaining traction following recent economic data. A stronger dollar makes gold more expensive for international buyers, naturally dampening demand and exerting downward pressure on prices.
Technical Signals Align for a Decline:
Some analyses indicate that gold has entered a short-term range-bound consolidation phase, with the upper boundary around $3345-$3350, making it an ideal "shorting at highs" scenario.
Bearish momentum is emerging below the $3340 resistance level, with some technical indicators potentially signaling a shift in trend.
The 50-day moving average could be acting as dynamic resistance overhead, further capping upside potential.
The smart money is recognizing that gold's current valuation may be unsustainable in the immediate term. Don't chase the rally; instead, capitalize on the impending correction.
Consider initiating sell positions from $3341 down to $3310 as gold tests and potentially breaks key support levels. Prudent risk management suggests placing a tight stop-loss above the immediate resistance, protecting your capital while aiming for a profitable downside.
TARGET 1 (3325)
TARGET 2 (3310)
STOP LOSS ( 3352)

gold sellsGold sells from 3340
Trying to flow with price
Idk what else to write lol tradingview keeps saying its a brief description
closed at 3332

Gold (XAUUSD) at Decision Point – Watch $3,320 Closely! Technical Analysis – 4H Chart
Gold is trading within a rising channel, but momentum is weakening. The current price action is testing the lower channel support around $3,320 — a critical level for the next directional move.
🟥 Bearish Scenario:
Break & close below $3,320 could confirm channel breakdown
Target: $3,219 support zone
Bearish engulfing seen on higher timeframe adds pressure
🟩 Bullish Scenario:
If $3,320 holds as support and price bounces back:
Possible move toward upper channel resistance around $3,401
🌍 Fundamental Outlook
Recent CPI data was soft, but no strong bullish push yet
Focus on upcoming U.S. economic releases (employment, PMI, retail sales)
Strong data = Hawkish Fed = Bearish for Gold
Weak data = Dovish Fed = Bullish for Gold

Gold Just Flipped Is the Drop Coming?🚨 Gold Market Update – Are You Ready? 🚨
Yesterday, the gold market swept the liquidity from the previous days taking out stop orders and clearing out weak positions. After the sweep, price closed lower, showing clear signs of weakness. 📉
But that’s not all...
In the process, it also broke through a key bullish Fair Value Gap (FVG) an area where buyers had previously shown strength. That FVG is now inverted, meaning it could act as a strong resistance level going forward.
With this shift in structure, there's a real possibility that gold could drop further, potentially hunting the liquidity resting near previous lows. The market might be gearing up for a deeper move.
🔥 So the question is:
Are YOU ready for the next leg down?
📌 As always Do Your Own Research (DYOR)
This is not financial advice just reading the tape.

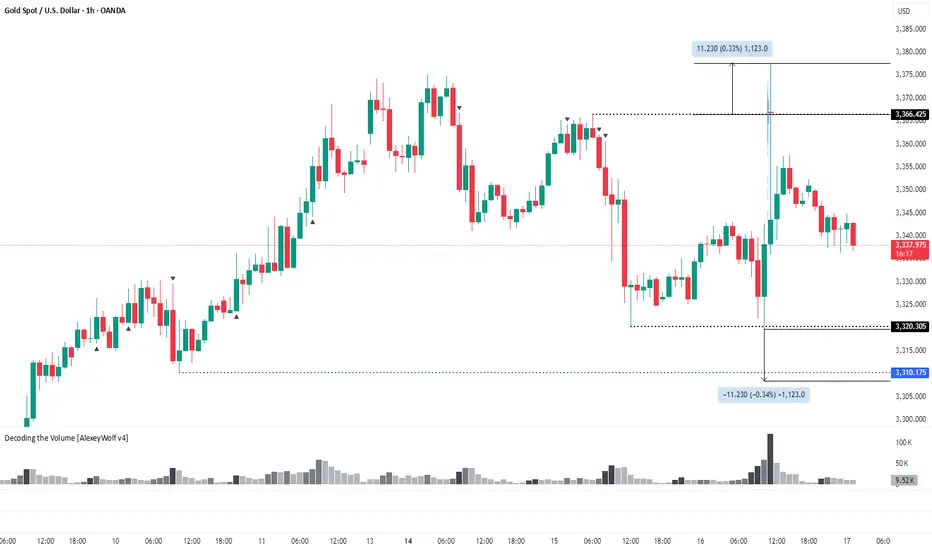
Gold. Where to look for buy setupsHi traders and investors!
The price is currently in a sideways range, with the boundaries marked by black lines.
Sellers defended the buyer's first attempt to break through the 3366 level — the key volume in the candle that touched this level was accumulated exactly at that point.
Now, it would be ideal to symmetrically expand the range downward by 11.230 points, which would bring the price right to the 3310 level.
From the 3310 level, it makes sense to look for potential buy patterns.
This analysis is based on the Initiative Analysis concept (IA).
Wishing you profitable trades!
XAUUSD what's going on? sittuation for 17/07/2025🔹 Current Price Action (M30 & H1):
Price is stuck in a tight range between 3335–3345.
Volume is dropping — showing no strong pressure from either buyers or sellers.
%R indicator is in the oversold zone (below -80), but there’s no sharp bounce yet.
On H1, there's a weak attempt to recover — small candles with upper wicks = uncertain growth or selling pressure at highs.
🔍 Possible Scenarios for Today:
✅ Scenario #1: Fake Breakout Down, Then Reversal Up
If price holds above 3329–3331 and we see a strong bullish candle with volume, it might be worth trying a long.
🎯 Targets: 3348, then 3355
🛑 Stop-loss: below 3328
⛔ Scenario #2: Break Below 3328, Move Lower
If M30 or H1 closes confidently below 3328, that could signal a drop towards 3315–3305.
Look to short on the retest of the broken level.
🎯 Targets: 3316, then 3306
📌 Priority Right Now:
We're in balance — no clear bias.
But if we break and hold below 3328, shorts become more attractive.
If price breaks and holds above 3345, that opens up upside potential.
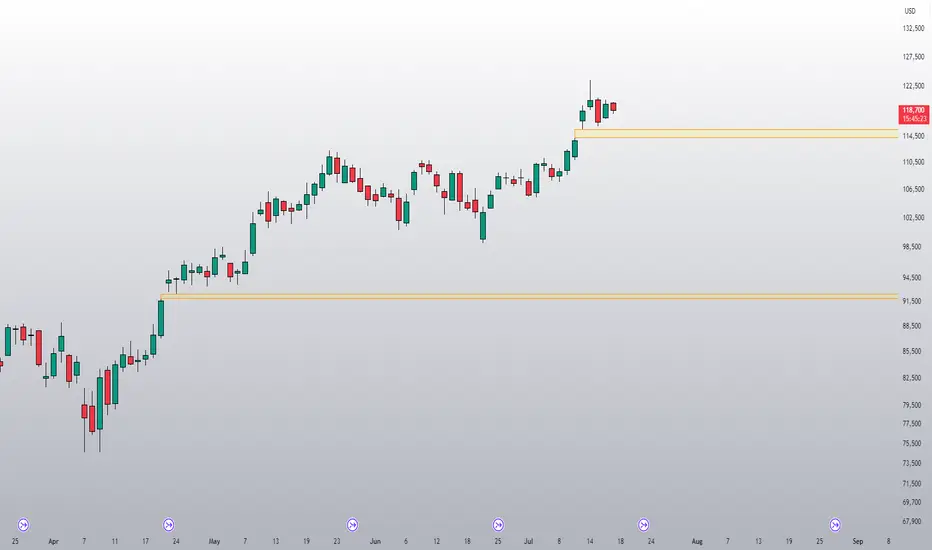
Will the gap be filled or not?During the bull run of 2020/21, there were gaps that remained unfilled until the bear market. So it's possible that the one at 114.3k will stay unfilled for now, but it's also hard to imagine, since we're so close.
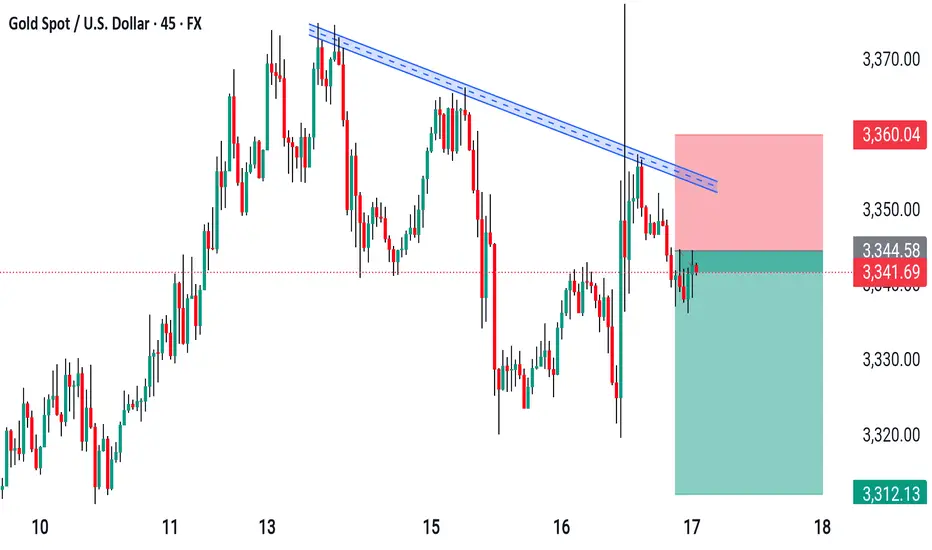
GOLD PRICE SETUP ALERT XAUUSD | 45M🥇GOLD PRICE SETUP ALERT
XAUUSD | 45M⏳
🔻 Price just rejected a key trendline confluence
🔒 Liquidity sweep above + Clean retest
📉 Entered short position targeting lower support zone
TP: 3312
SL: 3360
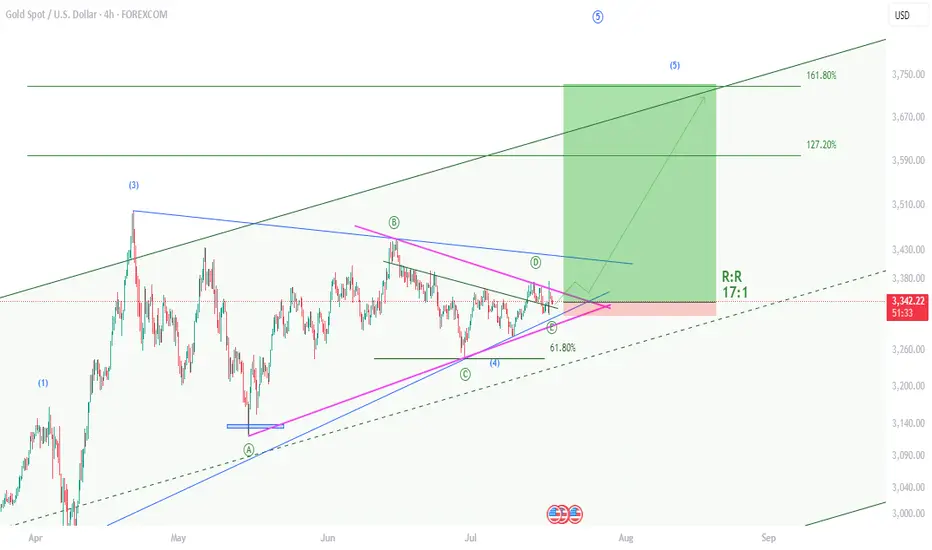
XAUUSD , Bullish Setup , R:R 17Hello friends
I am back after a long time and I want to share the results of my efforts of several years with you.
Gold is starting a 5th wave of bullishness and yesterday it gave us the necessary confirmations by rejecting the previous ceiling. I have identified the best buying position for you now. With a reward to risk 17
Take advantage of this opportunity.
If you are interested in Elliott waves or work in this field at a professional level, contact me and share your analysis with me.
I hope we will all be profitable together.
#Gold #XAUUSD Trade Setup – 1H Timeframe🥇#Gold #XAUUSD Trade Setup – 1H Timeframe
Clear rejection at descending trendline + key S/R flip around 3346. Price unable to break structure.
📉 Entry: 3346
⛔ SL: 3365
✅ TP targets:
3325
3311
3290

XAUUSD Trade Setup – 1H Timeframe🥇#Gold #XAUUSD Trade Setup – 1H Timeframe
Clear rejection at descending trendline + key S/R flip around 3346. Price unable to break structure.
📉 Entry: 3346
⛔ SL: 3365
✅ TP targets:
3325
3311
3290

Elliott Wave View: XAUUSD (Gold) Should Continue RallyElliott Wave sequence in XAUUSD (GOLD) suggest bullish view against September-2022 low in weekly. In daily, it should remain supported in 3, 7 or 11 swings to continue rally to extend higher. In daily, it ended ((4)) correction in 7 swings sequence at 3120.20 low in 5.15.2025 low against April-2025 peak. Above May-2025 low, it should continue rally targeting 3589 or higher levels, while pullback stays above 3246.55 low. In 4-hour, it placed 1 at 3452.5 low in proposed diagonal sequence. Within 1, it ended ((i)) at 3252.05 high, ((ii)) at 3245.20 low, ((iii)) at 3365.93 high, ((iv)) at 3245.20 low & finally ((v)) ended at 3452.50 high. It ended 2 in 7 swings correction at 3246.55 low in 6.29.2025. Within 2 pullback, it ended ((w)) at 3340.18 low, ((x)) at 3398.35 high & ((y)) at 3246.55 low in extreme area. It provided short term buying opportunity in extreme area, corrected 0.618 Fibonacci retracement of 1.
Above 2 low, it is showing nest in 1-hour sequence expecting further rally. It needs to break above 6.15.2025 high of 3452.5 to confirm the upside to extend daily sequence. Short term, it placed ((i)) of 3 at 3365.70 high, ((ii)) at 3282.43 low, (i) of ((iii)) at 3374.96 high & (ii) of ((iii)) at 3319.50 low. It is showing higher high since 2 low in 5 swings, which can be nest or a diagonal sequence, if breaks below 7.09.2025 low before rally higher above 6.29.2025 low. In (i), it ended i at 3330.32 high, ii at 3309.91 low, iii at 3374.02 high, iv at 3353.43 low & v at 3374.96 high. In (ii) pullback, it placed a at 3340.76 low, b at 3366.38 high & c as diagonal at 3319.50 low. It already broke above (i) high, confirmed upside can be possible as long as it stays above 3319.50 low.
Currently, it favors pullback in ii of (iii), while placed i at 3377.48 high. It expects pullback in 3 swings to hold above 3319.50 low before rally continue in iii of (iii). The further upside confirms when it breaks above 3452.50 high. Five swings rally from 6.29.2025 low, suggests more upside should be unfold. The next leg higher expects to erase the momentum divergence in 1-hour to be (iii) of ((iii)). Alternatively, if it breaks below 7.09.2025 low, it can be pullback against 6.29.2025 low, while ended ((i)) in diagonal at 3377.48 high. Gold is choppy after April-2025 peak. It can even do double correction, if breaks below 6.29.2025 low, correcting against May-2025 low before rally continue. We like to buy the pullback in 3, 7, or 11 swings pullback as it is bullish in weekly sequence.
