Gold XAU/USD Analysis for July 15, 2025: Trading Strategy and KeThe market is showing a strong upward trend, as indicated by the yellow trendline.
Fibonacci Retracement Levels:
38.2% Fibonacci Level: 3,344.79
50% Fibonacci Level: 3,344.47
61.8% Fibonacci Level: 3,347.91
Resistance Zone: The price is approaching a strong resistance level at 3,370 USD.
Technical Observations:
Gold is currently moving upward but is encountering resistance at 3,361. The price tested the 61.8% Fibonacci level and is now facing some resistance.
The Fibonacci levels suggest that if the price breaks above 3,362, the next target could be 3,370 USD.
Support Zone: If the price retraces, support may emerge near the 3,340 region.
Gold XAU/USD Trading Strategy:
Bullish Scenario:
If the price breaks above resistance at 3,362, the next target would be the 3,370 level. This could be a signal to enter Long positions near the 3,344 to 3,348 range, with a target around 3,370.
Bearish Scenario:
A retracement to the support level at 3,340 is possible. If the price drops below 3,340, further downside could be expected. In this case, a Short position could be considered if the price falls below 3,340, with a target near 3,330.
With the current upward trend, gold XAU/USD may continue to rise if it breaks the 3,362 resistance level, with the next target being 3,370 USD. However, if the price turns lower and drops below the 3,340 support level, the market may continue to decline.
Note: Be sure to monitor the Fibonacci levels and price behavior closely to adjust your trading strategy accordingly for today. If this analysis was helpful, don't forget to save it and follow for more trading strategies!
Futures market

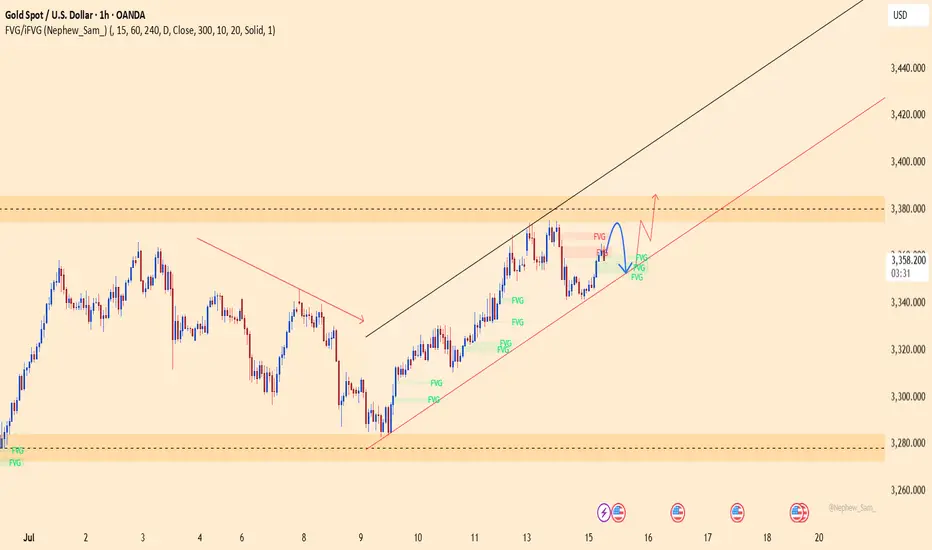
Gold set to surge? XAUUSD is holding firmly within a clear ascending channel on the H1 chart. After a strong rally, price is showing signs of a minor pullback toward the trendline support – potentially the last chance for buyers before gold accelerates toward the upper resistance zone.
On the news front, lower-than-expected U.S. producer inflation data has weakened the dollar, increasing gold’s appeal as a safe haven. In the coming days, key economic events like retail sales and comments from the Fed could serve as catalysts for the next bullish leg.
XAUUSD-Bearish Reversal OffBased on the H1 chart analysis, we can see that the price is rising toward our sell entry at 3356.28, which is a pullback resistance that aligns closely with the 50% FIb retracement.
Our take profit will be at 3329.51, a pullback support level that aligns with the 50% Fib retracement.
The stop loss will be placed at 3374.95, a swing-high resistance level.

XAUUSD – Bearish Setup: Watching Entry Below Key Level🔹 Current View:
Price is falling from the Shooting Star Candle + Supply zone and is now near a key short-term support at 3295.
🔹 My Plan:
I'm waiting for a clear break and close below 3295 to enter a short trade.
➡️ Entry: 3295 (breakout confirmation)
➡️ Target: 3266
➡️ Further drop possible toward demand zone below
🔹 Supply Zones Noted:
- 3340–3350: Supply + Shooting Star
- 3360–3370: Supply + FVG
If price respects the supply zones and breaks below 3295, we may see continuation to the downside.

XAUUSD SELL 3428On the 4-hour chart, XAUUSD stabilized and rebounded, and short-term bulls took the lead. At present, we can pay attention to the area around 3428, which is a potential short position of the bearish bat pattern, and this position is in the previous supply area.

Gold – M15 Downtrend in Play | July 15 Analysis🔻 Gold (XAUUSD) – July 15 Analysis | Bearish Bias Until Proven Otherwise
The market has entered a pullback phase on H4, and we’re expecting a potential retest of the 3320 Order Block before any continuation of the broader uptrend resumes.
🔍 M15 Market Structure:
✅ ChoCH followed by BoS confirms a downtrend on M15
🎯 Current short-term objective: Retest of H4 OB (3320)
📍 Price Action Context:
Price is now revisiting the same M15 POI where yesterday’s short setup originated.
Last session, this POI was respected, but instead of creating a new Lower Low, price is trading inside the same zone again.
This signals indecision — so we let price reveal its intent
🧭 Trade Planning Scenarios:
Scenario 1 – Bearish Continuation:
→ If the POI is respected again with clear M1 confirmation ( Micro-ChoCH + BoS ), we will plan for a short setup toward 3320
Scenario 2 – POI Breaks:
→ If price breaks above this POI zone, the next key level to observe is the 3355–3359 supply zone
→ We’ll reassess from there based on new confirmation
📌 Bias for Today:
🔻 Bearish bias remains intact as long as M15 structure does not shift back to bullish.
All setups must align with structure — we are short-biased only until the market proves otherwise
📖 Structure before emotion. Let the market invite you — not the other way around.
📘 Shared by @ChartIsMirror

Gold Fibonacci for the weekGold respects a smooth Fibonacci for the week. The pair is moving within a range, therefore the market is expected to move within the Fibonacci.

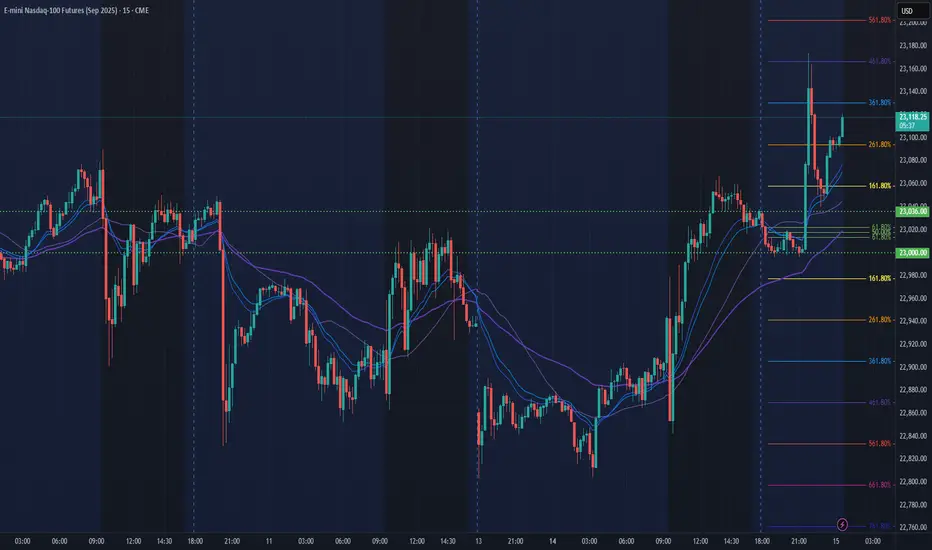
NQ Power Range Report with FIB Ext - 7/15/2025 SessionCME_MINI:NQU2025
- PR High: 23036.00
- PR Low: 23000.00
- NZ Spread: 80.5
Key scheduled economic events:
08:30 | CPI (Core|MoM|YoY)
Asian hours vol spike breakout swing into new ATHs
Session Open Stats (As of 12:15 AM 7/15)
- Session Open ATR: 290.39
- Volume: 42K
- Open Int: 276K
- Trend Grade: Neutral
- From BA ATH: -0.3% (Rounded)
Key Levels (Rounded - Think of these as ranges)
- Long: 23239
- Mid: 21525
- Short: 20383
Keep in mind this is not speculation or a prediction. Only a report of the Power Range with Fib extensions for target hunting. Do your DD! You determine your risk tolerance. You are fully capable of making your own decisions.
BA: Back Adjusted
BuZ/BeZ: Bull Zone / Bear Zone
NZ: Neutral Zone
Wait for the clear viewIts trading between edges wait for the clear view clear closing.
For intraday its very risky in between zones.

Elliott Wave Analysis – XAUUSD | July 15, 2025🟢 Trade Update
The BUY order at the 3342 – 3340 zone was triggered at 3341. As of now, price has moved up by 140 pips, and the market is still following the planned scenario from the previous analysis.
📊 Momentum Analysis
D1 Timeframe: Momentum is in the overbought zone, and indicator lines are showing signs of crossing — a warning signal of a potential reversal on the daily chart.
H4 Timeframe: After a 6-candle decline from 3377 to 3342, H4 momentum has reversed upward. With 2 bullish candles already formed, we expect another 3–5 bullish candles, aiming toward the 3390 zone.
🌀 Elliott Wave Update
Price action is currently moving toward the end of the abcde contracting triangle. We are monitoring two potential scenarios:
Scenario 1 – Ongoing Triangle Correction
If price returns to the lower boundary of the triangle, it is likely forming wave e, which would present a buy opportunity for the final leg of the triangle.
Scenario 2 – 5-Wave Impulse Extension
The current structure shows a 5-wave impulsive move, with wave 4 completed and wave 5 now beginning.
The projected target for wave 5 aligns with the resistance zone at 3398 – 3402.
After completing wave 5, the market could enter a corrective phase, consistent with the idea that wave d ends at this resistance.
🔔 If the price breaks above 3402, it would likely confirm that the abcde correction is complete and that a new impulsive bullish wave has started.
🎯 Trade Plan
📍SELL Zone: 3396 – 3398
⛔️ Stop Loss: 3406
🎯 TP1: 3376
🎯 TP2: 3327
📍BUY Zone: 3295 – 3293
⛔️ Stop Loss: 3285
🎯 TP1: 3327
🎯 TP2: 3365
🎯 TP3: 3402
✅ Note: Prioritize entries only after confirmation from price action and momentum at key levels.

Gold surges in rising channel – Breakout to 3,393 ahead?Gold is currently trading within a clearly defined ascending channel, with price maintaining strong upward momentum. This suggests that the bullish trend could continue, with the upper boundary of the channel acting as a potential target.
A short-term pullback may offer a buying opportunity if buyers show strength through bullish candlestick patterns, such as a bullish engulfing or hammer, which could drive price towards the 3,393 level.
However, a break below the lower boundary of the channel would invalidate the bullish outlook and could signal a potential trend reversal.
Always remember to confirm your setups and trade with solid risk management.
Good luck!

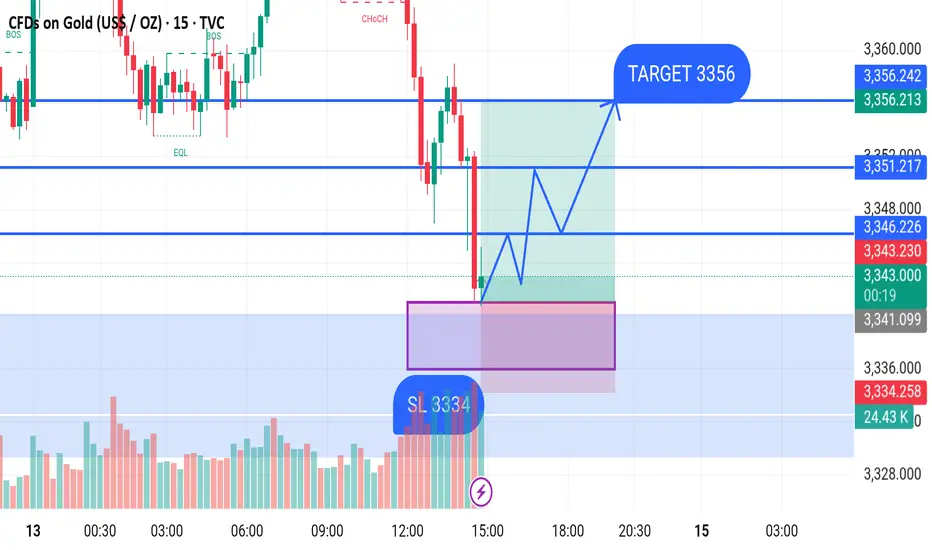
GOLD BUY M15 Gold (XAU/USD) 15-Min Chart Analysis – July 14, 2025
Price is currently reacting from a marked demand zone around 3334, which is acting as a strong support area. A bullish move is expected from this zone, with a potential upside target at 3356.
Key Levels:
Entry Zone (Demand Area): 3334 – 3340
Stop Loss (SL): Below 3334
Target (TP): 3356
Market Structure:
Price has formed Equal Lows (EQL), indicating liquidity grab.
After a sharp decline, price touched the demand zone and is showing bullish signs.
The projected path suggests a series of higher highs and higher lows towards the target.
This setup presents a buying opportunity, with a favorable risk-to-reward ratio aiming for the 3356 resistance zone.
XAUUSD is currently trading at 3347, presenting a potential buyif price fails to hold above 3340, it may indicate a breakdown, invalidating the long setup.
Overall, XAUUSD remains a buy above 3347 with targets at 3360, 3375, and potentially 3400, using 3340 as a strict stop-loss.
XAUUSD is currently trading at 3347, presenting a potential buying opportunity within a short-term bullish bias.
Immediate resistance is noted at 3360, which marks the first test for upward momentum.
A break above 3360 could push prices toward the next resistance at 3375.
Further confirmation of bullish continuation would be seen on a clean break and close above 3400.
Support is firmly placed at 3340, serving as a key stop-loss level to manage downside risk.
The ideal buy zone lies between 3345–3347, close to support but before resistance tightens.
This zone provides a favorable risk-to-reward ratio if price rebounds from this range.
Traders should monitor momentum indicators and price action around 3360 for early signals of a breakout.

XAUUSD Institutional Market Recap & Forward Guidance📊 XAUUSD Institutional Market Recap & Forward Guidance | July 14–15, 2025
🕒 Execution Focus: Cairo Time
🗓 14 July Recap – Liquidity Engineering Phase
Gold executed a precision liquidity trap below VAL 3341 during Asia–London overlap.
Price swept weak long positions, engineered a false breakdown, and rebalanced above VWAP Median / POC (3349).
The buy-side imbalance was confirmed via delta footprint and rising volume into NY close — textbook reaccumulation behavior by market makers.
Key institutional level respected:
VWAP Low: 3341 (support)
POC/VWAP Median: 3349 (magnet zone)
No breakout above VAH (3357–3361) — signals deliberate order absorption.
📈 15 July Outlook – Breakout Imminent
📍 Current Range: 3341–3361
🔺 Directional Bias: Bullish continuation toward 3361–3365 (liquidity pool)
🔻 Risk Zone: Failure to hold above 3349 → sweep back to 3341 / 3337
Institutional Levels in Play (Timeframe-Specific):
Daily VAH: 3361.96
H4 VWAP High: 3357.32
M15 POC: 3349.13
VWAP Bands (1H): 3341.20 – 3357.87
🧠 Execution Playbooks:
Breakout Play: Buy Stop > 3352.50
TP1: 3357
TP2: 3361
SL: 3344
Reversal Play: Sell Limit @ 3361.50
TP: 3349
SL: 3367
🔍 Confirm entries using:
Volume Footprint Delta
VWAP Reaction
RSI/MACD confluence
🛡 Reminder: Do not chase. Let price confirm. Trade only from institutional zones with footprint evidence.
📍Structured precision. MM logic. Risk control. This is not retail.

Gold (XAU/USD) 4H: Bullish Continuation Play- 15 July 20244‑Hour Technical Outlook — Bullish Bias Above Key BOS Zone
Gold remains in a strong structural uptrend on the 4‑hour chart, carving out a sequence of higher highs and higher lows. Price is consolidating just below recent swing highs around $3,360, suggesting accumulation after last week’s impulsive rally.
We saw a Break of Structure (BOS) above $3,340, confirming bullish control and establishing that area as a critical flip zone. Unless price closes decisively below that BOS, the directional bias remains bullish.
📐 Key Confluences & Zones on 4‑Hour
🔹 Fibonacci Retracement (Swing: $3,280 → $3,360):
38.2%: ~$3,331 — aligns perfectly with BOS & prior resistance turned support.
61.8%: ~$3,313 — deeper, but still within bullish context.
🔹 Supply & Demand Zones:
Supply (Resistance): $3,355–$3,360 — recent highs, likely containing resting sell‑side liquidity.
Demand (Support): $3,331–$3,335 — a bullish order block and fair value gap (imbalance) reside here.
Deeper Demand: $3,313–$3,315 — secondary buy zone if the market hunts liquidity deeper.
🔹 Liquidity Profile:
Buy‑side stops likely rest above $3,360 — breakout target.
Sell‑side liquidity below $3,331 could trigger a shakeout before higher.
🧠 ICT/SMC Concepts Observed:
✅ BOS confirmed at $3,340, favoring longs.
✅ FVG/imbalance between $3,338–$3,342 suggests price may “fill” before next impulse.
✅ Recent wick above $3,355 hints at minor buy‑side liquidity grab — but no confirmed CHoCH (change of character) yet.
✅ Bullish order block formed at $3,331–$3,333, acting as strong support.
📈 1‑Hour Intraday Playbook — Aligned With Bullish Bias
On the 1‑hour chart, momentum remains constructive above $3,331. Intraday traders can look for these setups:
1️⃣ Buy the Retest
Entry: $3,335 (within 4H OB & FVG)
Stop‑loss: $3,327 (below demand)
Targets:
🔸 T1: $3,355
🔸 T2: $3,380 (next resistance)
2️⃣ Breakout Long
Entry: Break and close above $3,360
Stop‑loss: $3,350
Targets:
🔸 T1: $3,380
🔸 T2: $3,406 (1.272 Fib ext.)
3️⃣ Deeper Pullback Buy
Entry: $3,313–$3,315 (61.8% Fib + deeper demand)
Stop‑loss: $3,305
Targets: back toward $3,355–$3,380
🎯 The Golden Setup:
✅ Long from $3,335, stop‑loss $3,327, targeting $3,355–$3,380.
Why? This setup aligns BOS, bullish OB, FVG, 38.2% Fib, and current trend structure — highest confluence and best risk/reward ratio (~1:3).
🔎 Summary Table — Key Levels for Today
📈 Bullish Continuation Above $3,331
🟢 Strong Buy Zone $3,331–$3,335
🟢 Deeper Demand $3,313–$3,315
🔴 Resistance / Supply $3,355–$3,360
🚨 Bullish Invalidation Below $3,331
Bias remains bullish as long as $3,331 holds. Look for reaction in the $3,331–$3,335 zone to join institutional flows.

Gold Trade Setup Eyes on 15M Demand ZonePrice is coming close to 3338, where we have a 15-Minute Order Block (OB) 📍. This is a fresh demand zone and can give a bullish reaction when price taps into it 🟢.
📌 Plan:
We will wait for price to tap the OB ✅
If we see bullish signs like rejection wicks or bullish candles, we will enter a buy 📈
Our target will be near 3366, just below the bearish FVG 🎯

WTI(20250715)Today's AnalysisMarket news:
Sources said that after Trump's latest trade tax threat, the European Central Bank will discuss a more negative scenario next week than expected in June. The ECB is still expected to keep interest rates unchanged at its meeting on July 24. Discussions on rate cuts are still postponed to September.
Technical analysis:
Today's buying and selling boundaries:
66.63
Support and resistance levels:
69.20
68.24
67.62
65.65
65.02
64.06
Trading strategy:
If it breaks through 66.63, consider buying in, the first target price is 67.62
If it breaks through 65.65, consider selling in, the first target price is 65.02

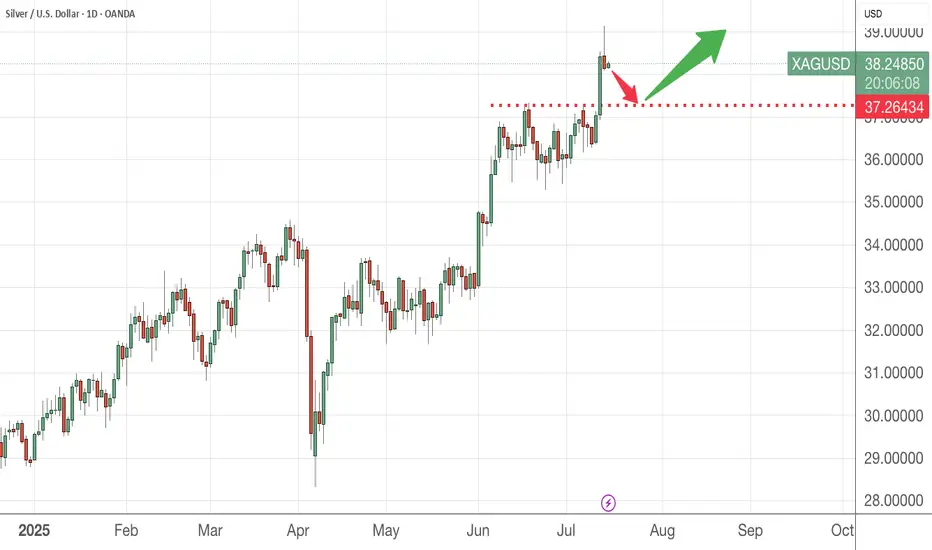
Time to accumulate some Silver We have a bearish pin bar yesterday and it is likely the price will retrace to 37.26 price level. There, I would be happy to accumulate more.
Please DYODD
Market Watch UPDATES! Stock Indices, Gold, Silver, US OILWelcome to the Market Watch Updates for Monday, July 14th.
In this video, we will give the forecast updates for the following markets:
S&P500, NASDAQ, DOW JONES, GOLD, SILVER and US OIL.
Enjoy!
May profits be upon you.
Leave any questions or comments in the comment section.
I appreciate any feedback from my viewers!
Like and/or subscribe if you want more accurate analysis.
Thank you so much!
Disclaimer:
I do not provide personal investment advice and I am not a qualified licensed investment advisor.
All information found here, including any ideas, opinions, views, predictions, forecasts, commentaries, suggestions, expressed or implied herein, are for informational, entertainment or educational purposes only and should not be construed as personal investment advice. While the information provided is believed to be accurate, it may include errors or inaccuracies.
I will not and cannot be held liable for any actions you take as a result of anything you read here.
Conduct your own due diligence, or consult a licensed financial advisor or broker before making any and all investment decisions. Any investments, trades, speculations, or decisions made on the basis of any information found on this channel, expressed or implied herein, are committed at your own risk, financial or otherwise.

Daily Analysis- XAUUSD (Tuesday, 15th July 2024)Bias: Bearish
USD News(Red Folder):
-CPI m/m
Notes:
- Price closed strong bearish
- Looking for price to retest daily structure
- Potential SELL if there's
confirmation on lower timeframe
- Pivot point: 3380
Disclaimer:
This analysis is from a personal point of view, always conduct on your own research before making any trading decisions as the analysis do not guarantee complete accuracy.

WTIThe final big bear bar can be a potential exhaustion of sellers. It probably gonna have a smaller second leg, then rising up.

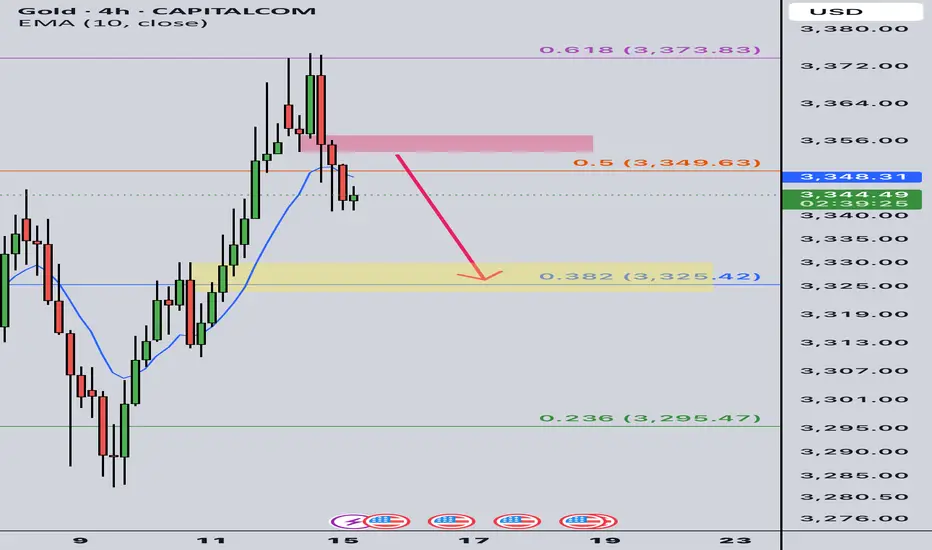
Gold Intraday Trading Plan 7/15/2025Yesterday 3367 resistance worked well and gold bounced from there as expected and reached 3341. Currently price is consolidating at this level but could rise to 3355. I will look for selling opportunity from 3355, targeting 3325 today.
MYM-FUTURES-US30- Retracement & ContinuationBias changed from July 13, 2025 to Bullish for a quick scalp. Tomorrow expecting some retracement and a possible move higher. Overall, Bais hasn't changed. Looking for a short into weekly FVG.
