Futures market

xauusdtSupport and press the rocket to cheer me up
Observe the ten percent loss limit
Stay away from Bitcoins
Feel free to buy and sell and post your comments

55 / 5.000 World gold continues to increase waiting for US Gold prices rose on Wednesday (March 5), supported by a weaker US dollar, as investors awaited official US jobs data due later this week for more details on the Federal Reserve's monetary policy.
At the close of trading on March 5, spot gold edged up 0.1% to $2,919.54 an ounce. Gold futures added 0.2% to $2,927.50 an ounce.
The US dollar index fell 1.2%, hitting its lowest level since November 2024, making greenback-denominated gold less expensive for buyers holding other currencies.
Concerns about US President Donald Trump's tariff policies have pushed gold prices to an 11th record high this year, peaking at $2,956.15 an ounce on February 24, and up 11% year-to-date.
In a speech to the US Congress late on March 4, Mr. Trump said he would impose additional tariffs on April 2, including reciprocal tariffs and non-tariff actions to balance a long-standing trade imbalance. The move would follow new 25% tariffs on most imports from Canada and Mexico that took effect on March 4, along with a doubling of tariffs to 20% on Chinese goods.
Third-party advertising. Not an offer or recommendation by Investing.com. View disclaimer here or remove ad.
The ADP jobs report showed that private sector job growth in the US slowed in February. Economists polled by Reuters expect the US economy to have added 160,000 jobs in February, when official US employment data is released on March 7.

Can buyers momentum carry-on?On the daily chart in the S&P 500 buyers have returned to this market. The challenge now is can they follow through which would be a sign of confidence in future positive market action.

XAU/USD Bullish Flag (06.03.25)The XAU/USD pair on the M30 timeframe presents a Potential Buying Opportunity due to a recent Formation of a Bullish Flag Pattern. This suggests a shift in momentum towards the upside and a higher likelihood of further advances in the coming hours.
Possible Long Trade:
Entry: Consider Entering A Long Position around Trendline Of The Pattern.
Target Levels:
1st Resistance – 2949
2nd Resistance – 2969
🎁 Please hit the like button and
🎁 Leave a comment to support for My Post !
Your likes and comments are incredibly motivating and will encourage me to share more analysis with you.
Best Regards, KABHI_TA_TRADING
Thank you.

CHECK MY TODAY XAUUSD TARGETSo guys, this is our target for today, if anyone wants it, they can follow it and this is a confirmed target. If anyone doesn't want to take an entry, they can take a downside entry from here.

3/6/2025 is the 4th candle in a Daily Power of 3I'm going to look for longs below today's open. I am looking for something around last week's low 20460.

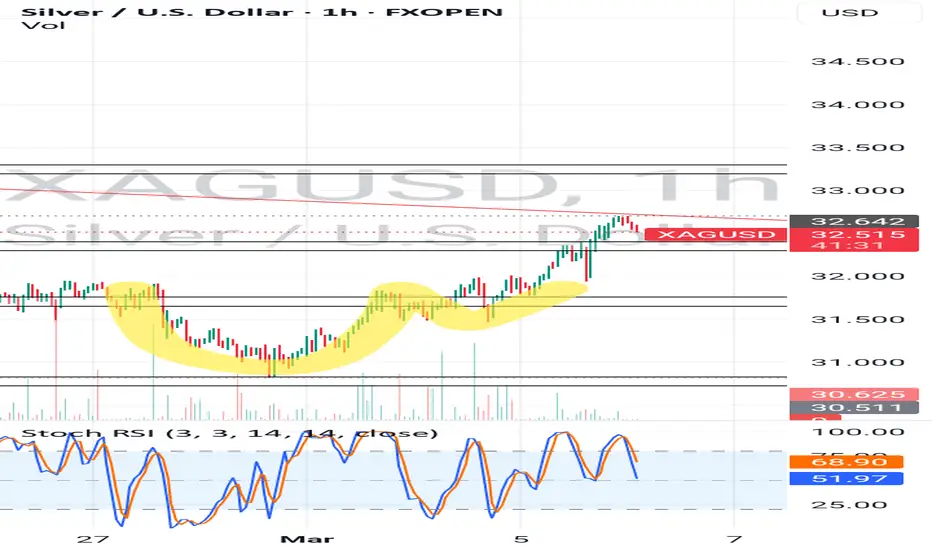
XAG_USD LONG RESULT.Silver price Action was bearish after breaking down our long and strong Trendline support and price finally took support at our horizontal support and held above it from which I executed a long trade and as seen produced good profits.

XAUUSD: 5/3 Today's Market Analysis and StrategyGold technical analysis
Daily chart resistance 2930, support below 2892
Four-hour chart resistance 2930, support below 2884
One-hour chart resistance 2930, support below 2912
Gold news analysis: Spot gold fluctuated narrowly at high levels on Wednesday and is currently trading around $2917/oz. Against the backdrop of escalating trade conflicts after US President Trump imposed new tariffs, the US dollar weakened to a near three-month low, and increased safe-haven demand pushed gold prices up sharply on Tuesday, reaching an intraday high of $2927.9/oz, which has risen for two consecutive trading days. Against the backdrop of escalating trade conflicts after US President Trump imposed new tariffs, the US dollar weakened and safe-haven demand increased, pushing gold prices up. Given the potential economic instability and weak job market, the Federal Reserve may cut interest rates ahead of schedule. Following three rate cuts last year, the Federal Reserve has kept interest rates stable. The market expects the Federal Reserve to resume rate cuts in June and may cut further in September. Investors need to pay close attention to changes in the international trade situation. The latest news shows that the United States may ease the tariff issue, which may weaken the safe-haven buying of gold and provide short-term opportunities for gold bears. This week's focus turns to Wednesday's ADP employment report and Friday's US NFP employment report to find clues to the Fed's interest rate trajectory.
Gold operation suggestions: Yesterday, gold fell slightly in the Asian session and stabilized at the 2880 mark, ushering in a strong rise after bottoming out. The European session accelerated to break through and stood above the 2900 mark to continue its strong upward trend. The US session accelerated to break through the 2927 line and fell under pressure and fell into a shock consolidation. The daily chart closed with two consecutive gains.
From the current trend of gold, today's lower support focuses on the one-hour level and the daily level are 2912-2892, respectively. The upper pressure focuses on the vicinity of 2930. Continue to rely on this range to sell high and buy low during the day. If it breaks through 2930, it is expected to approach the historical high. Wait patiently for key points to enter the market.
BUY:2892 near. SL:2887
BUY:2900 near. SL:2895
BUY:2912 near. SL:2908
SELL:2930 near. SL:2935
Trade with small size!

Trade Idea: XAUUSD LONG (BUY LIMIT)Technical Analysis:
1. Trend Analysis:
• 1H Chart: Clear uptrend with a pullback and price stabilizing near 2918.
• 15M Chart: Price has been consolidating after a recovery from a dip.
• 3M Chart: Market is forming higher lows, showing strength.
2. Indicators:
• MACD:
• 1H Chart: Bullish momentum, MACD line above signal line.
• 15M Chart: MACD recovering from a dip.
• 3M Chart: Weakening bearish momentum, signaling potential reversal.
• RSI:
• 1H Chart: 53.84 (neutral, with room for upside).
• 15M Chart: 50.50 (balanced, indicating neither overbought nor oversold).
• 3M Chart: 57.78 (leaning bullish).
3. Support & Resistance Levels:
• Support: 2910, 2895
• Resistance: 2928, 2946
Fundamental Analysis:
• Gold’s recent movement is supported by:
• Dollar weakness due to expectations of Fed rate cuts.
• Geopolitical uncertainty keeping gold as a safe-haven asset.
• U.S. Treasury Yields stabilizing, giving gold more upside room.
Trade Execution:
• Entry: 2918
• Stop Loss (SL): 2908 (10 points)
• Take Profit (TP): 2938 (20 points)
• Risk-Reward Ratio: 2:1
Rationale for Trade:
• Momentum is bullish across timeframes.
• Good confluence of technical and fundamental factors supporting upside.
• Risk is well-managed with a strong RRR of 2:1.
FUSIONMARKETS:XAUUSD

XAU/USD Technical Analysisgold prices are consolidating within a range of $2,900 to $2,932 per ounce, maintaining support above the critical psychological level of $2,900. This consolidation phase suggests a potential buildup for a directional move.
Technical Analysis:
On the H1 timeframe, immediate support is identified at $2,911 per ounce & 2902-2900. Sustaining above this level could embolden buyers to challenge the next resistance zone around $2,928-2932 per ounce. A successful breach of this resistance may pave the way toward the $2,942 per ounce mark.

XAU_USD ANALYSIS Silver has formed a Cup & Handle pattern and Moved strongly in the upward Direction following the trend and currently in a minor consolidation at the resistance Trendline, which I think Price Action would breakout of in the coming days create even New Highs, so let's watch and see how it plays out.
Further Breakout or rejection Breakdown??
Let me hear your opinions.
MNQ!/NQ1! Day Trade Plan for 03/05/2025MNQ!/NQ1! Day Trade Plan for 03/05/2025
📈20515 20610
📉20330 20240
Like and share for more daily ES/NQ levels 🤓📈📉🎯💰
*These levels are derived from comprehensive backtesting and research and a quantitative system demonstrating high accuracy. This statistical foundation suggests that price movements are likely to exceed initial estimates.*

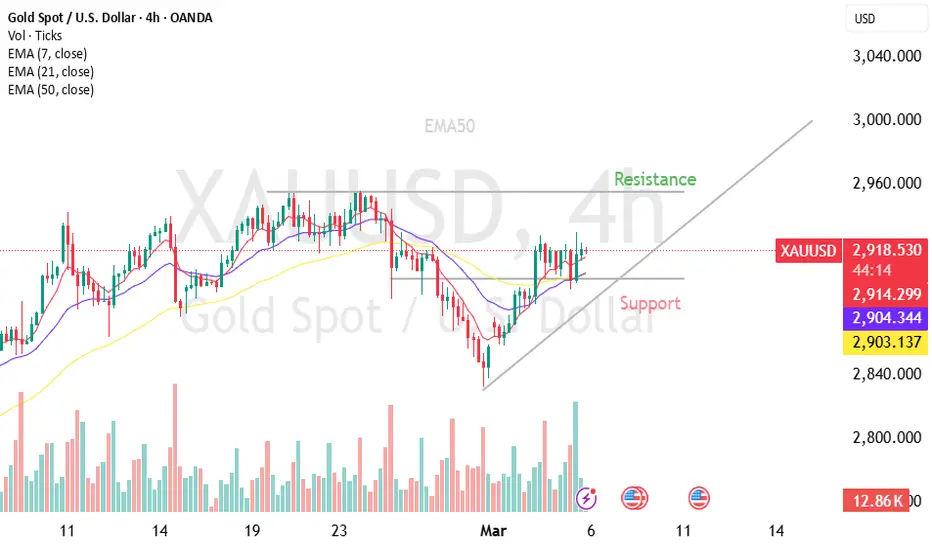
Support & Resistance in Trading – Key Concepts & StrategiesSupport & Resistance in Trading – Key Concepts & Strategies
📌 What are Support & Resistance Levels?
Support and resistance are fundamental concepts in **technical analysis** that help traders identify key price levels where an asset's price is likely to **reverse, consolidate, or break through.
- **Support Level:** A price point where demand is strong enough to prevent further decline. When the price reaches support, buyers tend to step in, causing a bounce.
- **Resistance Level:** A price point where selling pressure is strong enough to prevent further rise. When the price reaches resistance, sellers often push the price lower.
---
**🔹 Why Are Support & Resistance Important?**
1️⃣ **Identifying Reversal Points:** These levels help traders anticipate where price might change direction.
2️⃣ **Entry & Exit Strategy:** Traders use them to plan buy/sell positions, stop-loss, and take-profit levels.
3️⃣ **Breakouts & Fakeouts:** If price breaks through a key level, it signals a strong trend; however, false breakouts (fakeouts) can also occur.
4️⃣ **Psychological Impact:** Many traders watch these levels, making them **self-fulfilling price zones**.
---
**📊 How to Identify Support & Resistance?**
- **Historical Price Action:** Look for levels where price previously reversed multiple times.
- **Trendlines:** Draw diagonal trendlines connecting higher lows (for support) or lower highs (for resistance).
- **Moving Averages (e.g., EMA50, EMA200):** Act as dynamic support/resistance.
- **Fibonacci Levels:** Key retracement levels (38.2%, 50%, 61.8%) often act as support/resistance.
- **Volume Analysis:** High volume near certain price levels indicates strong buying/selling pressure.
---
**🔹 Trading Strategies Using Support & Resistance**
**1️⃣ Range Trading Strategy**
✅ **Buy near support** and **sell near resistance** when the market is moving sideways.
✅ Stop-loss: Below support for buy trades, above resistance for sell trades.
✅ Best used in **range-bound markets** (no strong trend).
**2️⃣ Breakout Trading Strategy**
✅ Enter a trade when price **breaks through a strong support or resistance** level.
✅ Confirm the breakout with **high volume** to avoid fakeouts.
✅ Stop-loss: Below the breakout level (for buy) or above (for sell).
**3️⃣ Retest Trading Strategy (Break & Retest)**
✅ After a breakout, wait for price to **retest the previous support/resistance** before entering.
✅ Provides a better entry with lower risk.
✅ Stop-loss: Below the retested level (for buy) or above (for sell).
---
**📌 Common Mistakes Traders Make**
❌ **Buying too close to resistance** or **selling too close to support** – wait for confirmation.
❌ **Ignoring fakeouts** – always check volume & price action before entering a breakout trade.
❌ **Not using stop-losses** – markets can be unpredictable, and risk management is key.
---
**📈 Example in Real Market (Gold – XAU/USD Analysis)**
- **Support:** $2,900
- **Resistance:** $2,950
- **Scenario 1 (Bullish Breakout):** If price **breaks above $2,950**, it could rally to $3,000.
- **Scenario 2 (Bearish Rejection):** If price **fails to break $2,950 and drops below $2,900**, a pullback to $2,870 is possible.
---
**🔹 Final Thoughts**
Mastering support & resistance is essential for **both beginners and advanced traders**. By combining these levels with other indicators (EMA, RSI, volume), you can improve your trade accuracy and risk management.
Remaining Bullish on Goldyesterday was the Non Farm Payroll news. Price stalled till it was time for news then pulled back to fill in a H4 Gap. Now I'm looking for price to continue bullish. There is not Area that they did not fill in so I'm thinking they might just come out the gate running soon as we are inside of the killzone. waiting for the killzone is the key though.

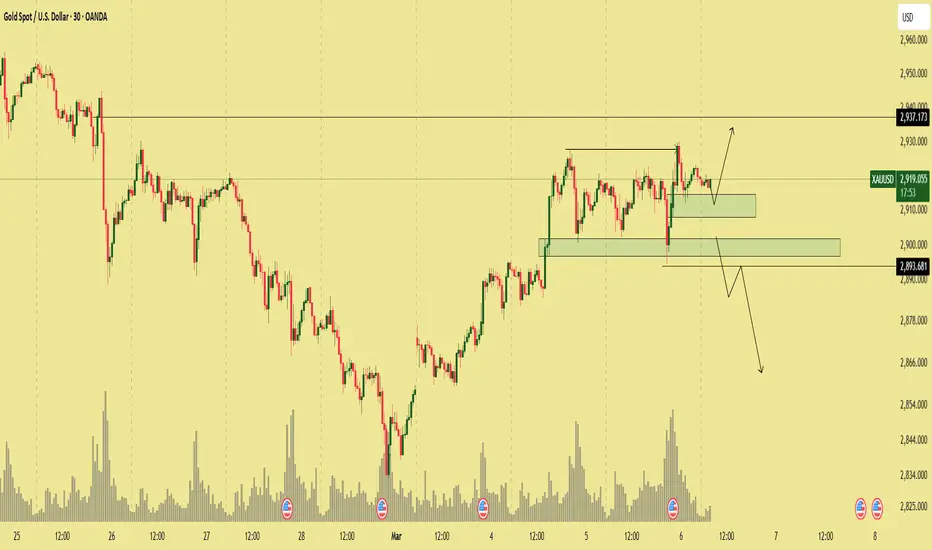
BUY ONLY!Price has broken to create a new high, thanks to the buying force we analyzed and waited for the previous day.
2 price zones buy waiting scenario.
Consider the points in the smaller time frames to have the optimal entry point
1 sell scenario also needs to be planned when the price breaks - that is, there is a m30 candle closing below the price of 2893.6
I will update the specific scenario when the price breaks out!
#XAUUSD
Gold Extends Three-Day Rally Amid Economic Weakness, Trade UncerGold has posted three consecutive sessions of gains this week as markets react to a combination of weak economic data, prolonged trade tensions, and resurging geopolitical risks.
U.S Economic Data Signals Slowdown
The latest U.S economic reports continue to point toward a weakening outlook. February’s ADP Non-Farm Employment Change came in at just 77,000, significantly below expectations of 141,000 and the prior month’s 186,000. This suggests a cooling labor market, raising concerns about the pace of economic growth. Meanwhile, the S&P Global Services PMI exceeded forecasts but remains insufficient to restore confidence in a sustained economic recovery.
Trade Tensions Remain a Market Headwind
A temporary relief came as President Trump announced a delay in tariffs on imported automobiles from Mexico and Canada. However, this reprieve is short-lived, with tariffs set to be reassessed on April 2, leaving uncertainty in place. Furthermore, unresolved trade tensions with China continue to weigh on market sentiment, keeping investors cautious and supporting safe-haven demand for gold.
Geopolitical Risks Drive Safe-Haven Flows
On the geopolitical front, tensions have escalated following the U.S. decision to halt military aid to Ukraine. At the same time, NATO has reinforced its military presence and reaffirmed support for Ukraine, increasing investor fears of a potential conflict escalation. These developments have further fueled demand for gold as a hedge against geopolitical instability.
Market Focus Shifts to Key Economic Data
As the week progresses, investors will closely monitor upcoming economic reports, particularly the Non-Farm Payrolls (NFP) and unemployment rate. These data releases could have a significant impact on gold’s trajectory and broader financial markets. A weaker-than-expected jobs report may reinforce expectations of economic slowdown, strengthening gold’s bullish momentum, while a robust reading could temper the metal’s gains.
Gold’s recent rally underscores its resilience as a safe-haven asset amid macroeconomic and geopolitical uncertainties. The short-term outlook remains bullish, with market dynamics favoring continued strength unless a significant shift in economic conditions or policy direction emerges.

Gold biasin 1hr time frame gold is setting up for a big buy with the following confirmations
1. a bullish rectangle formed in 1hr tf
2 three white crows candle stick in 1hr tf
3. the bullish rectangle formed and connects all time frame from 1m tf up to 4hr tf
4. in daily time frame you can see the massive double rejection to the upside
5. you can also see on the daily time the double bullish rejection block (double hammer) which is a strong bullish momentum

XAU_USD LONG RESULT Gold Held our stong support from January and reversed from that zone and began holding a new support Trendline from which I took a long trade and it moved well in our direction and hit TP.

Daily Analysis- XAUUSD (Thursday, 6th March 2025)Bias: No Bias
USD News(Red Folder):
-Unemployment Claims
Analysis:
-Expecting consolidation before NFP news
-Looking for a retest on the key levels
-PotentialBUY/SELL if there's confirmation on lower timeframe
-Pivot point: 2940 , 2900
Disclaimer:
This analysis is from a personal point of view, always conduct on your own research before making any trading decisions as the analysis do not guarantee complete accuracy.

Target hitHello everybody, As I said gold will fall and it happened but gold touched the price 2894 and fly, Gold has fallen and flown 2930 both targets done. For more details check out my pinned idea

USOIL – Holding Support or Preparing for a Drop? USOIL – Key Market Outlook & Trade Setup
WTI Crude Oil (USOIL) is trading near a critical pivot zone (71.78), struggling to break higher. The price action suggests a potential reversal or continuation, depending on upcoming confirmations.
🔼 Bullish Scenario:
If USOIL breaks and holds above 71.78, it may attempt to test 72.72.
A breakout above 72.72 could lead to further upside toward 77.37 in the coming sessions.
🔽 Bearish Scenario:
Failure to break 71.78 or rejection from the pivot zone could push the price lower.
A break below the ascending support trendline (around 68.50 - 68.00) could trigger a bearish continuation toward 67.03 and 63.50.
Historically, pullbacks have occurred at this level, so buyers may step in again if price reaches key supports.
📍 Key Levels to Watch:
🔸 Pivot Zone: 71.78
🔸 🔼 Resistance: 72.72 | 77.37 | 79.49
🔸 🔽 Support: 68.53 | 68.00 | 67.03 | 63.50
⚡ Market Outlook & Strategy:
Above 71.78, bulls may take control, aiming for 72.72+.
Below 71.78, the price could retest lower supports around 68.50 - 68.00 before deciding its next move.
The monthly resistance trendline remains intact, making it a crucial level for long-term traders.

XAU_USD SHORT RESULT Gold price broke down my major Support and retest the support zone with a wick and rejected from it and price went bearish so I took a short trade and good results as Always.
