Gold forecast - long term Weekly - XAU/USD (Gold vs. US Dollar)
As shown, note the following:-
1. Price Action and Candlestick Patterns:
• The price has been in a strong upward trend but is showing signs of a pullback near a key resistance level.
• Consecutive red candles indicate a potential start of a price correction.
• The price is approaching a key resistance at 2989.813, with initial support at 2790.100 and stronger support at 2583.900.
2. Harmonic Pattern (Butterfly):
• A reversal harmonic pattern is visible on the chart, signaling a potential downward correction after a strong bullish move.
• The completion of this pattern increases the likelihood of a pullback toward the support levels mentioned.
3. Volume Indicator:
• There’s a noticeable decrease in trading volume despite the continued upward movement, reflecting weakening bullish momentum.
• A negative divergence between price and volume suggests a potential upcoming correction.
4. Relative Strength Index (RSI):
• The RSI reached overbought levels (above 70) and has started to decline, indicating possible profit-taking and a correction phase.
• A negative divergence between the price and the RSI supports the probability of a downward move.
As Future Outlook:
🔴 Bearish Scenario (Most Likely):
• A break below 2790.100 could open the way for a drop toward 2726.300 and then to 2583.900.
• Monitoring volume and RSI behavior is crucial to confirm continued downside movement.
🟢 Bullish Scenario (In Case of Breakout):
• A bullish Harami candle is clearly shown as breakout and weekly close above 2989.813 could push the price higher toward the 3100.000 level.
Futures market

XAUUSDI start with a consolidated Gold, we could see certain corrections in the bearish price, it should be noted that its plus continues to rise

BUY - XAUUSD (SNIPER)Gold price ( XAU/USD) attracts some buyers to around $2,915 during the early Asian session on Monday. Global uncertainty and the threat of a global trade war by US President Donald Trump provide some support to the precious metal.
Last week, US President Donald Trump on Thursday issued an executive order exempting goods from both Canada and Mexico under a North American trade agreement, known as USMCA, two days after imposing them. However, US Commerce Secretary Howard Lutnick said late Sunday that the 25% tariffs on steel and aluminum imports, set to take effect on Wednesday, are unlikely to be postponed. The uncertainty surrounding Trump’s tariff policies is likely to boost safe-haven flows, benefiting the Gold price in the near term.
GOLD BUY 2910-2907
TP 1: 2915
TP 2: 2920
TP 3: 2925/OPEN
SL 2904
#DOLLARHUNTERX

Gold 4 hour swing trade buy 2880Back this week with another swing trade.
Looking to buy at 2880 , this was previous support structure.
My conformations for this is based on wekly, daily and 4 hour trend lines plus the fibanocci level of 0,382 is right on my entry point.
I do these trades up based on technical analasis and my advice as always is go small be prepared for some drawdown and use proper risk management.
These trades are not meant to be finincial advice but mearly my own take on market structure.
Trade safe thei coming week.

Seize the opportunity to go long on goldFrom the trend point of view. Comparing the long and short positions, the long position is still slightly stronger. At present, the gold price fluctuates in a narrow range around 2905. There is no major news to boost or suppress the gold price in the short term. From the trend point of view, it is obvious that the rebound of gold is not enough to support the rebound and continuation of the breakthrough of gold. Therefore, after consuming a certain amount of short-selling power, the bulls will regain control of the situation, and there will be very good trading opportunities for long gold. Now we are long gold around 2905-2910. The target is 2915-2920 area, wish us good luck! Brothers, are you following me to go long on gold?

[Opinion] Short Position on Gold (XAUUSD)Based on W and 4H, it sill on uptrend
However, due to adjustment, we have to go down in short time frame such as 15M on my view.
Thus, in my case, I will take short position
1. Entry: 2913 - 2914 Range
2. Stop Loss: 2923 - 2924 Range (YES, it is quite wide! but I will do risk management for taking all profits based on trend.)
3. Take Profit: 2766 - 2765 Range (YES again! it would be very greedy)
I do not like to open short position, usually long position bring more money.
On the other hand, I do not want to ignore the signal which show on my view.
Anyway, it is my opinion.
Hope you guys share your idea as well

Gold is still expected to hit the 3,000 markFrom the analysis of gold trend, we focus on the 2880-2870 first-line support below and the 2930-35 first-line suppression above. In terms of operation, we still focus on stepping back and doing long. In the short term, we can continue to do long around this range. Once a breakout of 2930-2935 occurs, gold will inevitably touch the previous high, or even reach 3000.
The fluctuations in the gold market are like a long journey. It has not yet reached its peak, but please believe that every hibernation is for a more powerful take-off. Patiently hold, the harvest often belongs to those who can keep calm, hold on, and victory is ahead.
You can read bottom signals, interpret daily market trends, and share real-time strategies, so you no longer blindly follow the trend.

Analysis of gold market trend next Monday:
Gold technical analysis: This week, we have been emphasizing that gold is a volatile market. Facts have proved that our team's view is also very correct. We shorted under the pressure of 2930 and bought on dips at 2892. The gold price has fluctuated many times in this range. The price of gold has fluctuated within this range many times. Our team has also been short at high levels and long at low levels in this range, making profits continuously. As long as traders follow our team's ideas, they can easily make a lot of profits this week. Before the market moves out, the fluctuation will continue. Gold's non-agricultural and unemployment benefits on Friday are both bullish for gold, but gold still fell back after rising, and gold is still fluctuating. Gold was shorted at 2928-2930 after the US non-agricultural on Friday. It won two consecutive victories on Friday, but gold is still fluctuating. How long will it fluctuate?
From a technical perspective, gold closed positive this week and may rise or fall next week. If the yang continues to close next week, it is still expected to reach a new high in the later period. Single yin without consecutive yin can only be regarded as a callback rather than a reversal. If it closes negative, the weekly line will switch between positive and negative. The weekly resistance is near this week's high of 2930. If it breaks above, there is a high probability that it will reach the previous high near 2956 or even reach a new high. If 2930 cannot break above, the bottom will first look at the vicinity of 2885. Once it breaks down effectively, it will also go to the vicinity of 2870-2860. If the market wants to see a big pullback, it must effectively break through 2858, otherwise it will fluctuate at a high level and wash the market. Looking at the daily line closing the cross star for three consecutive days, the trend on Monday is unclear. Before breaking through yesterday's high and low points, it is recommended to go short at high levels and long at low levels.
Gold has fluctuated within the box shock range for 1 hour, but the gold 1-hour moving average has begun to turn. If it begins to diverge downward next week, the confidence of gold bulls may be suppressed. Gold is still oscillating in the box, but it should be noted that the resistance range is 2928-2930. Only by effectively breaking through 2930 can the upside be further opened. Therefore, our professional and senior gold analyst team recommends that before breaking through and standing on 2930, do not rush to chase gold at a high level. Either wait patiently for a deep correction to stabilize and be bullish, or wait for the strong attack to stabilize above 2930, and then confirm the stable bullish trend after the retracement. As for standing on 2930, the upper targets are 2945, 2956, and a new historical high.
On the whole, in terms of short-term gold operation ideas next Monday, our professional and senior gold analyst team recommends to focus on callbacks to do longs, supplemented by rebounds to go shorts. The top short-term focus will be on the 2928-2930 first-line resistance, and the bottom short-term focus will be on the 2890-2894 first-line support.


CHECK XAUUSD ANALYSIS SIGNAL UPDATE > GO AND READ THE CAPTAINBaddy dears friends 👋🏼
(XAUUSD) trading signals technical analysis satup👇🏼
I think now (XAUUSD) ready for( BUY )trade ( XAUUSD ) BUY zone
( TRADE SATUP) 👇🏼
ENTRY POINT (2909) to (2910) 📊
FIRST TP (2914)📊
2ND TARGET (2918)📊
LAST TARGET (2924) 📊
STOP LOOS (2902)❌
Tachincal analysis satup
Fallow risk management

Can gold bulls continue their strength?Market news:
Spot gold fluctuated in a narrow range in early Asian trading on Monday (March 10), and is currently trading around $2,913/ounce. London gold prices have fluctuated at high levels for three consecutive trading days, but they still rose 1.85% on a weekly basis, helped by safe-haven inflows and the U.S. employment report showing lower-than-expected job growth in February, suggesting that the Federal Reserve is expected to cut interest rates this year. In addition, the volatile tariff policy of U.S. President Trump has also increased uncertainty.Federal Reserve Chairman Powell said earlier on Friday that the Fed will be cautious about easing monetary policy, adding that the economy is "still in good shape." U.S. real yields, which are negatively correlated with international gold prices, rose 3.5 basis points to 1.981%, which is a negative factor for international gold.The easing of geopolitical tensions also limited the rise in gold prices, and some progress has been made in a possible ceasefire agreement between Ukraine and Russia. In the Middle East, U.S. President Trump continues to pressure Hamas to release hostages. Meanwhile, according to data from the World Gold Council, the People's Bank of China continues to buy gold. The People's Bank of China increased its gold holdings by 10 tons in the first two months of 2025. However, the largest buyer was the Polish central bank, which added 29 tons of gold reserves, the largest purchase since it bought 95 tons of gold in June 2019. Overall, the rise in gold prices last week once again highlighted its importance as a safe-haven asset. Although the market may face consolidation in the short term, geopolitical risks, inflation concerns and uncertainty about the Federal Reserve's policies will continue to support gold demand. The market's focus is on the upcoming Federal Reserve meeting. In addition, inflation reports and retail sales data will also provide more clues to the market.
Technical Review:
Gold maintains a long-short cycle and operates in a wide range of oscillations. The weekly chart continues to operate in an upward trend structure, and the price retreats above the MA7-day moving average to close with a small positive. The daily chart continues to close with a negative cross line. Gold rose sharply above the 2930 mark in the late trading and then formed a high-rise decline, continuing to maintain a high-level wide-range oscillation and a non-continuation of the market consolidation stage. At present, the MA10/7-day moving average of the daily chart is at the 2902 line for adhesion adjustment, and the Bollinger Bands are gradually shrinking, with the upper track at 2956 and the lower track at 2867. In the early trading, the gold price is at the Bollinger Band middle track price at 2912. The short-term four-hour chart also has a continuous closing of the upper track at 2927 and the lower track at 2900. The RSI indicator is in the middle axis 50 value consolidation, and the K-line pattern is alternating between long and short cycles. The trading at the beginning of the week maintains a wide range of oscillations. There are opportunities for short-term participation in the layout of high-altitude and low-long. Pay attention to the 2890/2930 range oscillation during the day.
Today's analysis:
The gold market remains volatile, and there is still no tendency to break through the high and low points. Even when the non-agricultural data and unemployment rate were both bullish last Friday, gold only rebounded by more than ten US dollars, and then quickly fell to the bottom support line near 2895! The performance of the data market in recent months is basically the same, which also shows that the current gold market is seriously decoupled from the data. Only the interest rate decision can slightly change the direction of the market! Faced with the current trend of gold, we can only continue to see volatility!In the morning, the gold price continued the rebound trend of the non-agricultural market. There are only two operating points in the morning. One is to wait for the gold price to continue to attack and reach the pressure near the 2930 range to short, and the other is to wait for the gold price to adjust in the morning and reach the 2900 range to go long. However, the rebound is expected to reach the upper 2930 pressure first, which can give us more opportunities to go short than to go long. At present, the gold price is at the middle level of the range, so we should wait and see!
Operation ideas:
Short-term gold 2903-2905 buy, stop loss 2894, target 2920-2930;
Short-term gold 2929-2931 sell, stop loss 2940, target 2900-2890;
Key points:
First support level: 2903, second support level: 2892, third support level: 2882
First resistance level: 2920, second resistance level: 2928, third resistance level: 2940

Gold for tommorw Hit support and will go up simple howeevr it vcna invesre adn eaily hit sl so should be careful on how to trade it

Gold 1H Intra-Day Chart 10.03.2025Gold dropped lower towards $2,882 which I said yesterday was a possibility. What's next?
Option 1: Gold pushes higher from CMP, towards $2,900.
Option 2: Gold keeps dropping lower towards $2,850.
Which option do you agree with more?

Bearish Outlook for VX1!Bearish Post Description for TradingView
Title: Bearish Outlook on VIX Futures - Time to Brace for a Pullback!
Hey traders, take a look at this VIX Futures chart (CBOE Volatility Index - VX1 Futures) published by FairValueBuffet on TradingView (Mar 10, 2025, 20:58 UTC). The technicals are screaming caution, and here’s why:
- Supply/Demand Zone Breakdown: We’ve hit a critical supply zone (highlighted in yellow) with a sharp spike, suggesting heavy selling pressure. The price action is showing rejection at this level, hinting at a potential reversal.
- Moving Averages: The 18-week and 52-week SMAs are converging, with the price breaking below the shorter-term SMA, reinforcing bearish momentum.
- Bearish Divergence: The RSI and Williams %R at the bottom show clear bearish divergence. Despite a price spike, the momentum indicators are declining, indicating weakening bullish strength.
- Seasonality Indicator: The bottom-right seasonality chart (COT data for VX Futures) shows a historical tendency for volatility spikes around this time, often followed by a correction.
With the VIX jumping to 24.700 and a volume of 137.66K, coupled with the bearish technical setup, I’m anticipating a pullback in the near term. Keep an eye on the 20.000 support level—failure to hold could see us testing lower grounds. Let’s stay cautious and consider short opportunities or hedging strategies!
---
CBOE:VX1! CME_MINI:ES1! AMEX:SPY
Bullish Case for S&P 500 - Fundamental Perspective
While the VIX chart suggests short-term volatility, the broader S&P 500 presents a compelling bullish case based on fundamentals as of March 10, 2025. Here’s why we might see upside potential:
- Economic Resilience: Recent data points to robust corporate earnings growth, with many S&P 500 companies exceeding Q4 2024 expectations. This earnings strength supports a sustained rally.
- Interest Rate Outlook: The Federal Reserve has signaled a dovish stance, with potential rate cuts on the horizon. Lower interest rates typically boost equity valuations, especially for growth stocks in the S&P 500.
- Gold and Bonds Correlation: The chart shows a dip in gold prices and bond yields stabilizing, which historically correlates with risk-on sentiment. This could drive capital back into equities, favoring the S&P 500.
- Market Sentiment: Despite short-term volatility (as seen in the VIX), investor confidence remains high, supported by strong consumer spending and improving global trade conditions.
Given these fundamentals, the S&P 500 could be poised for a bullish run, especially if volatility subsides and the 18-week SMA on the VIX chart starts to flatten. Consider long positions or adding exposure if the market holds key support levels. Stay tuned for confirmation!
---
Note: This analysis is based on the provided chart and my knowledge up to March 10, 2025. For the latest updates or to validate these trends, I can perform a web search or analyze additional X posts if requested!
Not Financial Advice

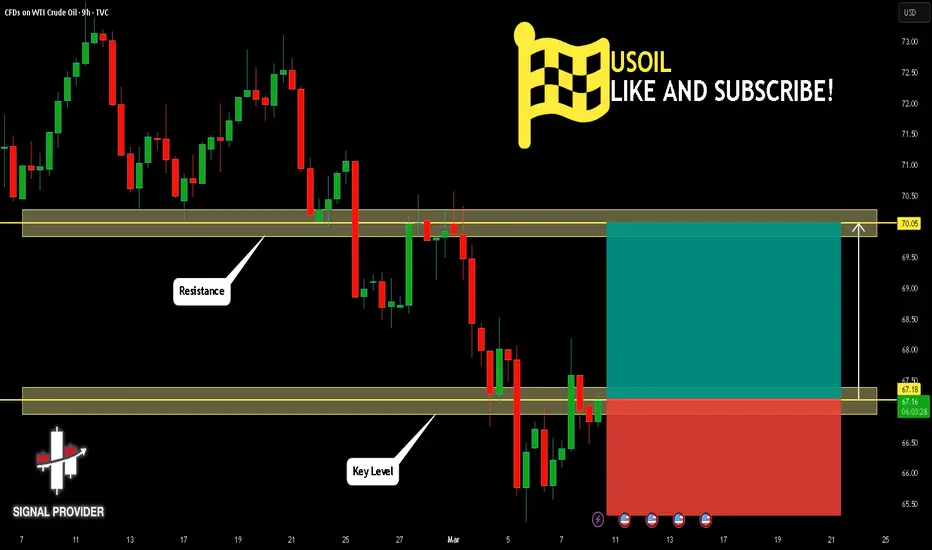
USOIL Will Go Higher From Support! Buy!
Take a look at our analysis for USOIL.
Time Frame: 9h
Current Trend: Bullish
Sentiment: Oversold (based on 7-period RSI)
Forecast: Bullish
The market is on a crucial zone of demand 67.18.
The oversold market condition in a combination with key structure gives us a relatively strong bullish signal with goal 70.05 level.
P.S
Please, note that an oversold/overbought condition can last for a long time, and therefore being oversold/overbought doesn't mean a price rally will come soon, or at all.
Like and subscribe and comment my ideas if you enjoy them!
XAUUSD Analysis Today Hello traders, this is a complete multiple timeframe analysis of this pair. We see could find significant trading opportunities as per analysis upon price action confirmation we may take this trade. Smash the like button if you find value in this analysis and drop a comment if you have any questions or let me know which pair to cover in my next analysis.

WTI Oil H4 | Rising into overlap resistanceWTI oil (USOIL) is rising towards an overlap resistance and could potentially reverse off this level to drop lower.
Sell entry is at 68.46 which is an overlap resistance that aligns with the 38.2% Fibonacci retracement level.
Stop loss is at 70.70 which is a level that sits above the 61.8% Fibonacci retracement and a multi-swing-high resistance.
Take profit is at 65.20 which is a swing-low support.
High Risk Investment Warning
Trading Forex/CFDs on margin carries a high level of risk and may not be suitable for all investors. Leverage can work against you.
Stratos Markets Limited (www.fxcm.com):
CFDs are complex instruments and come with a high risk of losing money rapidly due to leverage. 63% of retail investor accounts lose money when trading CFDs with this provider. You should consider whether you understand how CFDs work and whether you can afford to take the high risk of losing your money.
Stratos Europe Ltd (www.fxcm.com):
CFDs are complex instruments and come with a high risk of losing money rapidly due to leverage. 63% of retail investor accounts lose money when trading CFDs with this provider. You should consider whether you understand how CFDs work and whether you can afford to take the high risk of losing your money.
Stratos Trading Pty. Limited (www.fxcm.com):
Trading FX/CFDs carries significant risks. FXCM AU (AFSL 309763), please read the Financial Services Guide, Product Disclosure Statement, Target Market Determination and Terms of Business at www.fxcm.com
Stratos Global LLC (www.fxcm.com):
Losses can exceed deposits.
Please be advised that the information presented on TradingView is provided to FXCM (‘Company’, ‘we’) by a third-party provider (‘TFA Global Pte Ltd’). Please be reminded that you are solely responsible for the trading decisions on your account. There is a very high degree of risk involved in trading. Any information and/or content is intended entirely for research, educational and informational purposes only and does not constitute investment or consultation advice or investment strategy. The information is not tailored to the investment needs of any specific person and therefore does not involve a consideration of any of the investment objectives, financial situation or needs of any viewer that may receive it. Kindly also note that past performance is not a reliable indicator of future results. Actual results may differ materially from those anticipated in forward-looking or past performance statements. We assume no liability as to the accuracy or completeness of any of the information and/or content provided herein and the Company cannot be held responsible for any omission, mistake nor for any loss or damage including without limitation to any loss of profit which may arise from reliance on any information supplied by TFA Global Pte Ltd.
The speaker(s) is neither an employee, agent nor representative of FXCM and is therefore acting independently. The opinions given are their own, constitute general market commentary, and do not constitute the opinion or advice of FXCM or any form of personal or investment advice. FXCM neither endorses nor guarantees offerings of third-party speakers, nor is FXCM responsible for the content, veracity or opinions of third-party speakers, presenters or participants.

Gold market analysis: 10-Mar-2025Good morning! Happy New Week! Happy New Day! Here's your daily Gold market analysis. Learn, grow, and trade wisely.

XAUUSD TODAY TARGETCheck out my target for today and follow it. It's a very good and confirmed target

NASDAQ – Will It Hold or Collapse Further?📉🔥 NASDAQ Approaching Max Pain – Will It Hold or Collapse Further? 🚀⚠️
The NASDAQ 100 is hanging by a thread, as price approaches the key 19,106 support level. A breakdown from here could accelerate losses toward the 18,283 zone, and if things get worse, the dreaded 16,732 "Max Pain" level may be tested.
📊 Key Technical Levels:
📌 19,106 – First major support (bounce or breakdown zone).
📌 18,283 – Next key level if sellers take control.
📌 16,732 – The "Max Pain" zone, where long-term buyers may step in.
📌 15,347 – Ultimate demand zone if things spiral out of control.
🚨 Why Is Nasdaq Falling?
Tech stocks are getting destroyed, with Tesla leading the plunge.
Market panic over higher interest rates & economic uncertainty.
Bitcoin also struggling, highlighting broader risk-off sentiment.
💡 Will we see a relief rally from these levels, or is the bloodbath just getting started?
Drop your thoughts below!
One Love,
The FXPROFESSOR 💙
#Nasdaq #StockMarketCrash #TechStocks #Trading #MarketAnalysis

XAUUSD sell limitLooking at gold and i am looking to short, we can see that gold has broken below a significant level.... looking to short this pair to the next 4hour zone lets see how it goes

Resistance on the Edge? A breakout in Sight!In our previous analysis, we anticipated a price drop—and it played out perfectly, securing 10,315.6 pips in profit.
What’s Next?
Now, after analyzing multiple timeframes, we see that the price has bounced off the 2nd large channel’s middle line, a key support level respected multiple times in the past. Currently, it’s trading around 2915.44, near our resistance zone at 2922.
Since March 4 (Tuesday), the price has been testing this level repeatedly, suggesting that the resistance is weakening. If 2922 breaks, our next targets will be:
📍 2940 – Next resistance zone
📍 2949 – First price target
📍 2968 – Second price target
🛡 A trader’s first goal is survival. Profits come second.
🔑 Take care of your losses, and the profits will take care of themselves.
Stay disciplined and trade wisely. Happy trading!

Possible upward pullbackCrude oil is on a bearish trend based on higher timeframes but is currently showing bullish pressure as a potential pullback. The potential upward pullback may try to retest the 70.0 barrier. Breaking further and settling above the 70.0, may see a rise towards resistance barriers between 71.00 and 73.00 as potential bearish sell zones.
