UNIQUE FIRE HOLDINGS BERHAD
Trend: The overall trend appears to be bullish in the medium term. After reaching a low in March, the stock has been making higher lows and higher highs, indicating an uptrend.
Moving Averages: The stock is currently trading above both the short-term (blue line) and long-term (green line) moving averages, which is typically a bullish signal. The moving averages are also sloping upwards, confirming the uptrend.
Support and Resistance: Key support levels appear to be around MYR0.320-MYR0.330, while resistance seems to be around MYR0.440-MYR0.455 based on previous price action.
Price Action: The stock has shown volatility, with several large candles both up and down. Recent price action shows a pullback from the August highs, but the stock seems to be finding support and potentially resuming its upward movement.
Momentum: While there was strong upward momentum from June to August, it has slowed recently. The current candle (green) suggests a potential resumption of bullish momentum.
Patterns: There's a potential cup and handle pattern forming from July to September, which if confirmed, could be bullish.
Overall, the technical indicators suggest a cautiously bullish outlook. The stock is in an uptrend but experiencing some consolidation. Traders might watch for a breakout above recent resistance levels as a potential entry point, while also being aware of the support levels for potential stop-loss placement.

FAJARBARU BUILDER GRP BHD
The price has bounced off the lower Bollinger Band, indicating the possibility of an oversold condition, and is now moving toward the middle band (likely the 20-day moving average).
Volume shows an uptick during this bounce, which is bullish, as it suggests that buyers are stepping in at this level.
Support: Around MYR0.380, where the price found a recent base.
Resistance: The immediate resistance seems to be around MYR0.420–MYR0.440 (the middle Bollinger Band and previous price action zone). Further resistance lies around MYR0.500 where the upper Bollinger Band currently resides.
Short-term bullish, with the potential for further upside as the price moves toward resistance levels.
Aggressive traders: May consider entering long positions near current levels, with a target around MYR0.440 and a stop loss below MYR0.380.
Conservative traders: May want to wait for a confirmed breakout above the 50-day SMA or middle Bollinger Band before entering a long position.

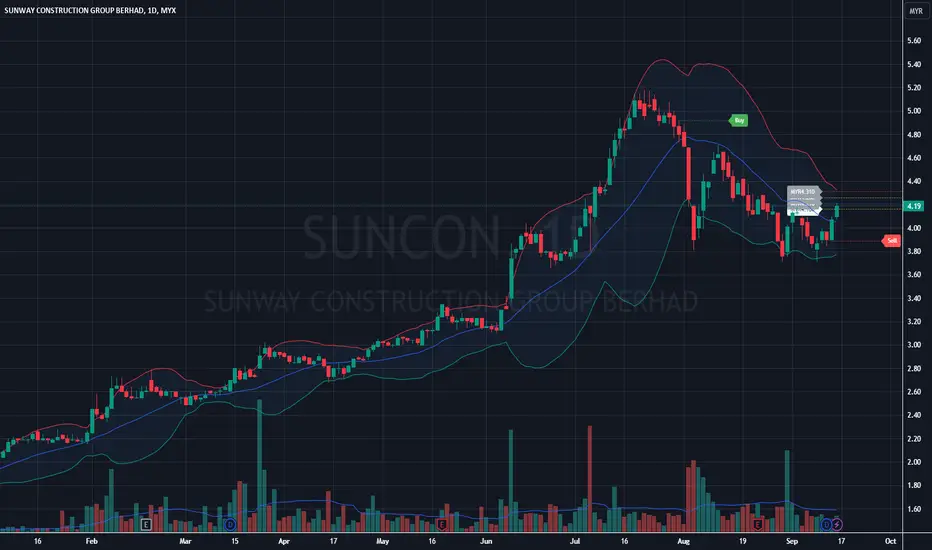
SUNWAY CONSTRUCTION GROUP BERHAD
Recently, the stock appears to be rebounding from the lower levels (around MYR4.00), currently trading at MYR4.19.
The current rebound shows the price nearing the middle band (which typically represents the 20-period moving average).
Support is observed around the MYR4.00 level, where the price has rebounded recently.
Resistance is likely to be around MYR4.40 to MYR4.50, the region of the middle Bollinger Band and the moving average.
Strong resistance is also seen at MYR5.20, the high from late July.
The stock is currently in a recovery phase after a significant correction. A break above the 50-day moving average and the middle Bollinger Band could signal further upside potential. However, the low volume during this rebound suggests caution. Traders may want to wait for a confirmation of increased volume and a solid break above key resistance levels for a stronger bullish signal.
MAGNA PRIMA BHD
Recent candles show consolidation with relatively small body candles, reflecting indecision. There are no clear bullish or bearish patterns in the last few sessions, which suggests the market may be waiting for a catalyst.
The most recent candlestick is a green one, indicating slight buying pressure. However, the small size suggests that buyers haven’t fully taken control yet.
The volume is relatively low during the most recent trading sessions. This low volume might suggest a lack of conviction from both buyers and sellers. A breakout accompanied by higher volume could be a strong signal for the next move.
Resistance: Around the MYR0.680 - MYR0.700 level, where previous candles touched the upper Bollinger Band but failed to break through.
Support: Near the MYR0.600 level, which aligns with the middle Bollinger Band and previous price bounces.
The stock is consolidating within the Bollinger Bands. Watch for a potential breakout either above the upper band (bullish) or below the lower band (bearish). A breakout with high volume would strengthen the signal.
The moving averages also indicate slight bullish momentum, but confirmation is needed, especially with more convincing volume and stronger candlestick patterns.

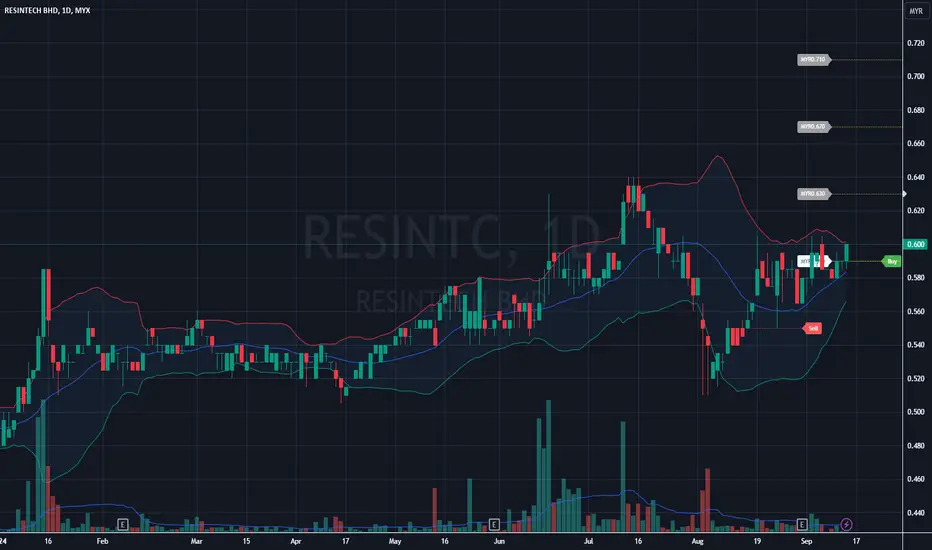
The stock is trying to recover after a downtrendBollinger Bands :
The price is currently near the upper Bollinger Band, which suggests a bullish sentiment.
Trend and Momentum :
The current upward movement might face resistance at RM0.60, which could act as a psychological or technical level for traders.
Support and Resistance :
Support: Around RM0.55 and RM0.50 appear to be strong support levels. Price bounced off from this area multiple times.
Resistance: The RM0.60 level is a significant resistance, as it has capped the price recently. A clean break above this level could lead to further upside, possibly testing RM0.64 (where there was a high in early July).
Outlook :
Bullish case: A close above RM0.60 with strong volume might push the stock toward the upper resistance levels at RM0.64 and higher.
Bearish case: A failure to break above RM0.60 could lead to a pullback toward the midline of the Bollinger Band (around RM0.58) or even lower.
Overall, the current chart is indicating a potential breakout attempt, but confirmation with volume and a sustained move above RM0.60 will be key to continuing the uptrend.
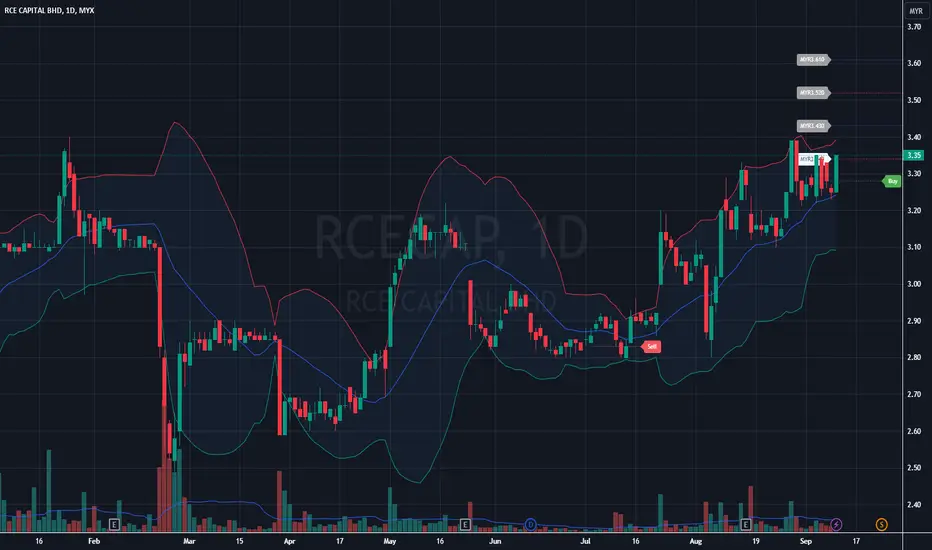
The short-term trend appears to be upwardBollinger Bands :
Middle Band: The price is above the middle band, suggesting bullish momentum in the short term.
Volume :
Recent volume is lower but steady, which shows no excessive buying or selling pressure.
Price Action :
Currently, the price is consolidating in a sideways range after the latest upward move, which may indicate a potential breakout or pullback.
Conclusion :
Bullish Bias: The price is trending upwards with support from the moving average, and it's currently near the upper Bollinger Band, so some profit-taking might occur soon.
Watch for Breakout: If the price breaks above the recent high (~3.40), there could be a continuation of the uptrend. However, if the price fails to sustain and drops below the middle Bollinger Band or the moving average, a pullback or correction could follow.
PMHLDG - Require a strong bullish momentumN wave with E, N, V & NT projection.
The price has slightly crossed above the down Kumo, which indicates a potential shift in momentum from bearish to bullish. However, this needs confirmation by staying above the key levels.
The Chikou Span crossing above the candle price is a bullish signal, showing that current price action is stronger than it was 26 periods ago, further hinting at a potential upward move.
NT level (0.395): This is the immediate resistance. A close and sustained price action above this level will confirm the bullish breakout. If the price closes above the NT level (0.395), it will confirm the bullish trend. A potential entry could be considered around 0.395–0.400.
The price needs to maintain its position above the NT level to confirm the continuation of bullish momentum. Any reversal below NT could invalidate the setup, so close monitoring is crucial.
Note:
1. Analysis for education purposes only.
2. Trade at your own risk.

The stock is in an uptrend on the daily chartCandlestick Patterns :
The price hit a high of MYR2.50 and closed at MYR2.48 (+3.33%) on the daily timeframe.
Bollinger Bands :
The price is currently near the upper band, suggesting potential overbought conditions. However, since the price is continuing to rise, it could signal a strong bullish trend if the price remains close to the upper band.
Trend Analysis :
The overall trend seems bullish as the price is making higher highs and higher lows. It’s supported by the price staying above the moving average.
A continuation of the uptrend would depend on the price breaking through the MYR2.50 level.
Possible Scenarios :
Bullish Case: If the price breaks above MYR2.50, the next potential targets would be the next psychological round numbers, such as MYR2.60 or higher.
Bearish Case: If the price fails to break the MYR2.50 resistance and falls below the moving average (around MYR2.25), it could signal a shift in momentum toward a correction or consolidation phase.

EVERSENDAI CORPORATION BERHADTrend :
Current Situation: The recent price action shows a slight rebound from the lows, with price pushing above the moving average.
Indicators :
Bollinger Bands : The price is currently touching the middle of the Bollinger Bands. This usually indicates that the stock is in a neutral zone after rebounding from the lower band. The upper and lower bands suggest a period of volatility expansion earlier, but currently, the bands are contracting, indicating a period of low volatility or consolidation.
Key Support and Resistance Levels :
Resistance: Around MYR0.60 (past peak levels from July and early August).
Support: Around MYR0.480 (recent low in early September), also aligning with the lower Bollinger Band.
Possible Scenarios :
Bullish Case: If the price continues to rise above the moving average and heads toward the upper Bollinger Band, breaking the resistance around MYR0.60, there could be a potential move higher toward MYR0.65 and beyond.
Bearish Case: If the price fails to sustain above the moving average and breaks below MYR0.50, it may retest the recent low of MYR0.480 or lower.

SENDAI - Analysis on potential of price movementY wave, target (E) within stipulated range.
The price is at 0.520, showing consolidation near a potential minor resistance zone after a short-term bullish reversal from the turning point (D).
The price has crossed Tenkan-Sen and Kijun-Sen but needs to stay above both lines to confirm continued upward momentum.
A possible entry can be considered if the price manages to break above 0.525 with strong volume, confirming a continuation of the bullish reversal. Ensure to wait for a clear break and close above this level. Watch for increasing volume and momentum as the price approaches the 0.525 level. Failure to break this level could lead to further consolidation or a potential pullback to the support at 0.500.
In summary, the market has the potential for a bullish continuation if it stays above 0.525, targeting the 0.595 and 0.610 levels. However, close attention to volume and price action is essential to confirm the move.
R1 - 0.525
R2 - 0.540 (Senkou-Span B)
R3 - 0.570 (C)
S1 - 0.500
S2 - 0.425
Note:
1. Analysis for education purposes only.
2. Trade at your own risk.

SEAL - Need a strong momentum to maintained bullish continuationN wave with E, V, N & NT projection.
The stock is trading at 0.815, slightly above the NT projection of 0.800. A breakout above 0.855 could confirm the continuation of the bullish trend. 0.800 (NT) as immediate support and this level must hold to prevent a bearish reversal.
This strategy assumes a bullish continuation above the current price, with critical support at 0.800 needing to hold to maintain bullish momentum.
R - 0.855
S1 - 0.800
S2 - 0.780
Note:
1. Analysis for education purposes only.
2. Trade at your own risk.

TEXCYCL Wave 3My Predication using method Elliot Wave, Trendline, Fibonacci Extension, Chart Pattern, BODTL

MYEG - BullishMYEG - Bullish
Technically, this stock continues its bullish trend in 2024 from retracement in 2023 and came back to retracement and close at 0.915. Price remains in a bullish channel and stays above Kijun Sen level, which can be considered a healthy bullish trend at this moment.
Fundamentally, based on recent reports: -
Innovative Services and Blockchain Adoption:
MYEG expects to continue introducing innovative services by leveraging new technologies, specifically blockchain or Web 3.0. This forward-thinking approach aims to drive organic growth for the current financial year.
In the second quarter of 2024, MYEG’s net profit surged to RM165.42 million, up from RM111.56 million in the previous corresponding period. Revenue also grew significantly to RM242.28 million from RM184.88 million a year earlier.
Contributions from services provided by MYEG’s Zetrix blockchain platform, such as ZCert and Digital ID registration and transactions, played a significant role in this growth. Additionally, the sale of Zetrix tokens further boosted their financial performance.
Contract Extension with JPJ:
The Road Transport Department (JPJ) extended the service contracts of MYEG and its wholly-owned unit, MY EG Sdn Bhd (MYEGSB), for three years. These extended contracts will run from May 23, 2023, to May 22, 2026.
Historical Context:
MYEG, originally MY E.G. Services Sdn Bhd, changed its status to a public limited company and assumed its present name, MY E.G. Services Berhad, in conjunction with its listing on the MESDAQ Market. Later, in 2009, it successfully completed its transfer listing to the Main Board of Bursa Malaysia Securities Berhad.
MYEG’s commitment to innovation, blockchain adoption, and sustained financial growth positions it as a dynamic player in the Malaysian business landscape. Keep an eye on their developments.

TASCO BHD - Retracement in progress.TASCO BHD - Retracement
Currently in retracement of a bullish trend. Possibly WXY. Stay sideways until we see a bullish trend continuation. If one wants to invest for the long term, it's good to buy at wave Y.
On fundamental:
TASCO Berhad (Bursa Malaysia: TASCO), the logistics and warehousing services provider. As of recent reports, here’s what’s happening with TASCO:
Anticipated Recovery in Trade Activities:
TASCO is expected to exhibit a tale of two halves in its financial year ending March 31, 2024 (FY24). The first half of 2023 was somewhat lackluster due to seasonal factors and slower trade activities. However, the second half of 2023 is anticipated to be robust, riding on the recovery in trade.
Encouragingly, shipment volumes saw upticks in June and July, signaling positive momentum.
New Warehouses and Tax Incentives:
TASCO’s optimistic outlook is supported by contributions from its new warehouses. The construction of its 600,000 sq ft four-storey Shah Alam logistics center is on track, with rental space expected to be handed over to electrical and electronics as well as retail customers in 4Q24.
Additionally, TASCO’s 250,000 sq ft Westport logistics center expansion is set to be completed by November. This expansion is expected to generate around RM20 million in rental income per annum (excluding other services).
Financial Outlook and Valuation:
RHB Research maintains a “buy” call on TASCO, with a revised target price of RM1.70 (compared to RM1.83 previously). The downward revision in the FY24 earnings forecast accounts for a normalizing freight market.
TASCO’s valuation at 6.9 times the price-earnings ratio (P/E) is below the local and regional peer average, making it an attractive investment proposition. The company has consistently delivered earnings and generated cash flow.
In summary, TASCO is poised for a stronger performance in the latter part of 2023, benefiting from trade recovery, new warehouses, and favorable tax incentives. Keep an eye on their progress as they continue to expand and adapt to market dynamics.

PETDAG - Retracement Completed?Petronas Dagangan Bhd
We can see a triangle pattern correction ABCDE completed to form wave 4. Soon we may see a bullish continuation once prices exit the triangle.

Ending Diagonal Pattern at JHMJHM has reach support and the price break the down structure...For pattern i see the ending diogonal pattern(pattern for reversal) and pairing with bullish divergence...for me market will go up...this is sharing idea...not a buy call

PESONA - Potential of price movement analysisN wave with N, V & NT projection.
The price has tested the 52-week high at 0.260 three times and was rejected, indicating strong resistance at this level. The NT projection is acting as the immediate resistance, which the price is currently testing. Breaking above this could signal a continuation of the bullish trend.
The price is above the cloud, indicating a bullish trend. The thin cloud ahead suggests minimal resistance, supporting the possibility of a bullish breakout. The Tenkan-sen and Kijun-sen are aligned bullishly, providing additional support for the current uptrend.
A potential entry could be placed once the price breaks above the NT resistance level at 0.255, preferably with strong volume confirmation.
For this setup to succeed, the price needs to break and close above the 0.260 resistance level with strong momentum and volume. Keep an eye on price action around this level, as any rejection could lead to consolidation or a reversal.
In summary, the market needs to break through the immediate NT resistance at 0.255 and sustain momentum to challenge the 52-week high and push towards the V (0.295) and N (0.300) targets.
Note:
1. Analysis for education purposes only.
2. Trade at your own risk.

INTA - Potential analysis of price movementY wave, target (E) within stipulated range.
N wave with E, N, V & NT projection.
NT (0.485) as immediate support. This is the critical support level. If the price remains above 0.485, it indicates that the market retains its bullish momentum. The price is above the Kumo, indicating a bullish trend. The thin cloud ahead also suggests minimal resistance, which could help propel the price upward.
A potential entry could be placed slightly above the NT support level, around 0.490–0.495, as long as the price stays above 0.485 (NT).
For this setup to succeed, a strong bullish candle or volume spike is necessary to confirm upward momentum. Watch for price action and Ichimoku line crosses for additional confirmation.
This strategy will rely on the ability to maintain bullish momentum above NT (0.485), as any drop below could invalidate the upward trajectory.
Note:
1. Analysis for education purposes only.
2. Trade at your own risk.

PTT SYNERGY GROUP BERHAD - [PTT]Trend Analysis :
Short-term: The price has been consolidating after a sharp move up in June. The recent price action shows a potential rounding bottom formation, which could indicate a reversal to the upside.
Medium-term: There appears to be a pullback from the high in early August, suggesting a correction phase.
Bollinger Bands :
The price is currently near the middle of the Bollinger Bands, suggesting neutrality. However, after touching the lower band in mid-August, the price has started to move upwards, indicating the possibility of a reversion to the mean or even a breakout.
Volume Analysis :
The volume shows a significant increase during the sharp upward movement in June, suggesting strong buying interest. However, volume has been lower during the consolidation and correction phases, which is typical as the market digests the previous move.
Support and Resistance :
Support: The recent low around MYR2.00 serves as a key support level.
Resistance: The price level around MYR2.40, where the 50-day moving average is currently located, acts as resistance. Breaking above this level could signal further upside.
Candlestick Patterns :
The recent candles show small-bodied patterns with long wicks, suggesting indecision in the market. This could indicate a potential reversal if a strong candle appears.
Conclusion :
The stock is currently in a consolidation phase after a significant move up. The price is testing the 50-day moving average, and a breakout above this level could lead to a bullish continuation. Watch for a break above MYR2.40 with increasing volume for a potential entry signal. Conversely, a breakdown below MYR2.00 might indicate further downside.

MUI PROPERTIES BHD - [MUIPROP]Trend Analysis :
Uptrend: The chart shows a strong uptrend starting from late July to early September. The price has been making higher highs and higher lows, which is characteristic of an uptrend.
Candlestick Patterns :
Bullish Candles: The recent candles are mostly bullish, with the last few candles showing strong upward movement, indicating buying pressure.
Volume: The volume bars indicate a significant increase in trading volume, especially during the last few trading days, which suggests strong participation in the market, likely from institutional buyers.
Bollinger Bands :
Upper Band Interaction: The price has consistently tested or exceeded the upper Bollinger Band, suggesting strong bullish momentum. However, this could also indicate that the price is overextended and might be due for a pullback.
Band Expansion: The bands are widening, indicating increased volatility. This often occurs in strong trending environments.
Support and Resistance :
Support: A support level can be identified around the MYR0.380 area, which is where the price bounced back in late August.
Resistance: The immediate resistance is around the MYR0.465 level (the high on the day of the chart), which the price needs to close above for the continuation of the uptrend.
Potential Scenarios :
Continuation of Uptrend: If the price can break and close above the MYR0.465 resistance with continued high volume, the uptrend is likely to continue.
Pullback: Given the overextended state with the Bollinger Bands and recent sharp upward move, there could be a short-term pullback towards the support level around MYR0.380 or possibly the moving average line.
Conclusion :
The stock is currently in a strong uptrend with bullish momentum. However, caution should be exercised as the stock might experience a pullback due to overextension. Watching for how the price behaves around the MYR0.465 resistance and monitoring volume levels will be crucial for determining the next move.

GBGAQRS - Analysis on price movementN wave with E, V & NT projection.
The price is below the Kumo, indicating bearish momentum. The Kumo itself is bearish and relatively thick, suggesting strong resistance overhead.
The Tenkan-sen have crossed below the price, which might indicate a potential short-term bullish correction but within a generally bearish context.
Volume is low, indicating a lack of momentum, which is typical in a consolidating market or at the beginning of a reversal.
R1 - 0.380
R2 - 0.395 (Senkou span B)
S1 - 0.345 (Kijun-sen)
S2 - 0.325
As long as price maintained above 0.345, a potential bullish move is considered and shows strength moving towards 0.390. Alternatively, a conservative entry could be above 0.390 after confirmation of a bullish move.
Note:
1. Analysis for education purposes only.
2. Trade at your own risk.

VLB - Analysis on price movementN wave with E, N & NT projection.
Currently price is near the edge of upper Kumo, indicating that the stock is at a critical level between bullish and bearish momentum. The Kumo appears to be slightly bullish.
Tenkan Sen is flat, which often indicates a potential consolidation phase.
The price is hovering around the Kijun-Sen, which acts as dynamic support/resistance. It's currently being tested as a support level.
The current movement suggests a potential breakout toward the projected levels (N and E waves).
If price breaks above the descending triangle and NT level (0.580). This would confirm the continuation of the uptrend.
R1 - 0.530 (Tenkan Sen)
R2 - 0.580 (52w high)
S1 - 0.500 (Kijun Sen)
S2 - 0.475 (Senkou Span A)
Note:
1. Analysis for education purposes only.
2. Trade at your own risk.

SDS GROUP BERHAD - [SDS]Trend Analysis :
Short-Term Trend: The stock has been in an uptrend since early August, with a notable increase in both price and volume, indicating strong bullish momentum. The recent candles show higher highs and higher lows, typical of an uptrend.
Medium-Term Trend: The medium-term trend has been sideways from May to July, with prices consolidating between MYR0.85 and MYR1.05. The recent breakout above MYR1.05 signals a potential continuation of the uptrend.
Bollinger Bands :
The Bollinger Bands are expanding, which often indicates increased volatility. The price recently touched the upper band, which is generally seen as a sign of overbought conditions in the short term. However, the strong bullish candles suggest that the uptrend might continue, especially if the price stays above the middle band (20-day moving average).
Volume Analysis :
The volume spikes seen during the recent uptrend confirm the strength of the breakout. Increased volume on up days is a positive sign and suggests that the recent price move is supported by strong buying interest.
Support and Resistance Levels :
Immediate Support: Around MYR1.05, which was the previous resistance level before the breakout. If the price pulls back, this level could act as a support.
Immediate Resistance: Around MYR1.20, which is where the stock is currently trading. If the price continues to rise, this level could be tested as the next resistance.
Candlestick Patterns :
The recent candlestick pattern is a strong bullish candle, which suggests that buyers are in control. However, watching for any reversal patterns at the resistance level is essential.
Overall Sentiment :
The overall sentiment for SDS appears to be bullish in the short term, with strong price action, volume, and moving averages supporting the uptrend. However, traders should monitor the price action closely near resistance levels and be cautious of any signs of reversal or consolidation.
