CRWD - LONGTook a long on CRWD today ....
Not really exciting theme for me but a necessary one that's in demand :
1/2 gap before GLB ( and recent GLB breakout )
Tight clean moves , price action healthy
Good RS
Great EPS and Revenue

AMD is a buyHere's a chart of AMD showing a fib (anchors are circled). We are in a descending wedge and on the 61.8 of the retrace. We're also above a volume shelf. Looks poised to make a big move.

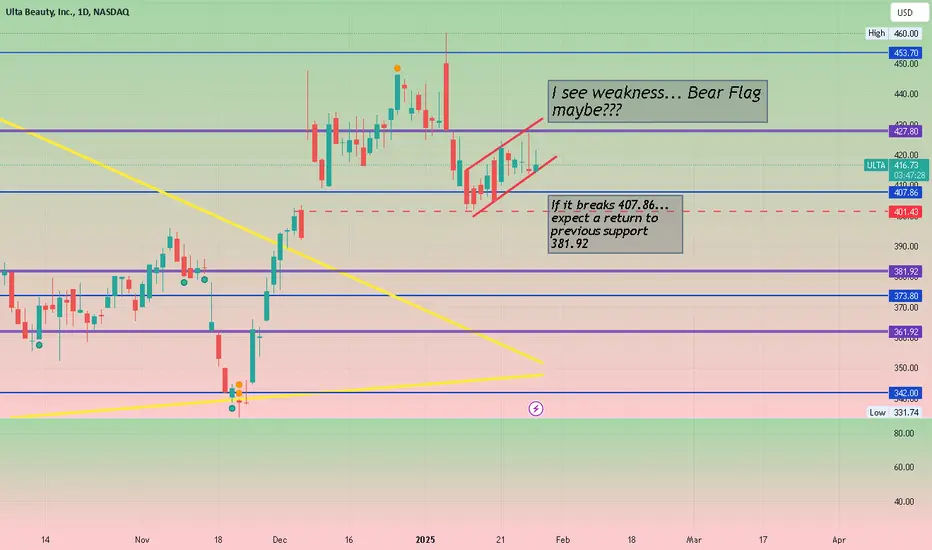
Bear Flagging... I see weakness on the daily. I'm looking at 2/28 380 Puts at a cost of about 4.00
Again, I am not a financial guru... just pointing out what I see and the play I'm interested in taking. Please attempt your own Due Diligence before jumping into a trade blindly.
PLR (Path of Least Resistance) Strategy Explanation - $SHOPHi guys this is a follow up to a post I have just published about my trading idea on shorting NYSE:SHOP ,
It really doesn't matter if you want to short the market or long the market as it works either way, but for the sake of the example I'll take a 6 months period from the Shopify chart following earnings to better explain you my strategy...
This right here is the NYSE:SHOP chart from approx. Jan/2024 to end of Aug/2024,
2 Earnings have been announced, both having great positive surprises, but regardless of the positive surprise (typically bullish indicator), the stock fell of 45%+.
Let's add the earnings dates to the chart so that you can better visualize them:
What you care about in this image is the earnings dates lined out, as you can see the surprise was positive yet both fell more than 10% in just a day, that I will take as the upcoming trend for at least the time being, till the next earning is announced (so, if for example the 13/Feb earning ended up being bearish, my overview on the market till at least the next earning on 8/May, will be bearish, so all of the trades I will take will be shorts).
Now I will line out the trend and the BoSs (breaks of structure) just to better visualize the trend:
As you can see the Earning date candles signed the beginning of a down trend twice, pre-announced by the Earning candle itself.
The entry strategy is now simple, the idea behind it is to "follow the path of least resistance".. by that I mean that, if your bias is bullish, who enter on candles that are of the opposite direction to the one you are heading to? - Sure you might say that it is to get better entries as ofc, on a short bias, higher sale points = better profits, but the goal here is not maximizing profits, but raising the odds exponentially so that you can take surer trades.
I've tested this strategy from Feb/2021 and so far the win rate is 95.6% (123 out of 136 trades profited .
The way the entries are spread is this:
Basically every time a bearish candle - that closes lower than the previous bearish candle did - is created, a short position of 1% of total equity is generated.
The period begins from the beginning of the current earnings season, and closes the day before the next earnings season as it works within a 3 months frame.
Each entry HAS to be the lowest bearish candle of the period, example:
Only these candles marked in blue count as entries for short positions as their close is lower of more than 0.5% than the previous one,
The pink ones are higher than the lowest up to that point, so they do not count as entries as they are technically part of a pullback that is moving in the opposite direction where you are heading.
So, going back to the entries, we enter on the close of the lowest bearish candle close up to that point.
For safety, we trail the stop loss to the previous high, this is where well defined trend lines come handy:
The thick black line is the trend line, and as new lows are broken, I mark those as BoS (break of structure) and until a new one is created, the SL will go to the previous high, and so it goes.
(viceversa for buys).
We then proceed to target the FVGs left behind by previous quarters:
As you can see there are massive gaps in the chart that we will target and identify as FVGs (Fair Value Gaps) and set the TP at the close (lowest point) of the fair value gap.
Now comes in your exit strategy...
There really are 3 ways that you can tackle this:
1- You set up TP to the lowest FVG of the series (if there are multiple like in this case)
2- You set up TP to the first FVG still open during the quarter following the Earnings Period
3- You tackle both TPs and take each FVG as a partial close to the position (example: if there are 2 FVGs you take out 50% of the position on the first and 50% on the last).
But what to do if your positions didn't reach TP (FVG close) before the next Earning or there is no FVG to begin with???
- In the case the TP you have marked out at the close of the FVG didn't reach, you'll proceed to close the position 1 day before the next Earnings is coming, unless your conviction that the FVG will fill in is so high, then you can let those run at your own risk:
- In the case in which a FVG is not present then you'll target the previous High (in case of a buy) or Low (in case of a sell) as your TP, utilize the previous low (in case of buy) or previous high (in case of sell) as SL and just let it run:
as you can see the 4 trades were all profitable, made little money but sure money in just 15 days
Unless I forget anything, this right here, is my strategy.
Simple, straight forward, high success rate and doesn't leave anything up to the case.
If you have any questions PLEASE leave a comment below and I'll do my best to reply in time ;)

$LIPO went to the max target or +50% fastPremarket trade on NASDAQ:LIPO went to the max target or +50% fast 🏎️💨
Turns out max target was well placed as it ended the day back down near $4 👌

Disney ShortableYes there is daily gap, not because of the gap I am trading but my own indicator...The price should drop to the green support in most 10 days.
Not an investment advise.

Costco Wholesale Stock Quote | Chart & Forecast SummaryKey Indicators On Trade Set Up In General
1. Push Set Up
2. Range Set up
3. Break & Retest Set Up
Notes On Session
# Costco Wholesale Stock Quote
- Double Formation
* 1st Trendline | Area Of Value At 935.00 USD
* 2nd Trendline | Uptrend Bias & Entry | Subdivision 1
- Triple Formation
* 012345 Wave Count | Completed Survey | Subdivision 2
* 1.618 Retracement Grading | Subdivision 3
* Daily Time Frame | Trend Settings Condition
Active Sessions On Relevant Range & Elemented Probabilities;
European Session(Upwards) - US-Session(Downwards) - Asian Session(Ranging)
Conclusion | Trade Plan Execution & Risk Management On Demand;
Overall Consensus | Buy

Possible more price drop on AMD in short termI don't know anything about AMD's financials...I am not interested...I am only trading...
It is very risky trade..
Not investment or trading advice.

Satellogic (SATL): Earth Imaging Demand Continues to GrowSatellogic Inc. (SATL) is a leader in Earth imaging, using a fleet of high-resolution satellites to provide real-time data for governments, businesses, and researchers. Their technology delivers detailed images that help with agriculture, environmental monitoring, and infrastructure planning. The company’s growth is fueled by increasing demand for geospatial intelligence and its ability to provide cost-effective satellite imagery.
SATL recently showed a confirmation bar with increasing volume and is finding demand at the Fibonacci 0.618 level inside the corrective zone (0.382-0.618), a key support area in uptrends. This signals strong buying interest, which could lead to further gains. A trailing stop can be set using Fibonacci levels with the Fibonacci snap tool, allowing traders to manage risk while staying in the trend. Short term targets at $3.75 and $4.41.

AMAZON - Down to 200$ (or more?)After Quarter Earnings (don`t know how they went) stock dropped -5% yet we`ll see if it`s going to be more or not overnight, but for the stock it`s a healthy retracement at this moment and can go deeper down since it was on an ATH before. I don`t like stocks like Amazon they are gaining all the time with typical retracements, which is good to hold long term, but retracements are only predictable in a short time, and the stock is only slowly gaining and you have lots of opportunity costs.

$DJT to 50+ by EOWI called this out to all my close friends and family. I made the call at my entry point and that entry point is $30.00. I noticed that every time sir Donald has a major event the stock price has a reaction. Whether he is good for America or not this stock does not care. The actual company is a complete joke but that's what makes this fun. Making money where money has no business being. I am simply being optimistic because I know the MAGA supporters will not sell until the election and I can almost guarantee the stock will dump next week. I will be selling on the next jump up. It is quite clear to me we will see some nice uptrend action heading into the inauguration. Anyways cheers I will update when I feel it is needed.

I think this is going upThere is no supply anywhere in that market. The last UT was a probe to go up. Easy to say that in retrospec I guess. Anyway, instead of being met with supply, buyers came in so that mKes it a probe. There was a good bar to buy 3 bars after the one marked as SOT. Over the las weeks we saw absorption. This week looks like stopping action or perhaps a UT (to be confirmed) on the weekly. But if we look at it on the daily, yesterday was an UT that was met with lots of buying today. I think yesterday was another probe to go up and today was a spring / bag holding.
I placed an order to buy a small position tomorow at the opening.

$SHOP short idea (once again) - In advance of Earnings
Hi everyone,
I'm once again back to short NYSE:SHOP ..
It is not because I don't believe in the company, because I really do, but just like the first time,
I am targeting massive FVGs made by huge gaps in the chart as TPs, and utilizing an improved version of the first pattern of Earnings.
Just to summarise it so that everyone can understand it without having to go back to the first published idea, I've noticed how the Shopify stock tends to follow a certain pattern of buys and sells regardless of the results of Earnings.. now, I don't know if this is caused by buy backs or internal company stock operations or some other cause, but I've simply seen how it tends to alternate between buy and sell, and when, for example, for 2 earnings in a row a buy happens (the stocks trends up) then it is followed by an equal amount of sells (so 2 down trends).
Now.... could this just be odds and for the last 4 years this was just randomized and ended up doing exactly this? Idk maybe, but I'm not a genius in a lamp, so I'm speculating.
All I know is that:
- there are 2 massive gaps in the chart, worse than the last time,
- price is currently struggling to head higher (perhaps just waiting for Earnings to choose direction),
- we have just terminated one of those double down events where 2 selling earnings happened and right after 2 buy earnings happened,
Now... there are 2 ways to approach this, and these are the following:
1- The first method is to try and "predict" the top of the market by selling 3 days before of earnings just like the first time and hope for the down trend call to be true;
(something like this )
2- Actually wait till earnings day comes and wait for the 1d candle of the earnings day itself to close and tell if it was either a bullish or a bearish one and from the next day, start either buying or selling depending on the trend.
(something like this )
If you choose the latter, then you don't really have to worry about "predicting" the market and all you got to do is develop a entry strategy, you could either buy the dip/sell the top (depending on the trend of the earnings' candle) so that you can get the lowest entries, or you could just enter on each candle that moves the direction of the trend you are following (so for example if the trend is bullish, enter only on bullish candles close to follow your bias).
I'll post a follow up of the last entry option as I have developed a entry strategy to do just that, with the help of my friend @D499 who condensed it into an indicator (as I can't code).
I'll post comments to this post so that I can keep up with how things proceed and perhaps if the second scenario takes place I'll Live follow up so that all of you can see the idea.
Reminder, it's just an idea ;)

ITC Analysis for result.Analyzed ITC with different technique and trend. It is looking weak and result is there today. So lavels are share with stop loss and target.

Stock Of The Day / 02.04.25 / EL02.04.2025 / NYSE:EL #EL
Fundamentals. Earnings report. Estee Lauder beats earnings expectations, but negative forecasts send shares lower.
Technical analysis.
Daily chart: Downtrend. Level 69.78 formed by the gap in November 2024 is ahead.
Premarket: Gap Down on increased volume.
Trading session: A pullback after the initial downward movement was stopped at the level of 74.00. We observe a narrow range and a clear holding of the price below the level. We are considering a short trade to continue the downward movement in case of holding the level of 74.00.
Trading scenario: #Pullback along the trend (#rebound) from the level 74.00
Entry: 73.13 when exit down from the trading range below the level.
Stop: 74.12 we hide it behind the level with a small reserve.
Exit: Close part of the position before the daily level of 69.78. Close the remaining part of the position at a price of 68.50 when the structure of the downtrend is broken.
Risk Rewards: 1/4
P.S. In order to understand the idea behind the Stock Of The Day analysis, read the following information .

From Boom to Bust? Nvidia Warns of a Potential 50% DropAfter an incredible rally, Nvidia NASDAQ:NVDA has finally hit a wall at its all−time high of $140, failing to secure a strong monthly close above this critical resistance level. This stagnation at the peak is a red flag for the stock’s near-term momentum.
Since the rally began in 2016, the monthly chart has been overwhelmingly bullish, with only a few exceptions: 2018, 2022, and now 2024, where the monthly chart has printed a bearish engulfing candle. Historically, when this pattern has appeared, it has led to steep retraces. Based on the median pullback from the past two occurrences, we could see a 50% decline by mid 2025 from current levels, a potential bloodbath for unprepared investors.
Is this a guaranteed outcome? Of course not. But higher timeframes carry significant weight in macro price action, and this bearish signal is too significant to ignore. Stay alert—volatility ahead!
While a short-term pump toward the $140s is more than likely, it’s important to recognize that this move will feel more like a dead cat bounce than a sustainable recovery. For those considering a short position, this potential bounce could offer the perfect entry point.
However, unless NVDA can achieve a strong break above $150 and successfully flip this level into support, there’s no compelling reason to turn bullish here. The macro warning signs remain intact, and the risk of a deeper retrace increases.

NVDA 8H Chart Correction
This is the count I'm working with for NVDA.
The break of gray support (now resistance), gave us Black A, and Black B is happening as a flat correction (Blue ABC).
If confirmed, this pattern could take us to retest sub-100 levels at green support for Black C.

Mah&Mah analysisI have analyzed M&M using different Gann technique and time frame. And today is the result. Stop loss will be yesterday high.

ONON/NKE BETA HEDGELove the growth on ONON , don't like the price action on daily , today was a good example .
I decided that instead of trading this as a one sided long , I can potentially fix that problem by shorting nike at the same time as its currently weak and looking in trouble to me ....
This way instead of being as dependant on price action I can instead just focus on spread and make a bet that ONON will do better than NIKE .
The plan will be to add another position if we touch my stop on this shown and try to get out break even or hold . The exit point will be an extra deviation in that case .... As this is a spread trade I am not able to set stops but that is the point and I will follow my rules ....
I had to undersize to plan for my scale in risk management compared to my prior ONON trade ( which I lost ) ....
So, the ideal goal will be to hold this as long as possible and when I see a change in the trend structure to bearish , sell ....but hopefully by then this has made me a good return ...
I want to see ONON stay above its green line breakout though and for the spread to not be losing more than one typical stop loss value at -2R, after my scale in at 1R. After I scale in at 1R , I am only in the trade to get out at BE too ... Then I will re-assess another entry based on theme and spread of ONON/NKE....

At long-term support.After earnings on Feb. 6th, the stock has plummeted to the long-term support. This trendline needs to hold because the next support is at the yellow S/R pivot (long way down).

Monster Weekly Breakout?ASTS is forming a bullish pennant on the weekly chart, characterized by a pullback on declining volume after a strong impulse move. The stock recently made a high near $25 and is consolidating in a tightening range, indicating a potential continuation pattern. The declining volume during this pullback suggests sellers are weakening, while buyers are likely waiting for a breakout confirmation.
Trade Plan:
• Entry Trigger: A weekly close above $25 will confirm the breakout from the pennant and signal bullish continuation.
• Price Target: First target at $30, aligning with the measured move projection from the initial leg of the rally.
• Stop Loss: Below $23, to protect against a failed breakout and trend reversal.

Vistry Group PLC Stock Quote | Chart & Forecast SummaryKey Indicators On Trade Set Up In General
1. Push Set Up
2. Range Set up
3. Break & Retest Set Up
Notes On Session
# Vistry Group PLC Stock Quote
- Double Formation
* A+ Set Up)) | Completed Survey & Entry
* 012345 Wave Count | Subdivision 1
- Triple Formation
* (Consolidation Argument)) | Middle Range Feature | Subdivision 2
* Numbered Retracement | Downtrend Set Up | Subdivision 3
* Daily Time Frame | Trend Settings Condition
Active Sessions On Relevant Range & Elemented Probabilities;
European Session(Upwards) - US-Session(Downwards) - Asian Session(Ranging)
Conclusion | Trade Plan Execution & Risk Management On Demand;
Overall Consensus | Neutral

TataMotors analysis using angles.Analyzed Tata motors using angles. I have used bigger time frame of 2 years. And calculated these angles.
