$HII for a 90%+ profit.RSI is in the buy zone. P/E and P/B are in a beautiful buy range too. Sell at the red line.

CRDF (NASDAQ) - 30-Min Chart Long Trade Setup! 🚀
🔍 Stock: CRDF (NASDAQ)
⏳ Timeframe: 30-Min Chart
📈 Setup Type: Bullish Breakout
📍 Trade Plan:
✅ Entry Zone: Above $4.70 - $4.75 (Breakout Confirmation)
🚀 Take Profit 1 (TP1): $4.83 (First Resistance)
🚀 Take Profit 2 (TP2): $5.01 (Extended Bullish Target)
🔻 Stop-Loss (SL): Below $4.53 (Key Support)
📊 Risk-Reward Ratio: Favorable for a bullish continuation 📈
🔹 Technical Analysis & Setup:
✅ Pattern: Symmetrical Triangle Breakout 📈
✅ Breakout Confirmation Needed: Price holding above $4.70 with volume support
✅ Resistance Zones:
$4.83: First Major Resistance
$5.01: Extended Target for strong momentum
✅ Momentum Shift Expected: A breakout could trigger a strong uptrend 🚀
🔥 Trade Strategy & Refinements:
📊 Volume Confirmation: Look for increasing buying volume above $4.70 📉
📉 Trailing Stop Strategy: Once price reaches TP1 ($4.83), adjust SL higher to secure profits 🛑
💰 Partial Profit Booking: Take partial profits at $4.83 and let the rest ride toward $5.01+ 💵
⚠️ Fake Breakout Risk: If price drops back below $4.70, reconsider entry ❌
🚀 Final Thoughts:
✅ Bullish Breakout Potential – High probability of continuation higher 📈
✅ Momentum Shift Possible – A move above $4.83 could accelerate the upside 🚀
✅ Strong Risk-Reward Setup – SL at $4.53, TP at $4.83 - $5.01 for optimal gains
📊 Trade Smart & Stick to the Plan! 🏆🔥
🔗 #LongTrade #StockTrading #CRDF #TechnicalAnalysis #DayTrading #MomentumTrading #BreakoutSetup #RiskReward #TradingPlan #ProfittoPath 🚀📈

2/6/25 - $pins - Considering long EPS...2/6/25 :: VROCKSTAR :: NYSE:PINS
Considering long EPS...
- so u get NASDAQ:META talking about ad revenue, NASDAQ:GOOGL strong on this frong, even NYSE:SNAP (which it's own basket of broBS) strong on this front too
- the google trends for pinterest esp on the worldwide basis are legit strong
- YES YES sbc is high in this FCF equation - but legit, this only compounds when the company is in trouble and/or growth stalls on the share price (usually both happen at the same times... but you know, mr mkt sometimes does funny things :)
- anyway, nearly 5% "fcf" (quotes bc of the sbc piece) and growing teens is, frankly, ownable.
- i think cathie woods likes this *long sigh*. didn't look but hopefully cramer isn't recommending it.
- all jokes aside, this could be a good punt on the long-side into print. i'm 60/40 about to pull the trigger.
anon push me off... or keep me from jumping
V


Nvidia - The Future Is Actually Known!Nvidia ( NASDAQ:NVDA ) is repeating price action:
Click chart above to see the detailed analysis👆🏻
Back in 2018 Nvidia has been retesting the upper channel resistance trendline again and again before we saw a trendline break and a massive drop. We are seeing the same behaviour today but so far, Nvidia still manages to consistently respect the trendline.
Levels to watch: $200, $120
Keep your long term vision,
Philip (BasicTrading)

Is #nvidia coming back on trackeOffcourse the deepseek news are not enough to floor #nvidia.
We all knew it has to go up finally.
Technically, It has to break the suppoer around 128-130 area and then we will have a clear bullish sentiment.
Still having bearish sentiment as long as it trades below this level.

2/6/25 - $amzn - Buying eps tn2/6/25 :: VROCKSTAR :: NASDAQ:AMZN
Buying eps tn
- will keep it short
- consumer stuff is flying from 4Q binge
- NASDAQ:META , even NYSE:SNAP good ad #s should support healthy NASDAQ:AMZN consumer biz
- NASDAQ:GOOGL , NASDAQ:MSFT cloud were flies... but honestly, NASDAQ:AMZN is the gorilla. could we see similar thing? I'd say 50/50 tbh. if anything seeing those others weaker tells me maybe 60/40 better/worse, so i'll punt
- i'm also short the Q's so IF there's a sell off, NASDAQ:AMZN miss could be a trigger. and if Q's r up tmr say another 50 to 100 bps, probability is that GETTEX:AMZ is helping drive this factor - so it's a hedge to my hedge
- feeling a bit more emboldened seeing NYSE:UBER rally back, took a bit of my LT adds from y'day off the table and now back to a comfy 20% portfolio size to weather whatever comes next, higher or lower - i love positioning to a point where i am indifferent to the move tmr.
- 40% cash, highest it's been in a while
- stuff simply looks... sus. but sus can be sus for some time. so i'll play some prints here and there. tonight i am long $amzn.
anon?
V


Possible breakoutGood day Team:
I hope all is well.
Here we have MBOT.
Notice how it is in a range and price may possibly have a breakout. MACD may have a bullish cross over. CCI levels and RSI levels are healthy. Please be careful and wait for confluences.

$SMCI strong technical position with a bullish trendAs of February 6, 2025, MSCI Inc. (MSCI) is trading at $581.47, experiencing a slight decrease of 0.11% from the previous close.
Technical Analysis:
Over the past year, MSCI's stock has demonstrated a bullish trend, with a 52-week range between $439.95 and $642.45. The stock is currently trading approximately 9.5% below its 52-week high, indicating potential room for upward movement. The Relative Strength Index (RSI) suggests that the stock is neither overbought nor oversold, maintaining a neutral stance. Moving averages, including the 50-day and 200-day, show a positive alignment, reinforcing the bullish outlook.
Fundamental Analysis:
MSCI has reported consistent revenue growth, with a 7.7% increase in operating revenue to $743.5 million in the recent quarter. However, operating expenses also rose by 5.9% to $338.3 million, primarily due to higher compensation and a 5.8% increase in employee headcount. This led to a 24.3% decline in fourth-quarter profit, totaling $305.5 million, or $3.90 per share, down from $403.4 million, or $5.07 per share, the previous year.
Despite the recent decline in profit, MSCI's expansion into ESG (Environmental, Social, and Governance) and climate-related products has been a significant growth driver. The ESG and Climate segment accounted for 11.2% of total revenue in the second quarter of 2024, up from 7.9% three years prior. This growth is attributed to increased demand from investors seeking to assess physical risks associated with climate change.
Potential Partnership with NVIDIA:
While there is no official announcement of a partnership between MSCI and NVIDIA, MSCI has expanded its collaboration with Google Cloud to accelerate the development of generative AI solutions for the investment industry. This partnership aims to leverage AI to help investors identify and manage risks and opportunities more effectively.
Given NVIDIA's leadership in AI technology, a potential future partnership between MSCI and NVIDIA could further enhance MSCI's AI capabilities, leading to increased efficiency and potentially significant revenue growth.
Conclusion:
MSCI Inc. exhibits a strong technical position with a bullish trend supported by favorable moving averages. Fundamentally, the company is expanding its offerings in high-demand areas such as ESG and AI-driven investment tools. The potential for a partnership with a leading AI company like NVIDIA could further bolster MSCI's growth prospects, making it an attractive consideration for investors.

VRAR bounce off trendline?The VRAR surge in recent months has retraced back to it's historical trendline. I would expect the stock to bounce back to at least the first resistance level between $2.90-$3.30. and possibly test new highs thereafter.
Not being greedy I would take 50-75% profits at $3 and ride it from there.

$GGG for a 15%+ profit. RSI is in the buy zone. P/E and P/B are in a beautiful buy range too. Sell at the red line.

TESLA PRICE ACTION 6TH FEB 2025This is the price action of TESLA at its very best & exclusively for viewers on trading view.
I have discussed in depth price action of TESLA and if you have any doubts feel free to leave a message or your comments below.

SHORT SBUXELLIOT WAVE FALSE BREAKOUT - SHORT OUT WALLSTREET
False pump on hype, no financial backing plus technical retracement in bound. Get in short leverage.

Bharti Airtel Trade Setup | High-Risk, High-Reward OpportunityHere's an exciting analysis of Bharti Airtel Ltd based on the chart! 📊🚀
🔥 Trade Setup & Key Levels
📥 Entry Zone: 1657 - 1674 (Smart buy zone)
🛑 Stop-Loss (SL): 1592 (Risk protection)
🎯 Target Profits (TP):
TP1: 1737 (First milestone 🥇)
TP2: 1778 (Stronger bullish push 📈)
TP3: 1858 (Big breakout potential 💥)
📌 Observations & Strategy
Current Price: 1619.75 (-2.45%) 📉 → Price is below the entry zone, meaning a potential bounce or more downside.
RSI & Indicators: Oversold conditions ⚠️ → Possible buyer interest soon!
Risk-Reward Ratio: A great setup with a high reward vs. risk trade! 🔥
🚀 What’s Exciting?
If support at 1592 holds, we could see a bullish explosion 🚀🔥
A break above 1657 might trigger a rally toward 1737+ levels 📈💰
If 1592 breaks down, a deeper fall might be in play ⚠️📉
This setup is high-risk, high-reward—perfect for traders looking for a strong breakout move! 💎 What do you think? 🤔
⚠ Disclaimer: I am not SEBI registered. Stocks and securities are subject to market risk 📉📈. Please read all levels carefully before making any trading decisions.
📊 Follow for more insights & trade setups! 🚀

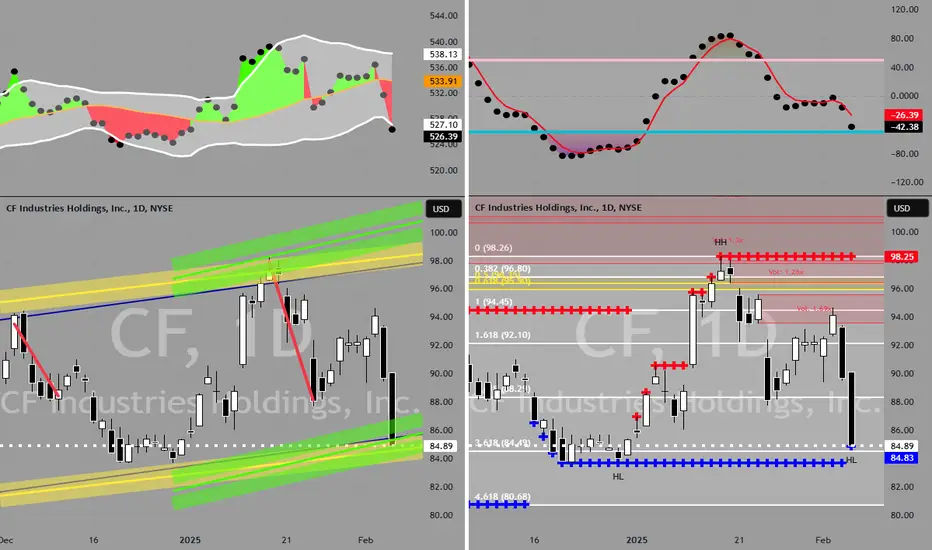
CF to $88My trading plan is very simple.
I buy or sell when:
* Price tags the top or bottom of parallel channels
* Money flow spikes above it's Bollinger Bands
* Price at Fibonacci levels
So...
Here's why I'm picking this symbol to do the thing.
Price in channel zones at bottom of channels (period 100 52 & 26)
Stochastic Momentum Index (SMI) near oversold level
VBSM is spiked negative and under bottom of Bollinger Band
Price at or near 3.618 Fibonacci level
Entry at $84.91
Target is $88 or channel top
UCO BANKUCO Bank, established in 1943, is a public sector bank in India with its headquarters in Kolkata. It offers a wide range of financial services, including savings accounts, loans, and insurance products. UCO Bank focuses on promoting digital banking and financial inclusion through its online and mobile banking platforms. As a government-owned bank, it plays a vital role in supporting economic growth and development in India. The bank has an extensive network of branches and ATMs, serving customers across the country.

Creative Eye LtdCreative Eye Ltd
Company started its journey making Television content for Doordarshan. It has produced many well-known and award winning serials featuring many popular stars. Company's forte lies in making mega mythological serials.
Apart from content creation, company is exploring new avenues in other media allied business too which can contribute in future growth of the company.
Company is developing numerous ideas and concepts of various genre. The same have been pitched to various platforms, channels which are under consideration with them for their approval.

PSB BANKPSB (Punjab and Sind Bank) is a public sector bank in India, founded in 1908 and headquartered in New Delhi. It offers a variety of banking products such as savings accounts, loans, and fixed deposits. PSB focuses on serving both individual customers and businesses with financial services like digital banking, remittances, and government schemes. As a government-owned entity, it is committed to financial inclusion and accessibility across India. PSB operates through a network of branches, aiming to provide affordable banking to all segments of society.

Is NNDM Consolidation Finally Over?Weekly chart is being shown but I will summarize key bullish points on the daily as well.
General Note:
Found support at the 236 retracement($2.19) of the last low to high. This means alot of paper hands have exited.
If this did not hold it would be bearish.
Price is above a downward Trend line. We need to see this trendline broken on the daily chart and established as support.
Even better if we can weekly candles to do this in the next few weeks.
The orange areas are supply/demand zones at time frames lower than the daily but greater than and equal to an hour.
The red and green areas are supply/demand zones at the daily or higher. You need to see the orange zones
broken on the daily and established as support. The first red zone is the first boss. We need to get
through that and make it support to ensure this trend is changing.
It probably needs to happen soon because I expect to encounter resistance at the 200SMA on the weekly time frame
and I would like that resistance to be above that supply zone.
Weekly Notes:
The 8EMA crossed the 21 EMA on the weekly. It came down and touched the 21 and bounced.
This has not happened in the last four years I have been following this stock.
The 13 weekly EMA is equal to the 48 and if price stays above 2.40, it will cross it on the weekly.
The 30 Weekly SMA has leveled and is starting to point up. See Weinstein method.
Next thing I am looking for is the 30Weekly to cross the 50 Weekly and for the weekly 50 to level out and point up
Daily Notes:
13EMA has crossed the 48 EMA. This is generally bullish when both are not pointing down.
50SMA has crossed the 200 SMA
Broke above 200SMA Daily. Need to see a pull back and prove it's support.

SBIN Chart Frame State Bank of India (SBI) is the largest commercial bank in India, offering a wide range of financial services. Established in 1955, it has a vast network of branches and ATMs across the country. SBI provides services like retail banking, corporate banking, and investment banking, catering to both individuals and businesses. It is a government-owned bank, with its headquarters in Mumbai, Maharashtra. SBI plays a key role in the Indian economy, offering various loan products, savings accounts, and digital banking services.


Long $F (Ford) on the DailyI went long some Ford on the daily chart. No plan. No stops. No thesis. This is purely based on the down trend break.
