$LLY Eli Lilly & Company Pre Earnings TA NYSE:LLY Eli Lilly & Company.
-Earnings Approaching
-Closed Above Mid-Channel
-$800 ➡️ $803.54 Key Support
-Upside Trigger $827.68➡️$830.00

$AMZN long to $260 measured move targetThis is a daily of AMZN. It shows an initial move into the bull flag, a breakout-pullback, and an expected measured move to a TP of $160/share. Time period 3-6 months. Best of luck and good trading.-Mr Joseph

After 3 years consolidation SRF On on a ride After 3 years Long consolidation now a Clear cut monthly Break out in Srf ltd with high volume. Also a monthly volumes breakout happan is same time 200 candal volume avarage break 1st time after 2022, and Now I seeing a strong volumes relation in all 2020 to 2022 winner.

TEAM: From swing trade on the daily to a weekly breakout tradeThe only thing I forgot to discuss in the video was the fact that quality-wise we are "okay". The company is arguably overvalued, but it has been since inception :)
Revenues are constantly coming up, but they are still not profitable.
Please comment if you find value.

AAPL 1.22.2025 IdeaMy assessment is a fair price on the stock of $230 per share. AAPL now sitting at $222.5, I believe there is a high probability for a 5% up move within a few months.
Entry would be favorable if AAPL =< $220. I would enter direct shares here.
AAPL is of those companies that will be affected by tariffs. However, AAPL has benefitted from expanding its services economy. In other words, AAPL is not reliant on iPhone sales to drive their FCF. This opportunity is one for those looking for a discount on a MAG 7. Just be patient! But be flexible and anticipate further disruptions.

WTHVF Westhaven Gold Corp Holding at buy zone.On large time frames, Westhaven Gold Corp is doing what you would expect to see based on price action.
Starting to look good for a bounce here based on those two monthly bottom wicks and this zone being key. Adding to my position here after this close.


ProPetro Holding Corp. Stock Quote | Chart & Forecast SummaryKey Indicators On Trade Set Up In General
1. Push Set Up
2. Range Set up
3. Break & Retest Set Up
Notes On Session
# Propetro Holding Corp. Stock Quote
- Double Formation
* 10.00 USD | Area Of Value
* (Continuation Argument)) | Subdivision 1
- Triple Formation
* 1st Retracement | Uptrend Bias & Entry | Subdivision 2
* 2nd Retracement | Numbered On Short Entry | Subdivision 3
* Daily Time Frame | Trend Settings Condition
Active Sessions On Relevant Range & Elemented Probabilities;
European Session(Upwards) - US-Session(Downwards) - Asian Session(Ranging)
Conclusion | Trade Plan Execution & Risk Management On Demand;
Overall Consensus | Sell

METAMETA closed the week on weekly rejection to supply roof ,the impulse will push the stocks lower zone seeking demand ,i will be watching the 666.89 demand floor on confluence and on timing will buy into meta stocks.

Grab Stage 2 BreakoutNASDAQ:GRAB is setting up for a potential breakout! Here’s why:
-Built a solid 2.5-year base, broke out, retested & held as support, then rallied explosively on high volume (strong accumulation!).
-Pullback to 0.5 Fib & 21-week EMA support, followed by a breakout of the retracement trendline. Now retesting for confirmation.
📊 Technicals:
-Daily RSI: 42 (low & primed for upside)
-Daily MACD: Positive crossover
-Squeeze indicator: Near positive squeeze
-Declining volume on pullback = bullish signal
💼 Fundamentals:
-Free cash flow > debt
-Consistent revenue growth since Q1 ‘22
-Earnings on Feb 21 = potential catalyst
NASDAQ:GRAB looks ready for the next leg up! 🚀
#Stocks #TechnicalAnalysis #GrabHoldings

RGTI BullishMLMI: This indicator is trending upwards, suggesting increasing momentum. If it continues to rise, it reinforces bullish strength.
RSI: Currently around 53-54, which is neutral but leaning bullish. If it moves above 60, it would confirm stronger momentum.
-----------------------------------------------
Rigetti Computing (RGTI) is a leading quantum computing company focused on developing superconducting quantum processors and hybrid quantum-classical computing solutions. Founded in 2013, Rigetti aims to commercialize quantum computing for applications in AI, optimization, and scientific research. The company competes with major players like IBM and Google in the race for quantum supremacy.

$CE Ready for Major Bullish Move as It Approaches Key SupportThe price is currently sitting at a strong support level which also coincides with the bottom of a historical bullish trendline . These confluences suggest a high probability of a reversal to the upside .
Additionally, volume has increased , signaling growing interest and potential momentum buildup in the stock. Notably, a doji candle formed on the January monthly chart , which typically indicates market indecision and potential reversal points.
The ATH (All-Time High) isn't far from the current chart structure, making this setup particularly attractive in terms of risk-reward. Based on a technical analysis, we are looking at a 1:27 risk-reward ratio to the ATH , making this trade highly favorable.
Given the combination of support, bullish trendline, volume increase, and the doji candle, I’m bullish on NYSE:CE in the medium to long term .

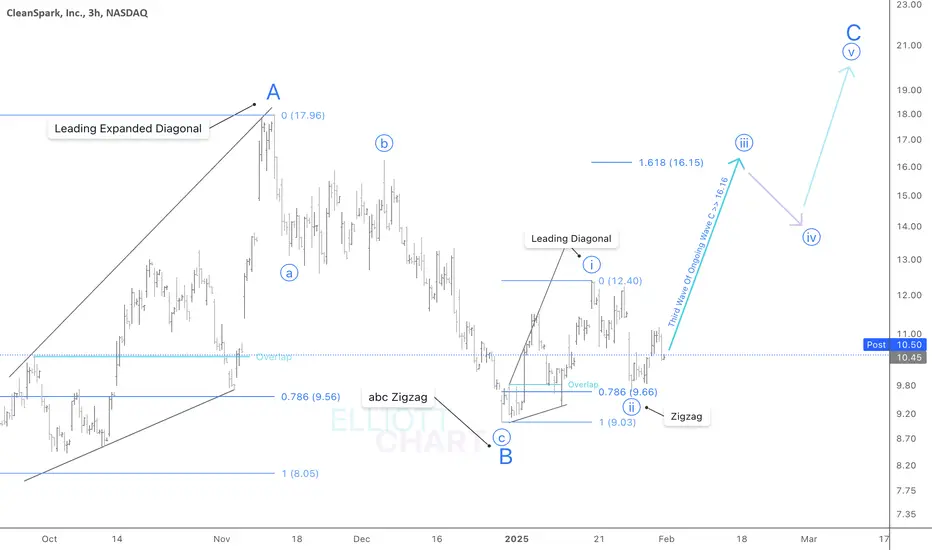
$CLSK / 3hNASDAQ:CLSK
A Minute degree third wave of ongoing wave C could have started to rising up,
and likely towards 16.16.
#CryptoStocks #CLSK #BTCMining #BTC
CycnCyclerion Therapeutics, Inc. (NASDAQ: CYCN)
1. Price Action & Trend Analysis
Current Price: $3.92 (+54.33% on the day)
Post-Market Price: $3.65
52-Week High: Around $9.00
52-Week Low: $1.27
Recent Breakout: The stock has experienced a significant breakout with a sharp price increase.
Resistance Levels: Around $4.00-$4.50 (historical supply zone)
Support Levels: Around $3.00 (previous consolidation area)
2. Indicators Breakdown
MACD Histogram: Showing increasing positive momentum, indicating bullish strength.
Volume Indicators:
Spiking volume, which confirms the breakout.
Purple volume-related indicators suggest strong relative volume compared to historical averages.
Volatility Increase: The price surge suggests heightened market interest, likely due to news or an earnings catalyst.
3. Market Sentiment
Buying Pressure: Strong upside movement, possibly fueled by retail traders and algorithmic buying.
Potential Short Squeeze: If short interest was high, today’s move could be a short-covering rally.
4. Trading Strategy Considerations
Bullish Case:
If momentum sustains, the next target is around $4.50-$5.00.
watch for pullbacks to $3.50-$3.70 for re-entry opportunities.
Bearish Case:
If it fails to hold above $3.50, it may retrace to $3.00.
A high wick on today’s candle could signal profit-taking.
5. Key Takeaways
Watch for Continuation: If volume remains high, the rally could extend.
Monitor Resistance: Break above $4.50 could trigger another leg up.
Stay Cautious: If momentum fades, expect a pullback to $3.00.
MADNESS100
Stay Fokus !

Jan 31: To drop on earningsNASDAQ:MSTR on daily shows price below moving averages which are expanding downwards.
4 Hour chart shows the pivot needs to be erased with more drop.
The upcoming earnings on Wednesday is likely the trigger to drop.

TSCO supplies LARGE gains for me - LONG at 54.29TSCO may not be an obvious choice for the kind of short term trading I do, but that doesn’t stop it from being literally one of the 5 best stocks (historically) for my trading system. In backtests and live trades, it has a record of 892-1. The average gain on those trades was +2.6% in an average of 11 trading days for an average daily return of almost 6x that of the S&P. Both of those are very good numbers compared to the universe of over 2000 stocks I screen. Additionally, it produces low drawdowns with my system (all time max of 7.7%) and its max allocation of capital was 10 lots, less than half of the average stock in my universe. Basically, it produces outsized daily returns, with much smaller than average capital usage and small drawdowns. That's EXACTLY what this system is aiming for.
It would not surprise me, though, if it had a couple more down days first. When stocks gap down on earnings, that's usually not a 1 day thing. But while the setup here is not ideal, I'll take that chance, considering its outlandishly good returns over time. Like in poker or blackjack, there's always a chance for a bad beat, but the odds are decidedly in my favor here.
It has also had some semi-unpleasantly long trades of late, but even if this trade produces half the normal return AND takes twice as long to pay off, it's still a far better return than the average return of the market. There is plenty of near term support from the regression channel bottom as well as recent lows at 55.10 and 51.93 too. Here's hoping TSCO pulls some profits my way and does so quickly.
Per my usual strategy, I'll add to my position at the close on any day it still rates as a “buy” and I will use FPC (first profitable close) to exit any lot on the day it closes at any profit.
As always - this is intended as "edutainment" and my perspective on what I am or would be doing, not a recommendation for you to buy or sell. Act accordingly and invest at your own risk. DYOR and only make investments that make good financial sense for you in your current situation.

$UBER to $77+ Post-Earnings The fundamental bull case for NYSE:UBER is strong as they approach earnings on February 5th, and personally, I'm betting (with call options) on a beat! 💪🏼💸🏆
If NYSE:UBER manages to impress as I believe they will, then I expect to see $77 in the week that follows. If they really provide some solid results, then I think that we could see a rally up to the lines of resistance on this long term ascending channel (green) by the end of the month.💥📈🎯
Time will tell! 😎⌚️

$CLSK / DailyNASDAQ:CLSK
On the possible ABC zigzag as wave (X), it looks its Minor degree wave C should be still in progress towards 20.16 where wave C = wave A.
Finally >> the ongoing wave (X) will be likely followed by a decline in Intermediate degree wave (Y).
#CryptoStocks #CLSK #BTCMining #BTC

ALT5 Sigma (ALTS): Crypto Growth Fuels Market MomentumALT5 Sigma Corporation (ALTS) is a financial technology company specializing in blockchain and cryptocurrency solutions. It provides secure digital asset trading, payment processing, and custody services, helping businesses and institutions integrate crypto into their operations. As digital assets become more mainstream, ALT5 benefits from increasing adoption and the growing need for secure crypto infrastructure.
On the stock chart, ALTS recently showed a confirmation bar with increasing volume, moving into the momentum zone. This signals strong buyer interest and potential for further gains. A trailing stop can be set at the Fibonacci 0.236 level using the Fibonacci snap tool, allowing traders to manage risk while staying in the trend.

AT&T Wave Analysis – 31 January 2025
- AT&T reversed from long-term resistance level 25.00
- Likely to fall to support level 23.00.
AT&T is under the bearish pressure after the price failed to break above the long-term resistance level 25.00 (which has been reversing the price from the start of 2020), standing above the upper weekly Bollinger Band.
The downward reversal from the resistance level 25.00 will likely form the weekly Shooting Star (strong sell signal for AT&T) – if the price closes this week near the current levels.
Given the strength of the resistance level 25.00, AT&T can be expected to fall to the next support level 23.00.

Philip Morris is Going to SMOKE Earnings on Feb. 6th ($140+)NYSE:PM - ZYN is clearly going nowhere but up, and that's the evil beauty of nicotine/ addiction. Once ya start, ya don't (typically) stop. Philip Morris announces earnings on February 6th, and I think they BLOW analyst expectations out of the water. 😮💨💸🏆
Technically, NYSE:PM is on the verge of breaking above this line of medium term resistance, and once/ if we do, I think we have a clear shot up to $140. Heck, maybe we even see it prior to their report!💥📈🎯
If NYSE:PM really impresses on the 6th, then I wouldn't be surprised if we rallied +12% from pre-reporting levels, in a similar scenario to what occurred following their last report back in November. 🔮🚀🌙
We've got a fun week ahead of us team! 😎🤙🏼

$WULF / DailyNASDAQ:WULF
The leading expanded diagonal as wave (A) should have started to correcting up as wave (B) that would be likely in a zigzag retracement of 61.8%.
Fib Target : 6.82
Fib Time Zone : early April
#CryptoStocks #WULF #BTCMining #BTC

