MSTR Ascending ChannelThis is an addition to my last idea. Publishing this to see how the price reacts to these levels over the next year. I see an ascending channel with very clear levels that run in parallel. Price seems to range in one level before moving to another level.

WIPRO- for investment WIPRO- for investment potential 2X stock in an year.
IT stocks will show some good moment in coming year, this could be one of them !!
Buy zone Buy Zone 390 to 440
Investment Targets :- 855, 976 ,1105 may be 1242
Please do your due diligence before trading or investment.
Disclaimer -
I am not a SEBI registered analyst or advisor. I does not represent or endorse the accuracy or reliability of any information, conversation, or content. Stock trading is inherently risky and the users agree to assume complete and full responsibility for the outcomes of all trading decisions that they make, including but not limited to loss of capital. None of these communications should be construed as an offer to buy or sell securities, nor advice to do so. The users understands and acknowledges that there is a very high risk involved in trading securities. By using this information, the user agrees that use of this information is entirely at their own risk.
Thank you.

LICHOUSINGFINANCE LICHSGFIN Will face resistance around 620 and it will start its downword journey towords 454, lets watch it

IEX is bearish nowIEX is now in downtrend and at around 190 it face resistance and then it will fall more than 116. so watch it observe it and learn understand it

RBRK Runaway gap followed by continuation patternNYSE:RBRK RBRK Runaway gap followed by continuation pattern
Strong momentum and bounce from 21 day EMA.
Adding to my discretionary portfolio.
NOT Financial advice. Do your own research.

META Buy SetupMETA Buy Setup
Our latest buy position on META targets 703.60, with a projected timeline until Feb 3, 2025. Price is holding near 686.72, and a boost from current levels could trigger a solid upward move.
Replay the entire trade on TradingView to see every entry and exit. Remember to apply proper risk management and monitor the chart closely.
#META #BuyEntry #TechnicalAnalysis #TradingStrategy

What Palantir’s Charts Say Heading Into Monday’s EarningsPalantir Technologies NASDAQ:PLTR had a heck of a year in 2024, running 340% to the upside and joining both the S&P 500 and Nasdaq 100. What does technical and fundamental analysis say about PLTR as the counterterrorism-software maker prepares to report earnings next Monday (Feb. 3) after the bell?
Let’s check it out:
Palantir’s Fundamental Analysis
Palantir has become one of the leading purveyors of big-data infused, AI-accelerated software that has made it a reliable partner for the U.S. government across many fronts. It also counts a growing number of commercial interests as customers as well.
The stock is up another 7.4% year to date as of Thursday’s close. That’s not exactly keeping up with some other cybersecurity stocks, but is beating both the S&P 500 and the Nasdaq Composite.
Will Palantir suffer if Chinese AI start-up DeepSeek has found a less-expensive way to put together a large-language model?
Well, PLTR has been volatile this week as DeepSeek’s emergence roiled Wall Street, but it hasn’t been as volatile as the stocks of companies that provide AI infrastructure.
As for Palantir’s upcoming fourth-quarter results, Wall Street is looking for $0.11 in adjusted earnings per share on about $777 million of revenue. That would reflect 37.5% year-over-year earnings growth and 28% y/y revenue gains.
For the full year, the Street is looking for Palantir to earn $0.48 in adjusted EPS on $3.5 billion of revenue. That would be good for 26% annual earnings growth on 25% of y/y revenue gains.
And since the quarter began, all 13 of the 13 top-ranked analysts that I can find that cover PLTR have revised their earnings estimates higher.
As for Palantir’s balance sheet, operating cash flow had been accelerating through Q3, while free cash flow has been positive.
The company has no debt on its books, giving it a very strong balance sheet -- especially for a firm of its size.
Palantir’s Technical Analysis
Now let’s check out PLTR’s six-month chart as of Wednesday afternoon (Jan. 29):
This chart shows Palantir’s upward trend since August, as represented by a Raff Regression model.
Readers will note how well the stock recently responded to a test of its 50-day Simple Moving Average (or “SMA,” denoted with a blue line above). The 50-day SMA has managed to run about even with the Raff Regression model’s lower trendline.
Meanwhile, Palantir’s Relative Strength Index (the gray line at the chart’s top) is currently looking better than neutral without being overbought.
Similarly, the stock’s daily Moving Average Convergence Divergence indicator (or “MACD, marked with black and gold lines and blue bars at the chart’s bottom) suddenly looks bullish across all three of its components.
For instance, the histogram of the 9-day Exponential Moving Average (or “EMA,” marked with blue bars), is above zero.
Palantir’s 12-day EMA (denoted with a black line) is also running above its 26-day EMA (the gold line), while both are running above zero. All of that is considered technically positive for a stock.
Next, let's zoom in on Palantir’s past three months and look at the current trend’s tail end:
This chart tells us that something might be going on with the stock ahead of earnings.
Readers will see that a “cup with handle” pattern (the purple field above) has developed over the past month or so while leaving the stock within its longer trend.
The cup’s right-side apex at $82 represents Palantir’s pivot point in the pattern above. Historically, the stock would need to take and hold this level to take on its next target price. (PLTR closed just below that Thursday at $81.22.)
A failure to take and hold $82 here would mean that PLTR would once again need support at its 50-day SMA ($71.90 in the chart above).
(Moomoo Technologies Inc. Markets Commentator Stephen “Sarge” Guilfoyle” was long PLTR at the time of writing this column.)
This article discusses technical analysis, other approaches, including fundamental analysis, may offer very different views. The examples provided are for illustrative purposes only and are not intended to be reflective of the results you can expect to achieve. Specific security charts used are for illustrative purposes only and are not a recommendation, offer to sell, or a solicitation of an offer to buy any security. Past investment performance does not indicate or guarantee future success. Returns will vary, and all investments carry risks, including loss of principal. This content is also not a research report and is not intended to serve as the basis for any investment decision. The information contained in this article does not purport to be a complete description of the securities, markets, or developments referred to in this material. Moomoo and its affiliates make no representation or warranty as to the article's adequacy, completeness, accuracy or timeliness for any particular purpose of the above content. Furthermore, there is no guarantee that any statements, estimates, price targets, opinions or forecasts provided herein will prove to be correct. Moomoo is a financial information and trading app offered by Moomoo Technologies Inc. In the U.S., investment products and services on Moomoo are offered by Moomoo Financial Inc., Member FINRA/SIPC.
TradingView is an independent third party not affiliated with Moomoo Financial Inc., Moomoo Technologies Inc., or its affiliates. Moomoo Financial Inc. and its affiliates do not endorse, represent or warrant the completeness and accuracy of the data and information available on the TradingView platform and are not responsible for any services provided by the third-party platform.

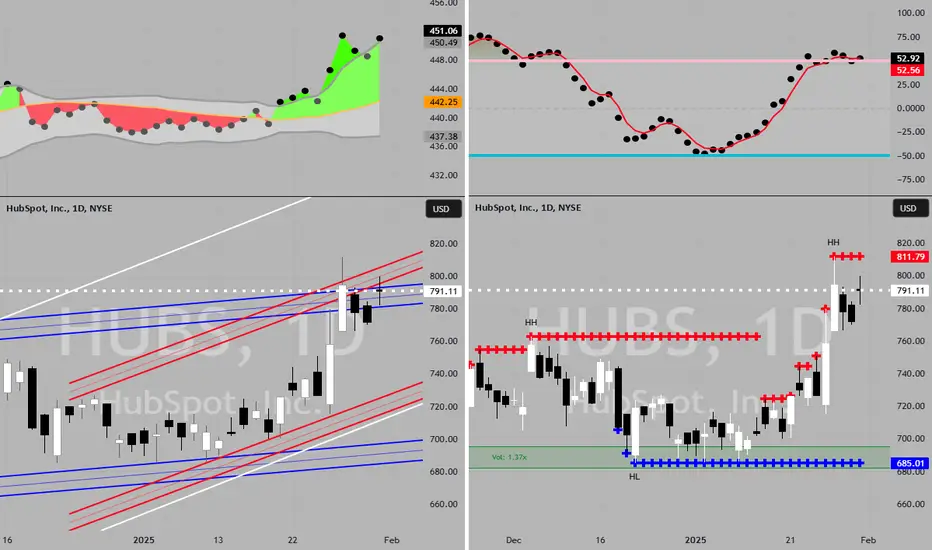
HUBS to $760My trading plan is very simple.
I buy or sell when price tags the top or bottom of parallel channels.
I confirm when price hits Fibonacci levels.
So...
Here's why I'm picking this symbol to do the thing.
Price at top of channels (period 100 52 & 26)
Stochastic Momentum Index (SMI) at overbought level
VBSM is spiked positive and over top of Bollinger Band
Entry at $792
Target is $760 or channel bottom
Opening (IRA): INTC Feb 21st 15/19/20/24 Skinny IC... for a 2.04 credit.
Comments: High IVR/IV (91.4/69.7) earnings announcement volatility contraction play. Going "skinny"/"almost iron fly" here. For purposes of take profit, treating it as an iron fly, where I generally look to take profit at 25% max.
Metrics:
Max Profit: 2.04
Buying Power Effect/Max Loss: 1.96
25% Max: .51
ROC at 25% Max: 25.0%

MANH to $244My trading plan is very simple.
I buy or sell when price tags the top or bottom of parallel channels.
I confirm when price hits Fibonacci levels.
So...
Here's why I'm picking this symbol to do the thing.
Price at bottom of channels (period 100 52 & 26)
Stochastic Momentum Index (SMI) at oversold level
VBSM is spiked negative and under Bollinger Band
Entry at $215
Target is $244 or channel top

Potential 15.23% ROI: HIMS Bullish OutlookA potential upward move of 8 bars, equating to an 15.23% ROI, is projected with an entry already breaking the upper trendline in the pre-market now at 27.23 eur. There’s a possibility of reaching the Fibonacci 1.618 level between January 7th and 15th. While nothing is guaranteed, the probabilities look favorable for Hims & Hers Health (Ticker: HIMS).

BIDU Poised For Another Bullish WaveBIDU Poised For Another Bullish Wave
From our previous analysis, BIDU tested 80 and later bounced aggressively near to 116.
However, the price moved back down to 80.
BIDU is profitable but also very risky, considering its price volatility as it moves up and down.
I think it's better to consider Call Options to manage the losses.
BIDU has the potential to rise again as it did before, with possible targets at 94.50, 103, and 112.
This is the same analysis as another one that I posted some time ago related to the data because BIDU is still perfectly respecting the same picture.
You may find more details in the chart!
Thank you and Good Luck!
❤️PS: Please support with a like or comment if you find this analysis useful for your trading day❤️

Microsoft Top?Microsoft showing some worrisome behavior.
Not something you see in a healthy uptrend.
Again, you won't find low risk entries here.
Stay safe!

Lockheed Martin Corporation - Aerospace & DefenseKey arguments in support of the idea.
• Concerns about the F-35 program are exaggerated.
• Trump has proposed deploying a U.S. version of Israel’s "Iron Dome".
• Selloff tends to the end.
Investment Thesis
Concerns about the F-35 program are exaggerated. Both Donald Trump and Elon Musk
have criticized the program in the context of modernizing the U.S. Air Force fleet. Musk
has described the fighter jet as expensive and potentially obsolete. However, the F-35
remains the most technologically advanced fighter jet in production today. NGAD (Next-
Generation Air Dominance) development is delayed, with no clear timeline or certainty
about the production of sixth-generation aircraft. This raises questions about substitute
programs. To our opinion options are limited. The F-22 Raptor, one of the stealthiest
jets, was initially slated for retirement by 2030. However, some officials now expect a
delayed retirement, with modernization efforts by Lockheed Martin (LMT) and RTX
continuing. Production of the F-22 is supposed not to resume. Meanwhile, F-15C/D
Eagle jets are being phased out, requiring replacements. With China advancing its fifthgeneration
J-20 fighters, the U.S. must maintain leadership in air dominance—a role that
other fighter jets cannot currently fulfill. This makes significant changes to the F-35
procurement schedule and volume unlikely. During Trump’s first presidency, similar
criticism of the F-35 did not reduce procurement, and deliveries increased instead. Even
if U.S. Department of Defense orders decrease, the F-35 has strong demand abroad,
especially as the U.S. pressures NATO member countries to allocate up to 5% of GDP to
defense. Should NGAD eventually enter mass production, Lockheed Martin is the most
likely lead, given that Boeing is focused on commercial sector challenges, and Northrop
Grumman has shifted its focus to its B-21 Raider bomber program.
Trump has proposed deploying a U.S. version of Israel’s "Iron Dome“ , a unified missile
defense system. Lockheed Martin has extensive experience in this field with its THAAD
(Terminal High Altitude Area Defense) system. THAAD is a highly effective, combatproven
system capable of intercepting short-, medium-, and long-range ballistic
missiles both inside and outside the atmosphere. In March 2022, THAAD demonstrated
successful integration with the PAC-3 MSE missile system. According to the 2025
defense budget, funding for missile defense programs is increasing. Additionally,
Lockheed Martin is advancing its IFPC-HEL (Indirect Fire Protection Capability-High
Energy Laser) program, featuring a 300 kW laser, which could enhance missile defense
capabilities significantly.
Lockheed identifies the Missiles and Fire Control segment as the most promising for
growth through 2027.
Market Perspective
The recent selloff in LMT stock was driven by renewed F-35 criticism from the current
administration. LMT has declined for three consecutive months. However, based on the
points above, LMT appears ready to resume a local bullish trend.
Compared to competitor RTX, which could compete for U.S. missile defense contracts,
LMT is attractively valued:
• Forward P/E (NTM): 17.5x vs. RTX at 19.7x.
• The broader S&P 1500 Aerospace & Defense index has a P/E of 25.9x, making LMT
undervalued.
LMT’s share price is near a wide support range of $460-$490, suggesting limited
downside. A bullish divergence in RSI supports this thesis.
We anticipate LMT’s stock could rise by approximately 13% in the coming months,
reaching $555. A stop-loss can be set at $448.

XPeng Could Be AcceleratingXPeng started rallying in August, and now it may be starting another push to the upside.
The first pattern on today’s chart is the series of lower highs in December. The Chinese EV maker broke that trendline in mid-January and has remained there since, which may suggest a consolidation phase has ended.
Second, the rebound started after prices held their November low. That may indicate new support has been established at higher levels.
Third, the 50-day simple moving average (SMA) and 100-day SMA crossed above the 200-day SMA in October. The current bullish sequence (faster SMAs above the slower ones) may be consistent with an uptrend.
Next, MACD is rising.
Finally, a XPEV has formed a tight ascending triangle near its high in November. Prices cleared the top of the pattern yesterday, a potential sign of bullish continuation.
TradeStation has, for decades, advanced the trading industry, providing access to stocks, options and futures. If you're born to trade, we could be for you. See our Overview for more.
Past performance, whether actual or indicated by historical tests of strategies, is no guarantee of future performance or success. There is a possibility that you may sustain a loss equal to or greater than your entire investment regardless of which asset class you trade (equities, options or futures); therefore, you should not invest or risk money that you cannot afford to lose. Online trading is not suitable for all investors. View the document titled Characteristics and Risks of Standardized Options at www.TradeStation.com . Before trading any asset class, customers must read the relevant risk disclosure statements on www.TradeStation.com . System access and trade placement and execution may be delayed or fail due to market volatility and volume, quote delays, system and software errors, Internet traffic, outages and other factors.
Securities and futures trading is offered to self-directed customers by TradeStation Securities, Inc., a broker-dealer registered with the Securities and Exchange Commission and a futures commission merchant licensed with the Commodity Futures Trading Commission). TradeStation Securities is a member of the Financial Industry Regulatory Authority, the National Futures Association, and a number of exchanges.
Options trading is not suitable for all investors. Your TradeStation Securities’ account application to trade options will be considered and approved or disapproved based on all relevant factors, including your trading experience. See www.TradeStation.com . Visit www.TradeStation.com for full details on the costs and fees associated with options.
Margin trading involves risks, and it is important that you fully understand those risks before trading on margin. The Margin Disclosure Statement outlines many of those risks, including that you can lose more funds than you deposit in your margin account; your brokerage firm can force the sale of securities in your account; your brokerage firm can sell your securities without contacting you; and you are not entitled to an extension of time on a margin call. Review the Margin Disclosure Statement at www.TradeStation.com .
TradeStation Securities, Inc. and TradeStation Technologies, Inc. are each wholly owned subsidiaries of TradeStation Group, Inc., both operating, and providing products and services, under the TradeStation brand and trademark. When applying for, or purchasing, accounts, subscriptions, products and services, it is important that you know which company you will be dealing with. Visit www.TradeStation.com for further important information explaining what this means.

WDC possible daily longWDC on the 15 Minute has started a bullish divergence on the RSI, MACD and lower lows on the chart. Crossing above the 50% line on the RSI indicates this upside can chop in this range while buyers load up or it can test 66.08 on the fib. If a candle is held above 1(66.08) then we should see a test to 1.618(67.52).

OMN.JSE Omnia - Potential Buy Zone. Double Bottom?Omnia is at a Potential Buy Zone & Double Bottom?
This is only for those Risk On Investors looking for a possible +20% Upside should the bottom hold and reverse.
Remains Speculative.
As always, please get a few outside Expert's Advice before taking Trade or Investment Decisions.
Should you appreciate my Chart Studies, Smash That Rocket Boost Button. It's Just a Click away.
Regards Graham.

Doximity Is Preparing To Report Another Strong QuarterKey arguments supporting the idea
• Doximity is a leader in the rapidly growing telemedicine industry.
• The results for Q3 FY2025 may once again impress investors due to the use
of AI tools.
• Maintaining high growth rates of financial indicators and a strong balance
sheet in the medium term.
Doximity is the owner of the largest medical social network in the U.S, bearing the
same name. Founded in 2010, the company has become something like "LinkedIn
for doctors," providing the medical community with tools for professional
communication, telemedicine, exchanging clinical information, and finding career
opportunities. The platform covers over 90% of U.S. doctors, offering access to
more than 100,000 current job openings for medical professionals.
Investment Thesis
Telemedicine is one of the fastest-growing industries , with an annual growth rate
of 24% expected from 2022 to 2032, according to Grand View Research. Unlike
other public companies in the telemedicine field, such as Teladoc (TDOC), GoodRx
(GDRX), and Amwell (AMWL), Doximity is the only profitable company. One of
Doximity's key advantages is its ability to generate revenue not only from
telemedicine services but also from targeted advertising and marketing solutions
aimed at medical professionals, which allows the company to effectively compete
in the market. According to the Doximity’s investor presentation, company
estimates the total market for telemedicine, pharmaceutical marketing, and
healthcare recruitment at $18.5 billion, highlighting significant opportunities for
growth and expansion.
The results for Q3 FY2025 may once again impress investors with revenue and
EPS growth driven by AI solutions. The number of major clients generating over
$500k annually increased from 92 to 103 as of Q2 FY2025, and these clients
account for approximately 83% of the company's total revenue. The company has
a good chance of repeating the dynamics of previous quarters due to AI solutions
that increase customer engagement and improve targeted advertising. The
company reported that over one million requests were made to Doximity GPT in
Q2 FY2025. The increase in user engagement, supported by tools like Newsfeed
and Client Portal, significantly improves user loyalty and increases the value of
advertising opportunities for pharmaceutical companies. Today over 600,000
doctors actively use Doximity tools for their daily tasks. For Q3 FY2025, the
company expects 13% YoY revenue growth and 15% YoY EPS growth.
Maintaining high growth rates of financial indicators and a strong balance
sheet. Over the past 5 years, the revenue CAGR has been 32%, and net income has
increased more than 14-fold. The company has a strong balance sheet with $800
million in cash and debt of $13 million, with a current ratio of 7.2. Additionally, by
the end of Q2 FY2025, the gross margin, adjusted EBITDA, and net margin reached
record levels, at 90%, 53%, and 32%, respectively. According to the FactSet
consensus, double-digit growth rates are expected to continue over the next three
years, with forecasted revenue growth of 13.6% and adjusted EPS growth of 21.3%
in FY2025.
We maintain a Buy rating on DOCS stock with a price target of $66. A stop-loss
order is recommended at $45.

bullish breakout consolidating with clear flag pattern above the channel, a successful breakout will lead to 216 than 253 end target

$SOFI - What's next target?NASDAQ:SOFI You might be wondering what my next target is. If this megaphone pattern plays out, I expect the stock to hit $23 next.
See supports, resistance and targets levels in the chart.
As always, I share my opinions and trades. I'm not suggesting anyone follow my trades. You do you.


Extremely bullish patternif Price manages to close above 2.33 on the weekly i think the next target should be 4$, then if broken 8$ and 10$ . tremendous upside potential

