Cup with Handle Patter in Catrade AND All Time High breakoutAs you can see: The day cartrade listed it started going down. it has formed a curved bottom and handle(The cup and handle pattern) Broke out retested and broke out AGAIN. PURFECT BUY

A Breakout Brewing or a Fading Flame? Boom or Bust Play!KURA is showing strong bullish momentum, recently forming a key gap at the $7.50 level, signaling growing interest from buyers. This gap-up suggests potential continuation to the upside, as the stock builds strength for its next move.
The key inflection point to watch is $9.49, a major weekly resistance level that could trigger a breakout. A confirmed push through this level would open the door for a run toward $19.11, where the next significant resistance lies.
Why KURA Could Push to $19.11:
🔹 Technical Strength: KURA has been making higher lows, indicating accumulation and trend continuation. Holding above $7.50 is crucial for the bullish case.
🔹 Breakout Watch at $9.49: This level has acted as resistance in the past, and a move above it would likely attract more buyers, leading to a momentum surge.
🔹 Gap Fill Magnetism: Stocks that establish gaps often tend to fill them completely, and if KURA can clear $9.49 with volume, it has a clear path toward $19.11.
🔹 Favorable Risk-to-Reward: With a stop-loss at $6.98, this trade offers a highly attractive risk-to-reward ratio, allowing traders to manage risk while maximizing upside potential.
Key Levels to Watch:
✅ Support: $7.50 (gap level), $6.98 (stop-loss)
✅ Breakout Trigger: $9.49 (weekly resistance)
✅ Target: $19.11 (major resistance)
If KURA sustains its momentum and breaks $9.49 with conviction, this setup could deliver explosive upside toward $19.11, making it a highly compelling trade idea.
Will KURA power through resistance and rally, or will it stall and fade? The answer lies in the breakout! 🚀🔥
NASDAQ:KURA

Sticking the Breakout or Slipping Away? Boom or Bust Play!GLUE is showing strong bullish momentum, recently forming a key gap around the $6.20 level, a critical zone where buyers have stepped in. This gap-up suggests strong accumulation and potential for continued upside.
The stock is now approaching the $10.86 weekly resistance, a key inflection point that could determine its next move. A breakout above this level could trigger a surge in momentum, bringing GLUE into a higher trading range, with $18.01 as the next major resistance target.
Why GLUE Could Push to $18.01:
🔹 Bullish Technical Setup: The stock is holding above key support at $6.20, maintaining higher lows—a strong signal that buyers are in control.
🔹 Breakout Potential: $10.86 is a major level that, once cleared, could unleash a wave of buying pressure. Historically, when stocks reclaim key resistance levels with volume, they tend to push toward the next price target rapidly.
🔹 Gap Fill & Momentum Play: Once a gap starts filling, it often acts as a magnet, pulling price toward the next significant resistance. If GLUE clears $10.86, there’s a clear path toward $18.01, making this an attractive setup.
🔹 Favorable Risk-to-Reward: With a stop-loss at $5.17, this setup presents a highly favorable risk-to-reward ratio, allowing traders to capitalize on the potential upside while keeping risk controlled.
Key Levels to Watch:
✅ Support: $6.20 (gap level), $5.17 (stop-loss)
✅ Breakout Trigger: $10.86 (weekly resistance)
✅ Target: $18.01 (major resistance)
If GLUE maintains its momentum and breaks through $10.86 with strong volume, this could be the start of a major push toward $18.01, delivering a high-upside trading opportunity.
Will GLUE stick to its bullish trajectory, or will it lose grip and slide back? Time will tell, but the setup is too good to ignore! 🚀🔥
NASDAQ:GLUE

$GOOGL Stocks Sink on Alphabet Earnings; Gold Hits AllTime High Stocks Sink on Alphabet Earnings; Gold Hits All-Time High 📉✨
1/9
Global stocks dipped after Alphabet ( NASDAQ:GOOGL ) missed earnings expectations, putting pressure on Wall Street futures. Investors are now questioning tech's growth outlook. 📉 Could this signal a broader tech revaluation?
2/9
Alphabet’s earnings disappointment impacted sentiment across markets, while some European stocks showed resilience. Novo Nordisk delivered positive earnings, highlighting sector-specific strength. 🏢📊
3/9
Currency Moves: The USD/JPY pair saw notable movement as the yen strengthened. Japan’s wage data came in higher than expected, fueling speculation of another rate hike. 💴 Could this be a turning point for the yen's momentum?
4/9
The dollar weakened against major currencies, driven by Japan’s wage growth data and broader market uncertainty. Currency traders, take note: further BOJ tightening may continue shifting capital flows. 📉
5/9
Gold Surge: The precious metal hit a record high today. A weaker dollar and heightened geopolitical risks are driving investors toward safe-haven assets like gold. 🚀 Will this trend hold if market volatility persists?
6/9
Political surprise: President Trump made unexpected remarks about potential U.S. involvement in Gaza for economic development. Despite the shock value, markets largely shrugged off the news. 🗞️ Investors kept their eyes on the numbers instead.
7/9
Market Insights:
Alphabet ( NASDAQ:GOOGL ): Missed earnings shook tech stocks.
USD/JPY: Yen gains signal a potential shift in forex markets.
Gold: Safe-haven demand pushes prices to new highs.
8/9
Investors may need to reassess their tech positions in light of Alphabet’s performance. Meanwhile, forex traders could find opportunities in USD/JPY movements, and gold investors are riding a bullish wave. 🧭
9/9
What's your market outlook after today's moves? Vote now! 🗳️
Tech will rebound soon 📈
Volatility will dominate 🔄
Gold remains king of 2025 ✨

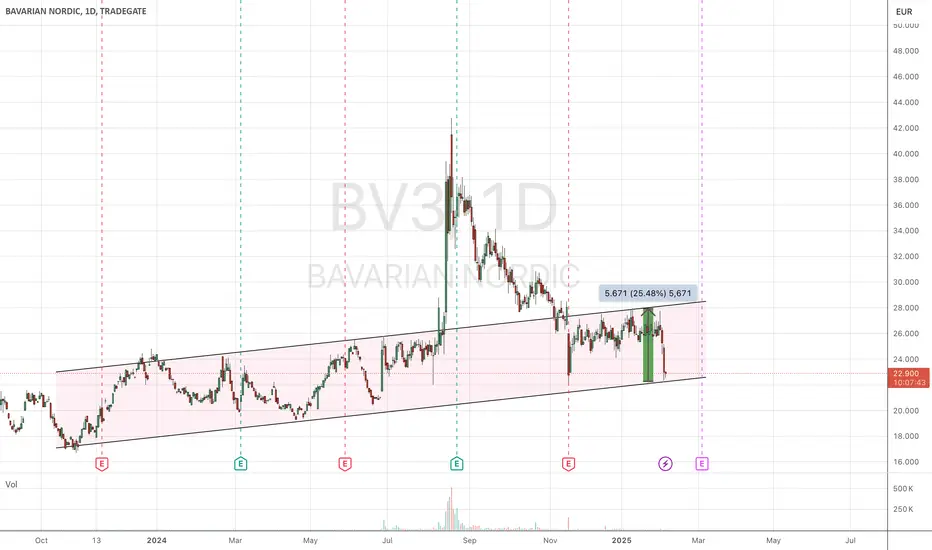
BAVA BV3: free lunch aheadstupid analyst expected more ... rather expect a 23 bounce back to 27-28. easy money in short time
BAJAJHFL Short term IdeaBAJAJHFL is at breakout level. It has tested the TL 2 times and now the swing broke.
People who are looking for low risk and High reward can look this.
This is not a call, please analyze and consult your financial advisor before investing.
Entry can be at Spot(115.29) or safe players can enter above 120, your Risk will be 110(Stoploss) and Targets T1 - 145, T2 - 180.
Estimated Holding time - 3 to 6 months, maximum - 1 year

Pfizer, Inc (Wave analysis) - DailyPfizer, Inc (Wave analysis) - Daily
As shown in the chart, we are in downtrend wave 5 from A or 1
Regards.

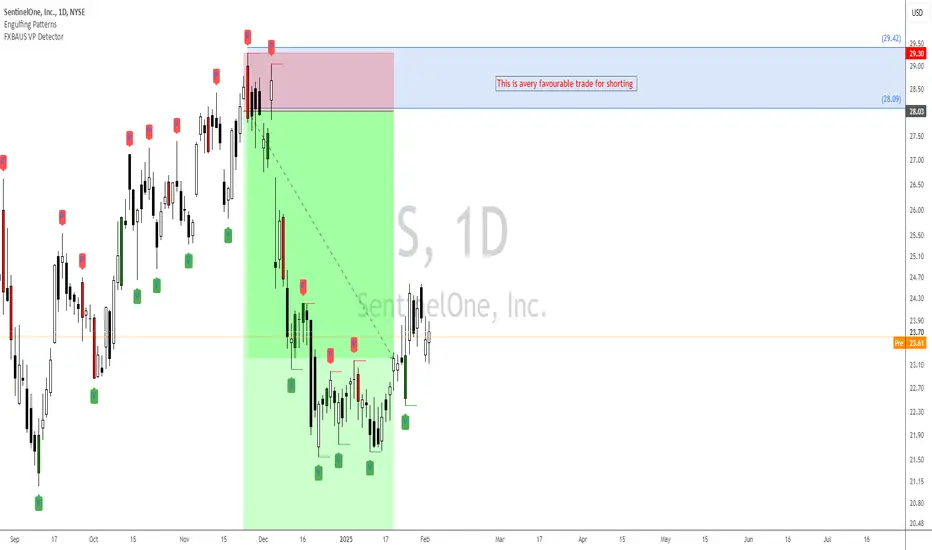
Shorting sentinelonecompany Info ; :
SentinelOne ensures the security of IoT devices through a combination of its Endpoint Protection Platform (EPP) and its Singularity platform. The EPP is designed to detect, prevent, and respond to advanced cyber threats.
Price action : shorting at the zone target is 1:7
QSI Potential IncreaseIt seems suitable for buying from this area. If it continues to remain in the uptrend, it is likely to reach $6-7 again at the next peak. In case it loses the trend, $1.88 and $1.20 act as support levels. This is not investment advice.

NVDA: Buy ideaOn NVDA, as you can see on the chart, we have a convergence between the resistance line and the support line. This configuration of the chart signals to us a high probability of seeing the market go higher if and only if the resistance line and the vwap are broken forcefully by the buyers.

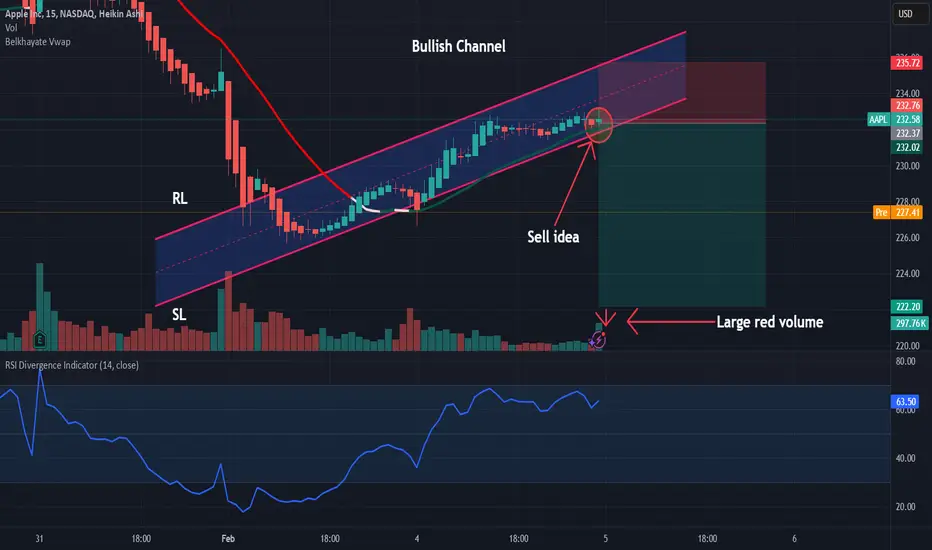
AAPL: Sell ideaOn AAPL, we are in a bullish channel situation. In such circumstances, we would have a high probability of seeing the market go down. This will be confirmed by the forceful break of the vwap and the support line.
Renergen losing it's energy - Support needs to hold or troubleRenergen has been on a one way trajectory down along with the solid downtrend.
We have the price below 20MA and 200MA
Now if the support does not hold, it could confirm an M Formaiton, which will send the price further down to R1.31
If the price has bottomed then there may be some type of hope for Renergen.

COP: A Strong Energy Play for 2025**COP: A Strong Energy Play for 2025** ⛽📈
ConocoPhillips (COP) is well-positioned for 2025, with a potential rise in oil prices boosting profitability. As one of the leading upstream oil producers, COP stands to benefit from a pro-energy policy environment and increased global demand. While tariffs create uncertainties for trade, the oil sector could see strong tailwinds in this macro setup.
#COP #Oil #Commodities #Investing #StockMarket

CLF: A Strong Play for 2025**CLF: A Strong Play for 2025** 🏗📈
Cleveland-Cliffs (CLF) is well-positioned for 2025, with rising commodity prices potentially fueling growth. As a key player in the U.S. steel industry, CLF stands to benefit from infrastructure demand and a pro-industrial policy environment. While tariffs pose challenges for global trade, domestic producers like CLF could gain a competitive edge.
#CLF #Steel #Commodities #Investing #StockMarket

BP: Positioned for a Strong 2025**BP: Positioned for a Strong 2025** ⛽📈
With the energy sector set to benefit from a pro-oil environment, BP stands as a solid opportunity for 2025. A potential rise in commodity prices, driven by favorable policies, could support higher margins and shareholder returns. While tariffs remain a risk for global trade, oil & gas companies could thrive in this macro setup.
#BP #Oil #Commodities #Investing #StockMarket

Transcap bottomed and could go up from here to R2.11RISKY ANALYSIS alert.
It looks like the bottom is in for Transcap. But the downtrend is strong and there is a prominent resistance line that definitely needs to break first.
Also it's a medium analysis because the Price>20 but<200MA
We have a small W Formation that has formed and price has broken above the neckline.
So I have a small target of Target R2.87.
The analysis will play as long as the support holds at R2.11.

AMZN: Sell ideaHello Traders!! As you can see this morning on AMZN on a 15 minute time frame according to the chart configuration, we have a high probability of seeing the market go lower in the event of a strong break of the support line.

ADBE: A Top Buy for 2025**ADBE: A Top Buy for 2025** 🚀📈
ADBE is setting up for a strong year ahead. Solid fundamentals, technicals aligning, and market conditions could drive a major move. This could be one of the best opportunities of 2025—watching key levels closely!
#ADBE #Investing #Trading #StockMarket

NVO: A Strong Buy Opportunity for 2025 **NVO: A Strong Buy Opportunity for 2025** 🚀📈
NVO is shaping up to be a compelling buy for this year. The setup is there, fundamentals remain strong, and the market conditions could favor a significant move. Keeping a close eye on key levels—this could be one of the best opportunities of 2025.
Chart incoming on TradingView! 📊 #NVO #Investing #Trading #StockMarket
Novo Nordisk shares rise on fourth-quarter profit beat, Wegovy sales jump

PepsiCo (PEP) Shares Drop 4.5% After Earnings ReportPepsiCo (PEP) Shares Drop 4.5% After Earnings Report
Yesterday, PepsiCo Inc. (PEP) released its investor report, which delivered mixed results.
Positive highlights:
→ Earnings per share ($1.96) exceeded expectations ($1.94).
→ Gatorade strengthened its market position.
→ Mountain Dew Baja Blast generated $1 billion in annual revenue.
→ International revenue grew by 2.1%.
→ The company announced a 5% dividend increase and expects growth in the protein drinks segment in 2025.
Negative factors:
→ Revenue ($27.78 billion) fell short of forecasts ($27.9 billion).
→ North American sales are declining, with Quaker Foods sales down 6%.
→ Foreign exchange fluctuations are weighing on overall revenue.
Investors reacted negatively, and by the end of the trading session, PepsiCo's stock price dropped by 4.5%.
Technical Analysis of PEP Stock
→ The price remains in a downward channel. While the S&P 500 has gained over 2% since the start of 2025, PEP stock has declined by more than 6%.
→ The $150 psychological level no longer acts as support (which was evident before the earnings release). The recent price rebound (marked with blue arrows) appears to be an interim recovery within the ongoing downtrend.
→ The stock is now trading near the median line of the channel, suggesting a potential stabilisation as supply and demand tend to balance at the median. However, bearish pressure may persist, potentially leading to a new yearly low.
Is PEP Stock a Buy?
Analysts remain cautiously optimistic. According to TipRanks:
→ Only 5 out of 11 analysts recommend buying PEP.
→ The 12-month average price target is $168.
Trade on TradingView with FXOpen. Consider opening an account and access over 700 markets with tight spreads from 0.0 pips and low commissions from $1.50 per lot.
This article represents the opinion of the Companies operating under the FXOpen brand only. It is not to be construed as an offer, solicitation, or recommendation with respect to products and services provided by the Companies operating under the FXOpen brand, nor is it to be considered financial advice.

Flag breakout - AIA EngineeringCompany with good fundamentals and flag breakout on the charts after consolidation on daily time frame.

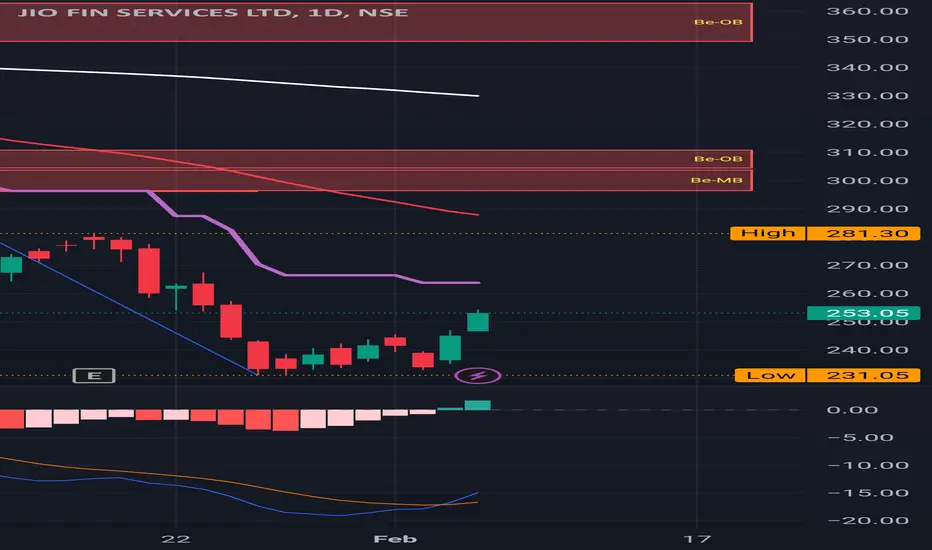
Jio : Recovering well from the support of 230.Jio : Recovering well from the support of 230.
Important levels to watch for are 280 / 310.
MACD positive crossover has already happened and moving towards 0 .
( Not a Buy / Sell Recommendation
Do your own due diligence ,Market is subject to risks, This is my own view and for learning only .)
IDFC FIRST Bank : Important milestone may come soon IDFC FIRST Bank: After a long wait , it appears that the time has come for IDFC First Bank to reach a significant milestone. IDFC First Bank may close above the Supertrend and enter a "Buy territory" if it continues the momentum.
MACD is strong and moving towards the 0 .
Another important milestone to consider would be a green candle closing above 200 SMA .
We also may want to pay attention to the different resistance levels shown on the chart once after the buy has triggered.
( Not a Buy / Sell Recommendation
Do your own due diligence ,Market is subject to risks, This is my own view and for learning only .)
