Zomato: A downside Wave 3 confirmation below 224 See my previous posts, in hourly time frame, if price enter 224-223 territory, then probably a downside wave 3 confirms. If this happens a sharp fall can be seen.

MicroStrategy’s Premium Is Fading – Time to Brace for a Drop?The strong optimism following Trump’s election in November fueled a Bitcoin rally, which in turn led to a massive surge in MicroStrategy’s ( NASDAQ:MSTR ) stock.
However, after reaching an all-time high near $550, MSTR experienced a sharp decline. Interestingly, despite Bitcoin hovering around $100K and even attempting a new ATH recently, this momentum hasn’t been reflected in MSTR’s stock price.
From a technical perspective, the price has broken below its ascending trendline and is now consolidating between $320 and $360.
Given the unjustified premium (at least in my opinion), I expect further downside for the stock.
Additionally, if Bitcoin fails to hold the key $90K confluence support, MSTR could see a sharp plunge below $200.

Is Tata Motors Ready for a Bullish Reversal?Timeframe: Daily
Tata Motors (NSE) has been in an expanded flat correction pattern for the past 11 months. In this pattern, the highest high (HH) was 1179, and the lowest low (LL) was 683.2. Currently, the price is trading below the 200, 100, and 50 EMA levels, indicating a bearish trend.
In this expanded flat correction:
Wave (A) completed at 855.4,
Wave (B) peaked at 1179,
Sub-wave 4 of Wave (C) touched 786.65,
Sub-wave 5 is now unfolding.
Once Wave 5 is completed, traders can look for buying opportunities with target levels at 799 – 951 – 1050+. First, it’s crucial to identify the end of Wave (C) to confirm the correction’s completion and a bullish reversal.
Projecting ending point of wave (C):
Wave (C) may end at 2.618% of Wave (A) around 628.7.
Wave 5 has multiple potential targets/support levels:
0.618 extension of Wave 1 at 526,
0.382 extension of Wave 1 at 628,
1.618 reverse Fibonacci of Wave 4 at 657,
2.618 reverse Fibonacci of Wave 4 at 562.
We will update further information soon.

$UBER UBER’S RIDE TO PROFITABILITY & BEYOND?UBER’S RIDE TO PROFITABILITY & BEYOND?
1/8 Uber ( NYSE:UBER ) just keeps on rolling! 🚀🚖
From 20% YoY growth in gross bookings to a SEED_TVCODER77_ETHBTCDATA:7B stock buyback, here’s what you need to know about this market heavyweight.
2/8 – RECENT REVENUE GROWTH
• Q1 FY24: Gross bookings hit $37.7B (+20% YoY)
• Revenue: $10.1B (+15% YoY), beating estimates by FWB:40M
• Uber’s firing on all cylinders—mobility & delivery both on the rise
3/8 – EARNINGS & PROFITABILITY
• Operating margin up from -3% to 2%—that’s a serious pivot to profit
• Adjusted EBITDA soared 82% to $1.4B
• First annual profit since going public in 2019. Party time! 🎉
4/8 – BUYBACKS & BULLISH GUIDANCE
• SEED_TVCODER77_ETHBTCDATA:7B stock buyback → market approves, stock at all-time highs 📈
• Gross bookings outlook: +15–20% for the next 3 years
• EBITDA growth pegged at ~40%—can they keep the momentum?
5/8 – VALUATION SNAPSHOT
• Forward P/E ~35x—a bit high, but consider the growth & dominance
• Market cap ~$140B vs. robust free cash flow projections
• Competition (Lyft, DoorDash) often has higher P/E or shakier growth
6/8 Is Uber undervalued given its trajectory?
1️⃣ Yes—ride (and deliver) the wave!
2️⃣ No—too pricey at 35x forward P/E
3️⃣ Maybe—needs more proof (robotaxi success?)
Vote below! 🗳️👇
7/8 – SWOT/SCOT TAKE
Strengths: Global brand, diverse services, Waymo partnership 🤖
Challenges: Regulations, high op costs, fierce competition
Opportunities: New markets, AI, autonomous tech
Threats: Legal hurdles, changing consumer habits
8/8 – WHAT’S NEXT?
Uber’s aiming for an autonomous future—could that turbocharge margins? ⚡️🏁

ITCHOTEL CMP 178.ON Hourly timeframe this tock makivg VCP Pattern which will be possible for a swing uptrend move.Risk and Reward also good.Add to your wachlist and see how it perform in coming days Thankyou.

$PDYN to blast soon!!The chart of Palladyne AI Corp. NASDAQ:PDYN suggests a potential breakout move:
Technical Analysis:
Breakout from a Downtrend: The stock has broken out from a descending wedge/pennant, which is generally a bullish pattern.
Strong Weekly Close: Last week, PDYN closed +17%, confirming strength.
Above Key Moving Averages: It is trading above the 5-day, 10-day, and 20-day moving averages, which signals short-term momentum.
Volume Confirmation: The volume is increasing, indicating strong accumulation by buyers.
Measured Move Target: The projected upside move is +144.65%, which targets $21.91.
Fundamental Backing:
- Palantir Partnership: The company uses Palantir’s Foundry platform for AI-enhanced robotics.
- Recent AI/Defense Contracts: Secured a U.S. Air Force contract for AI-powered drones.
- Short Interest (11%): Possible short squeeze fuel if momentum continues.
Conclusion:
PDYN remains one of the strongest stocks in the market (+2,000% YoY).
The risk-reward setup looks favorable if the breakout holds.
Watching for a sustained move above $10.50 to confirm momentum toward $21.91.
Would you like to anything else on this? 🚀

Our opinion on the current state of RCLRCL is a large producer of food, sugar products, and chicken in South Africa, which is owned 80.4% by Remgro.
The company owns a number of very well-known South African brands such as 5 Star maize meal, Farmer Brown, and Yum Yum peanut butter. It competes with overseas imports of sugar, chicken, and other foods.
It was impacted by the listeriosis outbreak, which damaged the market for processed meats and caused costs estimated at about R158m. The company has been impacted by the weak economy, low consumer spending, and high unemployment.
The company, through the SA Poultry Association, is petitioning the International Trade Administration Commission (ITAC) for an 82% increase in the tariffs on imported chicken.
On 2nd December 2020, the company announced that Remgro had increased its stake by buying 100m shares at R8,05 each.
On 29th March 2023, the company announced that it had sold Vector Logistics for R1,25bn.
On 4th June 2024, the company announced that it would unbundle and separately list Rainbow Chicken. RCL shareholders got 1 Rainbow share for every RCL share that they held on 25th June 2024.
On 10th June 2024, the company published Rainbow's pre-listing statement, with the last day to trade being 25th June 2024.
In its results for the year to 30th June 2024, the company reported revenue up 6.8% and headline earnings per share (HEPS) from continuing operations up 31%.
The company said, "EBITDA from continuing operations increased by 36.8% to R2 300,5 million (2023: R1 681,6 million). This was mainly driven by a strong result in our Sugar business unit and the recovery of service levels in the Pet Food business within Groceries."
In a trading statement for the six months to 31st December 2024, the company estimated that HEPS would increase by between 31.2% and 38.6%.
The company said the increase was, "...largely due to, amongst other items, the current period EPS including the non-cash gain realised on accounting for the unbundling of Rainbow, and the comparative period EPS including the gain on disposal of Vector Logistics."
The share has been drifting down since Rainbow was unbundled but may now be at the start of a new upward trend.

$MSFT - pattern breakdown here. below $410MSFT - weekly triangle pattern breakdown here. if continues to fail $410 we can see $400 and $385. put idea below $410

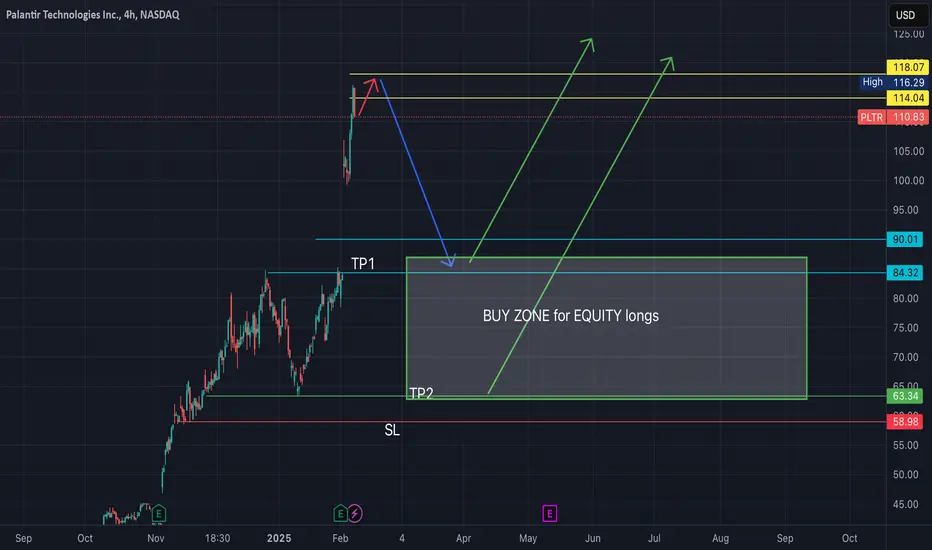
PLTR -- more volatility forecasted into MarchExpecting quick progression to 118$ level as final buy-side wave near term.
Looking for renewed significant selling action from that level to retrace price back to pre-earnings levels near 80-85$
Possibility exists (imho) that we fully retrace back to 63-64$ levels by April timeframe, depending on sentiment as we head into next FOMC meeting in mid-March.
After that, my cycles analysis indicates we will continue higher toward 120...Therefore, I will be planning on taking profits on put option contracts once underlying share price reaches below 85$, and will plan on scaling into long equity positions on discounts between 64-85$ for the projected subsequent buy wave to 120+
is NXE going to break trendline and go up for the next round?
For the 1-hour chart:
You can see a long upper wick followed by a large green candle and a medium-sized red candle.
Even this strong selling pressure, buyers are still in control - supported by a well-shaped RSI and momentum.
Over the past few days, the volume profile has shown a promising trend, indicating that buyers are gaining strength.
Let’s see if, this week, the price breaks the upper trendline or even crosses above the EMA25

NVDA Strong company still managing to advance in tech Came straight down after the deepseek fud. it was literally a selling cascade. In my opinion i thought it was an opportunity. the super micro computer project digit was amazing at CES 2025. $150 is still my first target after getting slapped back down to $112.

$PLTR 4h RSI, Vol. Bearish Divergence4H chart showing divergence and may not necessarily be a top but could be pulling back for a test of support. Watch 10DMA for potential support.

Chambal Fertilizers - Long*Chambal Fertilizers - CMP - 555 / Positional Trade*
*Buy Range 550 - 556 ONLY / Stop Loss 515 in weekly candle closing*
*Target 1 - 575*
*Target 2 - 600*
*Target 3 - 625 / 650*
Disclaimer: This is my view and for educational purpose only.

Swing trading from weekly trend support towards ATH, $87This swing trading setup displays the weekly trend holding up quite well for $UBER. The strategy here is accumulation towards weekly trend support for a swing trade to the upside towards all time highs ($87 resistance). If the breakout over $87 holds, this becomes even more appealing for that higher probability outcome of a sustained upside push. A sustained break below trend support would deter my interest for a swing trade.

Finer Market Points: ASX Top 10 Momentum Stocks: 10 Feb 2025TSX:AII SET:MVP ASX:NVU GETTEX:FGR NASDAQ:AMD ASX:ESR ASX:ETM ASX:LRV GETTEX:VTX EURONEXT:EGR Momentum leading shares are the market's best performers today. They are the fastest-growing shares on the ASX over the last 90 days. These companies can't get to be leaders without first appearing on our Launch Pad list. The Launch Pad List is shared on Thursdays and the video interview published after market close on Fridays. Today's ASX's Top 10 Quarterly Momentum Stocks are: Almonty Industries Inc. (AII) Medical Developments International Limited (MVP) Nanoveu Limited (NVU) First Graphene Limited (FGR) Arrow Minerals Limited (AMD) Estrella Resources Limited (ESR) Energy Transition Minerals Ltd (ETM) Larvotto Resources Limited (LRV) Vertex Minerals Limited (VTX) EcoGraf Limited (EGR)

Prediction About Mandiri Bank BMRIBank Mandiri IDX:BMRI is currently trading at 5,050, showing signs of weakness as it struggles to hold key support levels. If the stock fails to maintain support, we could see further downside movement, potentially testing levels around 4,500. This scenario aligns with the broader market sentiment and recent technical patterns.
Investors should closely monitor price action near the support zone, as a decisive breakdown may trigger increased selling pressure. However, if BMRI manages to hold above support and gains bullish momentum, a rebound could be in play. Keep an eye on volume and market conditions for confirmation before making any trading decisions.

AHLEAST: Poised for a Potential Reversal?AHLEAST is exhibiting a potential "extended retracement" pattern, where the price has bounced back for a Wave B, but is now anticipated to decline further to complete a Wave C.
The chart highlights a target zone for this extended retracement between 196-204 INR. This zone is based on a 113%-127% Fibonacci extension of the last swing low, indicating a deeper-than-usual retracement.
Currently, the stock is trading at 140.13 INR, significantly below the anticipated completion zone. This suggests further downside is likely.
Key Points:
Extended Retracement: The pattern suggests a deeper correction is underway.
Target Zone: The 196-204 INR range is a key area to watch for potential support and a possible trend reversal.
Wave C Completion: The current decline is expected to complete Wave C of the corrective pattern.
Considerations:
Confirmation: Traders should look for confirmation signals within the target zone, such as bullish candlestick patterns or a break of a short-term downtrend line, before considering a long position.
Stop-Loss: A stop-loss below the target zone would be prudent to manage risk, as a break below could lead to further declines.
Disclaimer: This analysis is based on the provided chart and is for informational purposes only. It is not financial advice. Trading in the stock market involves risk, and you could lose money. Conduct your own research and consult with a financial advisor before making any investment decisions.

NEST - CUP WITH HANDLEPosition Update: February 6, 2025
Key factors :
1. Low-risk entry point.
2. Very clear bases with VCP characteristics.
3. Has gone through its majority line of supply.
4. Moving on its own drummer, the stock price increased while the market crashing down.
5. High relative strength stock.
6. Volume dries up as less supply coming to the market.
7. The breakout was confirmed with a huge surge in volume.
Considerations : The current market environment remains challenging, with broader indices showing uncertain and inconsistent behavior. It is very few stocks that setting up decent bases.
I’d like to see if it can hold up and follow through from here.

CRSR (NASDAQ) - 1H Chart Long Trade Setup!🔥 🚀
🔍 Stock: CRSR (NASDAQ)
⏳ Timeframe: 1-Hour Chart
📈 Setup Type: Bullish Breakout
📍 Trade Plan:
✅ Entry Zone: Above $9.25 - $9.92 (Breakout Confirmation)
🟢 Take Profit 1 (TP1): $9.92 (First Resistance Target)
🟢 Take Profit 2 (TP2): $10.60 (Extended Bullish Target)
🚀 Stop-Loss (SL): Below $8.79 (Key Support)
📊 Risk-Reward Ratio: Favorable for a bullish continuation 🚀
🔹 Technical Analysis & Setup:
✅ Pattern: Falling Wedge Breakout 📈
✅ Breakout Confirmation Needed: Sustained price above $9.25 with volume increase
✅ Support & Resistance Levels:
🔸 $9.25 (Breakout Zone)
🔸 $9.92 (First Major Resistance)
🔸 $10.60 (Extended Target for strong momentum)
✅ Momentum Shift Expected: A breakout above $9.25 could trigger an upside rally 🚀
🔥 Trade Strategy & Refinements:
📊 Volume Confirmation: Look for increasing buying volume above $9.25 📈
📈 Trailing Stop Strategy: Once price reaches TP1 ($9.92), adjust SL higher to secure profits 🛑
💰 Partial Profit Booking: Take partial profits at $9.92 and let the rest ride toward $10.60+ 💵
⚠️ Fake Breakout Risk: If the price fails to hold above $9.25, reconsider entry ❌
🚀 Final Thoughts:
✅ Bullish Breakout Potential – High probability of continuation higher 📈
✅ Momentum Shift Possible – A move above $9.92 could accelerate upside 🚀
✅ Strong Risk-Reward Setup – SL at $8.79, TP at $9.92 - $10.60+ for optimal gains
📊 Trade Smart & Stick to the Plan! 🏆🔥
🔗 #StockMarket #CRSR #TradingSetup #TechnicalAnalysis #BreakoutTrade #DayTrading #MarketTrends #BullishSetup #ProfittoPath 🚀📈

#BhartiArtl Spot Sell Setup🔽#BHARTIARTL Spot Sell Setup
Last Close :1676.75 , Sell On Rise around 1718 For The Target 1462—-1286
Setup Will Fail If Breaks 1783 And Gives 2 Consecutive Candles Close above It

TSLA, Long, 15m✅TSLA is oversold and is showing a strong buy signal, with a bullish RSI divergence confirming a potential reversal. The price is expected to move higher in the short term.
LONG 🚀
✅ Like and subscribe to never miss a new analysis! ✅

$GOOG week of feb10thGoogl rejected prior day open
190 seems to be key level , hold above calls , reject below puts

$MSFT week of Feb10thMSFT neutral to bearish
Holds 405 and can test calls 414 ,419
Rejects 414 and puts to 405 ,400
