Looks like reaccumulation on NVAXI was wrong about the potential timing. But this still looks promising to me. This looks like a solid reaccumulation for NVAX. Should go up with the Russel 2000 if that ever has a breakout this cycle. Just my best guess.

$META week of Feb10thMETA analysis for this week of feb 10th- Neutral sentimet Likely inclined towards downside
Calls above 717
Puts below 712

$NVDA - week of Feb 10 2025NVDA -uptrend
Above 132-134 (demand/supply area)
Above 130- targets 132
Below 124 - Puts


Clearly time to SHORT... I couldn't help myself... as I'm watching the Super Bowl I seen a NASDAQ:TMUS commercial and felt it was only appropriate to look into the chart.
I noticed a recent visit to the Current Resistance level and thought I'd better point this out to my fellow TradingView investors. As you can see I drew a caution W in yellow, as that is the route I see ahead us... please don't get me wrong, this stock has been on a long term Bullish Run and that will continue for quite some time. However, as you can see, once it reached it's Resistance level... it was followed by a significant pullback to Support, which currently sits at 230.66. With that being said, I am definitely interested in jumping into a short term Put and expect to take some profits on the way back down.
The 225 Put expiring on 3/14 at a cost of .98 is very enticing!
Again, as I've said before... I am not a financial guru and definitely not your financial advisor (yet) but I will share with you my claims regarding what price action I see. I'd suggest you complete your own Due Diligence and not jump into mine or anyone else's picks without diving into some analysis yourself.
Last and definitely not least, to me, the most important part... Take Profits, Take Profits, Take Profits!!! I cannot stress that enough.
Good luck on your trading journey ladies and gentlemen!


RGTI - expect a pull back before it takes off againI think this is possible that this stock can take off having hit its first floor


A support at 155 before breakoutStill moving, so I will have more room to run before it comes down, looking for a start at 162.

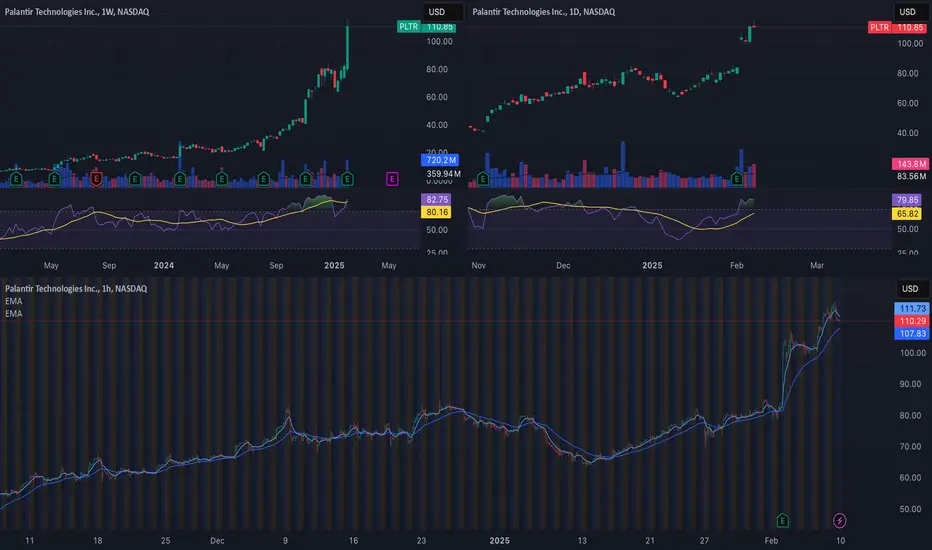
PLTRAudio Analysis: notebooklm.google.com
Below is an **integrated Fundamental and Technical Analysis** report on Palantir Technologies (PLTR), with a particular focus on the **bear case** and considerations for a **short sell** opportunity. Please note this is a **professional-level overview** intended for the trading floor manager, drawing upon both the high-level fundamentals and recent technical signals.
---
## 1. **Fundamental Analysis Recap**
1. **Sky-High Valuation Multiples**
- **Trailing P/E**: ~583×, which is extremely elevated versus historical and industry norms.
- **Forward P/E**: ~200× (based on ~$0.55 forward EPS), still far above typical high-growth tech peers and well beyond the ~20× S&P 500 average forward P/E.
- **Price/Sales**: ~87×, highlighting that revenue growth needs to stay exceptionally strong to justify current levels.
2. **Growth & Profitability**
- **Revenue Growth**: Q4 2024 revenue up 36% YoY; 2025 guidance at ~$3.75B (+31% YoY).
- **Margins**: Net margin around 18%—solid, but not extraordinary enough to sustain a 200× P/E if growth slows.
3. **Market Expectations & Analyst Targets**
- Consensus 12-month price target near $69–$70 implies ~37% downside from current levels ($110+).
- Stock price incorporates **aggressive AI-driven growth assumptions**, meaning any miss on guidance or shift in sentiment could trigger multiple compression.
4. **Overreliance on AI Hype**
- Palantir is benefiting from enthusiasm around its AI platform (AIP). Overreliance on a single narrative can inflate valuations—if the AI hype fades or competition intensifies, shares may correct sharply.
**Key Bearish Fundamental Takeaway**: **PLTR’s valuation appears stretched** relative to both broad market metrics and even other high-growth tech names. While growth remains robust, the current price suggests *near-flawless* execution for many years, creating a higher risk of a downside re-rating if sentiment changes.
---
## 2. **Technical Analysis Summary**
1. **Weekly Chart**
- **Extended Uptrend**: Price has risen parabolically, with weekly RSI above 80 (signaling overbought conditions).
- **Volume**: Surging volumes indicate strong buying, but watch for a volume spike on any significant down week, which could confirm selling pressure.
2. **Daily Chart**
- **Overbought Momentum**: Daily RSI also hovers in the high-70s to low-80s range—historically prone to consolidation or pullbacks.
- **Elevated Price vs. Moving Averages**: The stock is trading well above the 10-day and 20-day MAs. A break below these short-term MAs often triggers momentum traders to exit.
3. **Intraday (1-Hour) Chart**
- **Sharp Run-Up**: Price has advanced rapidly, with minimal pauses.
- **Profit-Taking Signs**: Slight cooling in the 1-hour RSI and the formation of small-bodied candles with upper wicks, hinting at short-term distribution or indecision.
**Key Bearish Technical Takeaway**: PLTR appears **technically overextended** in multiple timeframes. This increases the likelihood of a pullback or correction, especially if broader market sentiment towards high-multiple stocks worsens.
---
## 3. **Bear Case Rationale**
1. **Valuation Compression Risk**
- With P/E > 200× forward earnings, even a moderate downward revision in growth expectations could spur multiple contraction—potentially sending the stock sharply lower.
2. **Overbought Technicals**
- Weekly and daily RSIs in the 80s are historically unsustainable. Overbought conditions often precede consolidations or corrections, providing a window for short sellers to capitalize.
3. **Macro Factors & Rising Rates**
- Growth stocks with high valuations are particularly sensitive to interest rates. Any hint of tighter monetary policy can diminish risk appetite for stocks priced at extreme multiples.
4. **Analyst & Institutional Rotation**
- If institutional investors choose to rotate out of high-growth, high-valuation names into more defensive sectors, PLTR could see accelerated selling.
- The stated 12-month analyst consensus target implies substantial downside, suggesting limited support from the sell-side in the near term.
5. **AI Hype Vulnerability**
- Overreliance on an AI-driven narrative can be a double-edged sword. In the event that AI adoption or contract wins slow, the stock might face a severe revaluation.
---
## 4. **Potential Short-Sell Setups**
Below are two illustrative ways a short-seller might engage, each with varying risk levels:
1. **Momentum Shift Entry**
- **Trigger**: Wait for price to close below the 10-day or 20-day moving average on the daily chart with a confirmed pickup in sell volume.
- **Stop-Loss Consideration**: Place stops above the recent swing high (e.g., above $116–$120) to protect from a short squeeze if the bullish run persists.
- **Target Zones**: A price retracement toward the $90–$95 area (recent pivot/support) or the round number $100 could be initial downside targets.
2. **Rally Fade / Overbought Condition**
- **Trigger**: Enter a short position into a relief bounce back toward the prior highs if momentum indicators show a clear negative divergence (e.g., RSI making lower highs).
- **Stop-Loss Placement**: Just above the new local high—if price unexpectedly breaks higher, exit quickly.
- **Target Zones**: Scale out partial profits around the 50-day MA or psychological levels like $100. If broader market conditions worsen, a deeper move below $90 could be possible.
**Risk Management**: Shorting a high-momentum, high-volatility stock is inherently risky. Tight stops, position sizing, and continuous monitoring are essential. **Cover** promptly if price action contradicts the bearish thesis.
---
## 5. **Conclusion & Manager Summary**
**Fundamental Snapshot**:
- Palantir’s valuation is pricing in extraordinary future growth (P/E > 200× forward). Any slowdown or miss may induce significant downside.
- Analysts are cautious; consensus targets are below current price.
**Technical Situation**:
- Price is extended across multiple timeframes, with **overbought RSI** readings and a near-vertical price trajectory—historically indicative of potential pullbacks.
- A correction to technical support (near $100, or possibly $90–$95) may be in the cards if bullish momentum wanes.
**Bear Thesis / Short Opportunity**:
- **Rationale**: Extreme valuation + Overbought technicals + Potential macro headwinds = Elevated risk of a downside re-rating.
- **Strategy**: Look for a shift in short-term momentum (closing below key moving averages) or negative RSI divergence as a **potential short entry** signal. Set stops carefully above recent highs to cap losses.
Given the stock’s **hyper-bullish** sentiment, timing is crucial. If bullish momentum persists longer than expected, short positions risk facing quick squeezes. Nonetheless, the **probability of a meaningful correction** grows with each new leg higher, offering an appealing **risk/reward** profile for experienced traders prepared to manage volatility.
---
### **Final Note**
This combined **Fundamental + Technical** perspective suggests **caution** for long investors at these elevated levels and **potential opportunity** for short sellers anticipating a reversion to more sustainable valuation metrics. Proper risk controls—such as **position sizing, stop-loss orders, and regular re-evaluation** of the thesis—remain paramount.
Expedia Group (EXPE): Travel Demand Fuels Stock MomentumExpedia Group, Inc. (EXPE) is a major player in the online travel industry, helping people book flights, hotels, and vacation rentals with ease. With brands like Expedia, Hotels.com, and Vrbo, the company connects travelers to destinations worldwide. Growth is fueled by the increasing demand for travel, digital booking trends, and partnerships with hotels and airlines that expand its offerings.
On the stock chart, EXPE recently showed a confirmation bar with increasing volume, moving into the momentum zone, which happens when the price moves above the 0.236 Fibonacci level. This signals growing investor confidence and potential for further gains. A trailing stop can be set using Fibonacci levels with the Fibonacci snap tool, helping traders protect profits while allowing room for continued growth. Risk and trade management is key to staying in winning trades without exiting too soon.

$AMZN week of Feb 10 2025Sentiment -> Neutral to Bearish
Amzn holds 232 &cross prev highs 235 ->target 237, 240
Forms base at 226 ,can test 229, 232
Breaks 226-> 220, 218 NASDAQ:AMZN

TLYS Potential Long Idea VS Custom IndicatorsAn idea for +200% price change from local low.
This bullish opportunity is shown to us through custom indicators , fair value inefficiency , and liquidity pools .
Shown is the entire history of TLYS on the NYSE, using 1 month candlesticks.
Custom Indicators
-The top indicator (MP) is showing times when large players/market makers are buying. That time is shown with blue vertical stripes. Following these signals, we see an upward movement in price, 100% of the time.
-The bottom indicator (Market Mood) can also tell us when there is a opportunity for an upward movement in price. When the indicator is displaying the white area, we can see submission of the market. Following these white signals, we see an upward movement in price, 100% of the time.
Fair Value Inefficiency
-Marked with white rays are gaps in the agreed upon price of this asset. In this case, I marked the top of these gaps. As one can see, the price in 2020/2021 had increased over 400% to "close" this gap in value and return (impermanently) to the $16.04 price tag.
-Based on price movement in the past, it seems more than possible for price to move up 260% from low of $3.22, to close the current gap at $11.77.
Liquidity Pools
-Labeled are two sets of relative equal highs . These are levels that act as magnets for price, both upward and downward. Previously when we saw relative equal highs, we saw price return ~15 months later. Price moved up over 260% from a low of $3.46, to equal highs at $13.11.
-In the past, the liquidity of the relative equal highs pushed price upward to close the gap in fair value . Based on this, we can expect that the liquidity pool from the current set of relative equal highs, will push price upward to our target of $11.77
-While not marked on the chart, we can see low side liquidity. We recently dipped below the previous all time low of $3.46. The past two times this occurred, we saw a large upward movement in price in the next 1-15 months.
Conclusion
Using all three of these aspects, I think it is more than likely that price will impermanently return to $11.77 in the following 12-24 months. Idea is based solely on technical analysis of the TLYS chart. This is not investment advice, always DYOR and use proper risk management.
Custom Indicators built by www.tradingview.com
All analysis of indicators and chart are my own!

Rio Tinto (RIO) / Australian Dollar | Chart & Forecast SummaryKey Indicators On Trade Set Up In General
1. Push Set Up
2. Range Set up
3. Break & Retest Set Up
Notes On Session
# Rio Tinto (RIO) / Australian Dollar
- Double Formation
* ABC Flat | Entry & Sideways Correction
* 012345 | Wave Feature & Short Set up | Subdivision 1
- Triple Formation
* 1st Trendline | Triangle Configuration | Subdivision 2
* 2nd Trendline | Support & Ranging Structure | Subdivision 3
* Daily Time Frame | Trend Settings Condition
Active Sessions On Relevant Range & Elemented Probabilities;
European Session(Upwards) - US-Session(Downwards) - Asian Session(Ranging)
Conclusion | Trade Plan Execution & Risk Management On Demand;
Overall Consensus | Neutral

Casually made a chart pattern and forgot to look back at it. Now look. Right where I thought and right when I expected it to happen. Bummer. But it’s okay. It happens when you look at loads of charts. Just good for the ol’ confidence bank.

Head and shoulders with open gapThis is not a good look. Just putting it nice. I see a gap full coming up.

SBUX - 6 months SYMMETRICAL TRIANGLE══════════════════════════════
Since 2014, my markets approach is to spot
trading opportunities based solely on the
development of
CLASSICAL CHART PATTERNS
🤝Let’s learn and grow together 🤝
══════════════════════════════
Hello Traders ✌
After a careful consideration I came to the conclusion that:
- it is crucial to be quick in alerting you with all the opportunities I spot and often I don't post a good pattern because I don't have the opportunity to write down a proper didactical comment;
- since my parameters to identify a Classical Pattern and its scenario are very well defined, many of my comments were and would be redundant;
- the information that I think is important is very simple and can easily be understood just by looking at charts;
For these reasons and hoping to give you a better help, I decided to write comments only when something very specific or interesting shows up, otherwise all the information is shown on the chart.
Thank you all for your support
🔎🔎🔎 ALWAYS REMEMBER
"A pattern IS NOT a Pattern until the breakout is completed. Before that moment it is just a bunch of colorful candlesticks on a chart of your watchlist"
═════════════════════════════
⚠ DISCLAIMER ⚠
Breakout Area, Target, Levels, each line drawn on this chart and any other content represent just The Art Of Charting’s personal opinion and it is posted purely for educational purposes. Therefore it must not be taken as a direct or indirect investing recommendations or advices. Entry Point, Initial Stop Loss and Targets depend on your personal and unique Trading Plan Tactics and Money Management rules, Any action taken upon these information is at your own risk.
═════════════════════════════

FMC Long. Lower first.We will continue lower and I wouldnt enter this stock for a long term hold until my box.

RCUS LONGI expect a first touch bounce of the montly $11.66 level. I pulled this fib off the move to the all time high and I will be targeting the two boxes above. My fibs are pulled from the move to the all time high.

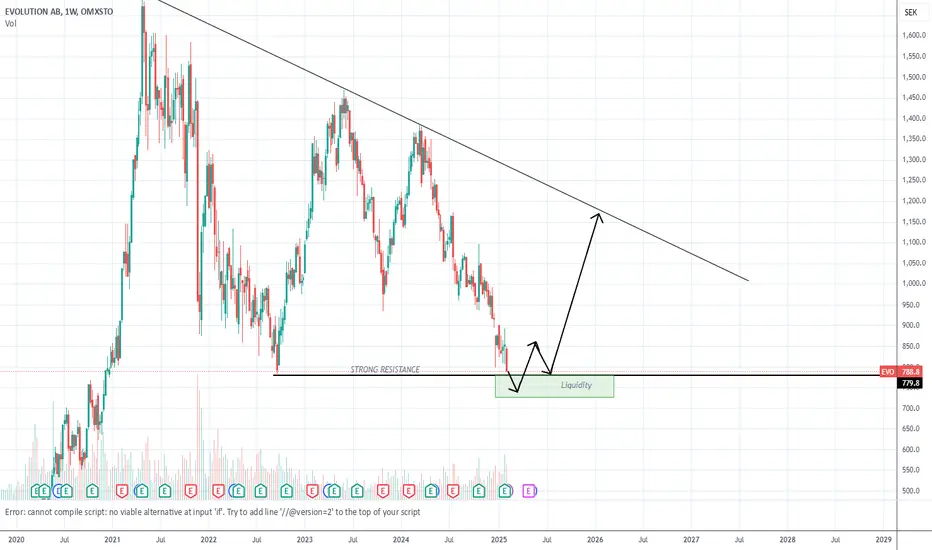
BullishEVO is going below strong resistance, then gaining liquidity and moving up. Fundamentally, it is a very good company with a ridiculous price.
PLTR at ResistanceHuge resistance here. I expect a move down if we dont start gaining levels here. Don't get too excited PLTR holders.
My fibs are projections off past monthly moves to the high which is my proprietary fib pull!
Thanks for reading!

Bullish Trade on AMZNStill in an overall bullish trend.
In the short-term, it could lower towards 225 and 215.
If it holds 215 then AMZN could return to all-time highs.

COST Short and LongI am bearish on Cost for now until we get into major support below. I wont be buying until the $500 to $350. I cant see the future and we might blow through this resistance and go higher, but I would love to get long in the next year or two if we ever see a retrace down. Short play for now.
$758 would be my target for shorts and a very bullish entry. Confluence between my fib method and it is an untested level.
