Casually made a chart pattern and forgot to look back at it. Now look. Right where I thought and right when I expected it to happen. Bummer. But it’s okay. It happens when you look at loads of charts. Just good for the ol’ confidence bank.

Head and shoulders with open gapThis is not a good look. Just putting it nice. I see a gap full coming up.

SBUX - 6 months SYMMETRICAL TRIANGLE══════════════════════════════
Since 2014, my markets approach is to spot
trading opportunities based solely on the
development of
CLASSICAL CHART PATTERNS
🤝Let’s learn and grow together 🤝
══════════════════════════════
Hello Traders ✌
After a careful consideration I came to the conclusion that:
- it is crucial to be quick in alerting you with all the opportunities I spot and often I don't post a good pattern because I don't have the opportunity to write down a proper didactical comment;
- since my parameters to identify a Classical Pattern and its scenario are very well defined, many of my comments were and would be redundant;
- the information that I think is important is very simple and can easily be understood just by looking at charts;
For these reasons and hoping to give you a better help, I decided to write comments only when something very specific or interesting shows up, otherwise all the information is shown on the chart.
Thank you all for your support
🔎🔎🔎 ALWAYS REMEMBER
"A pattern IS NOT a Pattern until the breakout is completed. Before that moment it is just a bunch of colorful candlesticks on a chart of your watchlist"
═════════════════════════════
⚠ DISCLAIMER ⚠
Breakout Area, Target, Levels, each line drawn on this chart and any other content represent just The Art Of Charting’s personal opinion and it is posted purely for educational purposes. Therefore it must not be taken as a direct or indirect investing recommendations or advices. Entry Point, Initial Stop Loss and Targets depend on your personal and unique Trading Plan Tactics and Money Management rules, Any action taken upon these information is at your own risk.
═════════════════════════════

FMC Long. Lower first.We will continue lower and I wouldnt enter this stock for a long term hold until my box.

RCUS LONGI expect a first touch bounce of the montly $11.66 level. I pulled this fib off the move to the all time high and I will be targeting the two boxes above. My fibs are pulled from the move to the all time high.

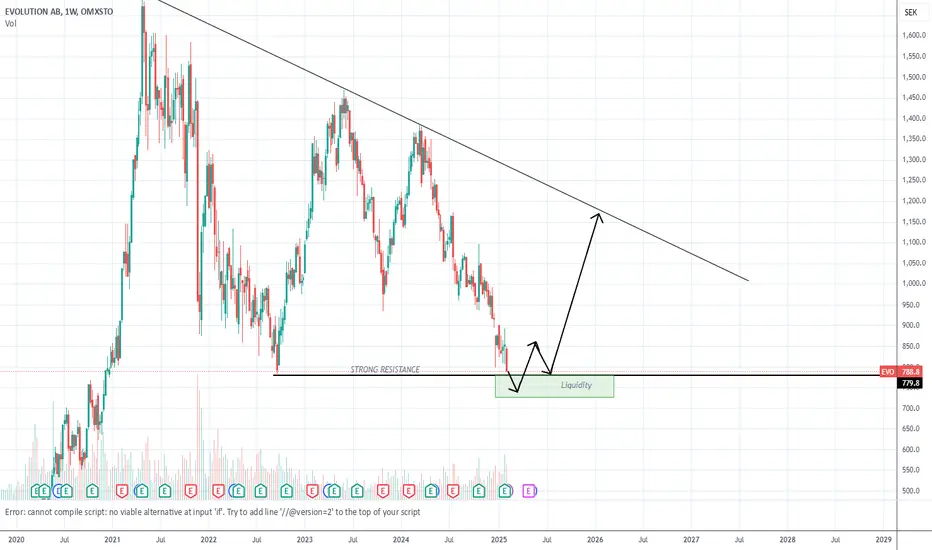
BullishEVO is going below strong resistance, then gaining liquidity and moving up. Fundamentally, it is a very good company with a ridiculous price.
PLTR at ResistanceHuge resistance here. I expect a move down if we dont start gaining levels here. Don't get too excited PLTR holders.
My fibs are projections off past monthly moves to the high which is my proprietary fib pull!
Thanks for reading!

Bullish Trade on AMZNStill in an overall bullish trend.
In the short-term, it could lower towards 225 and 215.
If it holds 215 then AMZN could return to all-time highs.

COST Short and LongI am bearish on Cost for now until we get into major support below. I wont be buying until the $500 to $350. I cant see the future and we might blow through this resistance and go higher, but I would love to get long in the next year or two if we ever see a retrace down. Short play for now.
$758 would be my target for shorts and a very bullish entry. Confluence between my fib method and it is an untested level.

TPR If i were going to short this i would do it in my box. But with the trend on the yearly chart up, I dont think it is wise unless we start to see some failure first. Thought I post regardless. If we ever get to my bottom box I would buy a ton of this.

NOW. Almost at resistance. Long term play.I expect a rejection at my projections. Might find support at the first level below the top box. I will consider a long there, but I will post a new chart once we get close to there. Would take a big position if we ever got to my bottom box.

$KHC The Kraft Heinz Company -
- Potential Range Fib Golden Pocket Support
- Bullish Weekly Hammer Candle
- Potential Daily Double Bottom
- Upside LOI's $29.56/ $30.01 / $30.68
- Must Hold Support $28.30

ACI. Long in the box. I have projections lower on this stock. My projections are from my proprietary fib pull and very accurate. The yearly chart trend has a lower high than the all time high and we can expect to make new lows. if we hold the previous lows and start to gain levels, this entry would be invalidated.
I wouldnt long this stock unless we get to the box. Too much risk to the downside to justify taking a position before the lows are cleared out.

CNC. Will we finally see CNC reverse? This is an untested yearly level and major point of support on the chart and according to my proprietary fib pulls. Will long here with a stop loss to see if we can test all time highs again. The chart speaks for itself.

Fundamental and Techincal support the moveI really like this opportunity, so I'm making a big move first thing Monday morning. The earnings are strong, and the stock has broken out of the accumulation phase with a big candle and high volume. I see potential for a continuation up to $150, but let's see how it plays out.

WFRDWill long this untested level. This is a failure to gain on the yearly chart and a major point of support. I dont expect it going to the level below.


SMCI I want to see SMCI hold the bottom box and pump to the top box. A short trade in the box would be valid as well. If we gain and hold the top box, we could expect all time highs.

Long at this yearly level!I normally dont take trades like this. I havent been the best at catching trending stocks as they're already going up. I really like this chart for higher. I am going to hold a long term position from this level.


Looking likely at a retrace to 380s based on overly bought A simple practice, from a basic 101, stands out as the chart pattern has told us numerous times, the last candle, the overbought areas to reconcile all this and more expect a correction.

$HSY The Hershey Company- Potential Reversal - End of Week Reversal
- Range VAL (Value Area Low) Support
- Range Fib GP support
- Weekly Bullish Divergences
- Support LOI $150.47
- Upside Trigger $156.70

$CL Colgate- Palmolive Company Back-test- Breakout Back-test held again
- W100sma Held again
- Bullish Divergence on Daily RSI
Upside LOI's $86.97 / $87.39/ $88.77 / 89.36
Support LOI's $85.68
