Long Term Trade ARE&M Buy Zone Marked
T1 - 1770/- (Time Frame - 4 to 6 month) - 65%
T2- 2570/- (Time Frame - 6 to 12 month) - 141%
Only for education purposes

SERV Big PotentialCreated meaningful resistance just under $20 now looking to breach it, could be a big one, 16% on Friday alone

CVNA Long. If I’m right follow for moreBeautiful ascending channel getting over prior resistance creating a low risk high reward setup. Cup n Handle-esk on the weekly

BE Long. If I’m right follow for moreBeautiful consolidation above the MA. Get ready for higher price

SOKOUK HOLDINGacording to my previous technical studies,i see a great opportunity with high probability of succes,the details are reflected in tge chart,good luck to all

MANAPPURAM FINANCE POSITIVEWeekly strong positive close,
Daily candle close 10,20 ema Cross.
Tomorrow if 2hr candle close postive 210 up,then buy, sl 2hr candle low,
First target 220. Second target 230

Citigroup Inc Stock Quote | Chart & Forecast SummaryKey Indicators On Trade Set Up In General
1. Push Set Up
2. Range Set up
3. Break & Retest Set Up
Notes On Session
# Citigroup Inc Stock Quote
- Double Formation
* (Uptrend Argument)) | Completed Survey
* ABC Flat & Entry Feature | Subdivision 1
- Triple Formation
* 1st Retracement | Retest Area & Uptrend Bias | Subdivision 2
* 2nd Retracement | Long Support | Subdivision 3
* Daily Time Frame | Trend Settings Condition
Active Sessions On Relevant Range & Elemented Probabilities;
European Session(Upwards) - US-Session(Downwards) - Asian Session(Ranging)
Conclusion | Trade Plan Execution & Risk Management On Demand;
Overall Consensus | Buy

Meta Short: PeakedI've explained in this video why I think Meta has peaked. Here's the summary:
1. Completion of 5 waves.
2. Fibonacci Extension level hit (target: $725.76, actual: $725.01, diff: $0.75)
3. Bearish Reversal candle with high enough volume (I missed mentioning this in the video)
This is a good risk-reward trade with Stop at $726 and take profit at $550.
Good luck!

Rattan india updated chart Rattan india updated chart cmp 52 on 09.02.2025 if it can reach at Price revese zone than it can go up side ..

BA Stock Analysis: Potential Breakout and Key Resistance LevelsDisclaimer: This is not trading or financial advice, just current speculation:
BA is currently testing support at the 0.382 Fibonacci level (181.75). The RSI and MACD indicators suggest a potential breakout to the upside. If the price breaks above the current range at 182.02, it could move toward 182.59. After that, the next resistance is at 182.80, followed by a resistance zone around 182.98. The next key level to watch would be the 0.618 Fibonacci retracement at 183.40.

JSW Energy bulish pattern JSW Energy bulish pattern cmp 484 on 09.2.25 it can agin retest and reverse for up side .

SINOPEC SHANGHAY PETROCHIMICALo
acording to my previous technical studies,i see a great opportunity with high probability of succes,the details are reflected in tge chart,good luck to all

REC Ltd bulish butterffly pattern REC Ltd bulish butterffly pattern cmp 441 on 09.02.2025 ... as per the price action looking bulish and shortly reach the marked target ..

Dr Reddy Trading OpportunityWait for Pull back to Fib 0.5 Level
Buy at 1200-1210
SL 1150
Target 1 1300
R:R 1:2

Kotak mahindra bearish pattern Kotak mahindra bearish pattern cmp 1929 on 09.02.2025 looking trend change if reverse from the marked level

Apollo Hospitals Trading Opportunity. 3%Apollo Hospitals at Trend Line support zone
Good Risk: Reward

Bajaj finance bearish butterfly pattern Bajaj finance bearish butterfly pattern cmp 8474 on 09.02.2025 it can fall from the marked level will see ..

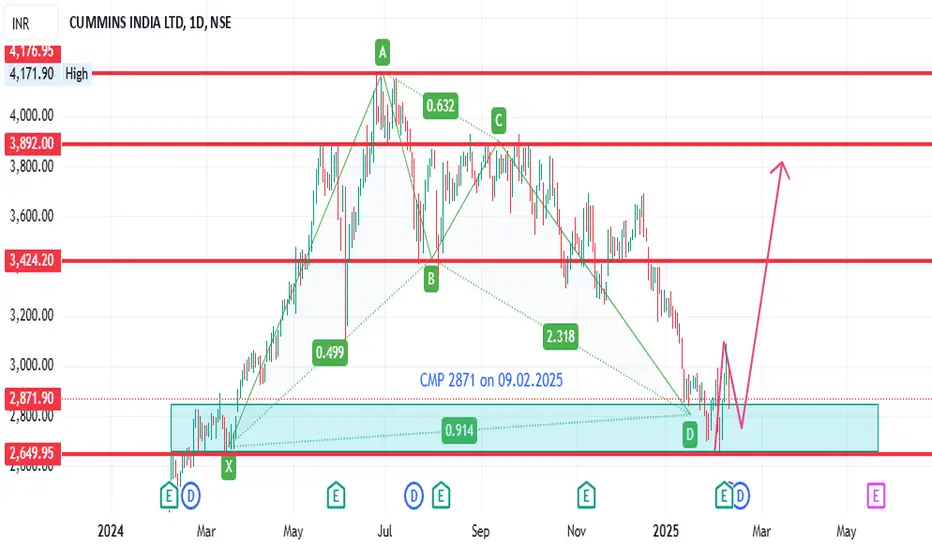
cummins india bulish bat pattern cummins india bulish bat pattern cmp 2871 on 09.02.2025 .. will find the bulish candle at PRZ then will take the entry
Sun Tv bulish bat pattern Sun Tv bulish bat pattern cmp 631 on 09.02.2025 if form bulish candle in this zone it can easily complate the all target ... will see..

Siemens bulish bat pattern Siemens bulish bat pattern cmp 5505 on 09.2.25 once reached at demand zone it can reverse to upside

Power grid bulish bat patternPower grid bulish bat pattern cmp 278 on 09.02.25 trading in demand zone now it can move to upside .. will see the bulish candle in this zone ..


NBIS updateNBIS updated supply and demand zones. I entered when my alarm went off at 30$ pre-market that day. Since the trend is bullish I will use moving averages to DCA alongside this teal trend line. I will sell CC as we approach supply (red box), and sell CSP when we are close to demand (green box).
