Pipstocrat Technical Patterns: EngVol, FVG & OBKey Features:
Fair Value Gaps (FVG): Highlights price imbalances where liquidity is likely to be filled.
Order Blocks (OB): Identifies key institutional buying and selling zones for potential reversals.
Wick-Based Supply & Demand (WSD): Detects areas of strong rejection for precise entry signals.
Engulfing Candle with Volume Confirmation: Marks strong reversals when supported by volume.
How to Use:
Look for rejection at OB, FVG, or WSD zones before entering a trade.
Confirm entry signals with engulfing candles backed by volume to reduce false breakouts.
Manage risk using a Risk-Reward Ratio (1:3 to 1:9) for optimal trade execution.
This indicator is ideal for traders who follow smart money concepts and want to align with institutional liquidity movements. It provides real-time visual cues for entry and exit, helping traders refine their strategy and increase their edge in the market.
Candlestick analysis

Unmitigated 50% of the RangeThis indicator is designed to display unmitigated 50% zones of price ranges within two swing (High and Low) points. The 50% level serves as a probable target for retracements before the price resumes its movement in the direction of the most recent swing. The underlying theory is that Price Action tends to correct unbalanced price zones by returning to 50% of the range.
The indicator identifies highs and lows utilizing the “Left Swing Sensitivity” setting, which detects the high/low points within the specified number of bars. It then ensures that the zone meets a minimum size requirement, configured via the “Minimum Leg Size” setting, to filter out smaller legs/zones that would not provide sufficient profit and loss opportunities for entries at 50% and take profit at the most recent swing point.
To prevent duplication of zones when the price is gradually moving up, an "Auto Adjust Levels" setting is available. Enabled by default, this feature automatically cleans up smaller zones, retaining only the primary zone between the most recent swing point and the outer swing.
Additionally, the indicator automatically removes mitigated zones where the price has returned to the 50% level, thus maintaining clean charts.
There are several visualization settings available, offering comprehensive control over what is displayed on the charts:
Control the color and style of the lines representing the 1, 0, and 50% levels.
Choose whether to display labels and if they should show the price at the rendered levels.
Optionally extend the lines/labels to the right for each level.

FCPO 5-Minute Moving Average Crossover Strategy Hazmi### EMA 15 & 35 Crossover Strategy Explanation
This strategy uses two Exponential Moving Averages (EMAs) with periods of 15 and 35 to identify potential buy and sell signals based on crossovers.
#### Key Components:
1. **EMA 15**: A faster-moving average that reacts quickly to price changes.
2. **EMA 35**: A slower-moving average that smooths out price fluctuations and provides a broader trend perspective.
#### Strategy Rules:
1. **Buy Signal**: When the **EMA 15** crosses **above** the **EMA 35**, it indicates a potential uptrend. This is a signal to **buy** or go long.
2. **Sell Signal**: When the **EMA 15** crosses **below** the **EMA 35**, it indicates a potential downtrend. This is a signal to **sell** or exit the position.
#### How It Works:
- The crossover of the faster EMA (15) above the slower EMA (35) suggests increasing momentum and a potential upward trend.
- Conversely, the crossover of the faster EMA (15) below the slower EMA (35) suggests weakening momentum and a potential downward trend.
#### Example:
- If the **EMA 15** moves from below to above the **EMA 35**, it’s a **buy signal**.
- If the **EMA 15** moves from above to below the **EMA 35**, it’s a **sell signal**.
#### Advantages:
- Simple and easy to implement.
- Effective in trending markets.
#### Disadvantages:
- Can produce false signals in sideways or choppy markets.
- Lagging indicator, as it relies on past price data.
This strategy is commonly used in technical analysis to capture trends and generate trading signals. You can backtest it on historical data to evaluate its performance.

Opening Range Breakout (ORB)Plots the opening range and signals either buy or sell upon break :) Join my discord group at Blackjacktradinggroup on youtube, Instagram. love to talk to new traders and share ideas and strategies

Explosive Move Fibonacci Levels### **Explosive Move Fibonacci Levels - Indicator Description**
The **Explosive Move Fibonacci Levels** indicator is designed to identify significant price movements and automatically plot Fibonacci retracement levels based on the detected move. It provides traders with a **customizable** tool for analyzing market reactions to explosive price shifts.
#### **Key Features:**
✅ **Detects Explosive Moves**
- Uses customizable parameters to identify a strong price movement based on:
- Large candle body relative to an average lookback period
- Volume surge exceeding the historical average
- ATR-based volatility expansion
✅ **Automatically Draws Fibonacci Levels**
- Upon detecting an explosive move, the indicator **plots Fibonacci retracement levels** between the high and low of the move.
- Default levels: **23.6%, 38.2%, 50%, 61.8%, 78.6%** (fully adjustable).
✅ **Highly Customizable**
- **Modify Fibonacci levels**: Adjust retracement percentages for your strategy.
- **Customize colors**: Assign different colors to each level.
- **Adjust line properties**: Change line **width** and **style** (solid, dashed, dotted).
- **Control sensitivity**: Tune body size, volume, and ATR multipliers to refine move detection.
✅ **Visual Enhancements**
- Highlights **candles** that triggered an explosive move with a custom color.
- Draws **Fibonacci lines forward** on the chart for easy visualization.
#### **How It Works:**
1. The indicator scans for a candle that meets **explosive move conditions**.
2. If detected, it stores the **high** and **low** of that move.
3. Fibonacci retracement levels are calculated and plotted **forward** on the chart.
4. The **most recent explosive move** remains visible while previous levels are cleared.
### **Best Use Cases:**
📈 **Momentum Trading** – Identify strong moves and use Fibonacci levels for entries/exits.
📉 **Reversal Trading** – Spot potential pullbacks to key Fib levels after strong trends.
🕵️ **Trend Analysis** – Observe retracement behavior for confirming trend strength.
This indicator is ideal for traders looking to integrate **dynamic Fibonacci levels** with momentum-based setups. 🚀

Combined CALL & PUT Candles / Pair TradingThis script plots Combined candles for two instruments (e.g., a Nifty Call and a Nifty Put option) and calculates their combined Candle / HA candle in a separate pane. It also includes an Exponential Moving Average (EMA) of 11 periods that changes color based on the trend.
This indicator can be used for Pair Trading as well
The user can:
Choose between normal candles or Heikin Ashi candles.
Select which instruments (Call or Put) to display.
See a combined HA candle, which takes an average of the selected instruments.
View a trend-based EMA (11-period) that turns green for uptrends and red for downtrends.
Pros (Advantages)
✅ Clear Trend Visualization – Heikin Ashi candles smooth price action and help filter out noise.
✅ Dual Instrument Analysis – Users can compare Call and Put options together.
✅ Customizability – Options to enable/disable individual instruments and choose candle types.
✅ Trend Indication – The EMA provides a quick visual cue on the trend direction.
✅ Better Decision-Making – Helps traders analyze combined movement instead of just one instrument.
Cons (Limitations)
❌ Lagging Indicator – HA candles and EMA introduce lag since they are calculated using past data.
❌ No Wick Visibility – Only the candle bodies are plotted, which may hide key price action details.
❌ Limited Use in Fast Markets – The smoothing effect may cause delays in reflecting sudden price movements.
❌ No Volume Consideration – The script does not factor in trading volume, which can be crucial in options trading.
Who Can Use This?
🔹 Options Traders – Those analyzing Call and Put movement together.
🔹 Trend Followers – Traders looking for smooth price action and clear trend signals.
🔹 Algorithmic Traders – Those who want a simplified trend view for strategy development.

Price Speed per Minute with Triangles Ver.1.0 - Hasbab 2025Price Speed per Minute with Triangles
PAID VERSION 1.0
-----------------
Price Speed Calculation:
Speed is calculated as (Close - Open) / minutes_per_candle.
Average Speed Calculation:
The average speed of the previous two candles is calculated for comparison.
Triangle Logic:
If the current candle's speed is greater than the average of the previous two candles, a triangle (▲) is displayed.
If you set:
Minutes per Candle = 5
Number of Candles = 10
The table will look like this:
Candle Speed (5m)
1 0.00345 ▲
2 0.00210
3 -0.00150
... ...
10 0.00120 ▲
The triangle (▲) indicates that the speed for that candle is faster than the average of the previous two candles.
Please feel free to comment whether you can catcth the turn and make sense of your candle with this method.
paypal if you want to share your profit
azcorp.Borneo@gmail.com

*VIP*Trend Lines, Breakouts, Triangles, Volume*VIP*Script Overview
This script provides an automated analysis of price action by identifying key technical patterns and signals. It includes trend lines, breakout alerts, triangle formations, volume analysis, candlestick patterns, and Fibonacci levels to assist with trading decisions.
Features & Functionality
📈 Trend Lines : A sloping trend line is drawn from the first bar, extending to the right. Price breakouts above or below this line are automatically flagged.
🚀 Breakout Patterns : When the price crosses the trend line, a “Take Profit Here” label is placed to highlight potential trading opportunities.
🔺 Triangle Patterns : Simulated triangle formations are drawn using horizontal lines to mark the top and bottom boundaries.
📊 Volume Analysis : Volume spikes are detected when the trading volume exceeds twice the 20-period SMA of volume.
🕯 Candlestick Patterns : Key reversal patterns like bullish and bearish engulfing formations are identified and marked on the chart.
📌 Support & Resistance Levels : Major price levels are automatically identified and plotted as dotted lines.
📐 Fibonacci Levels : Fibonacci retracement and extension levels are calculated and displayed for trend-based analysis.
How to Use
1️⃣ Add the script to your TradingView chart.
2️⃣ Adjust parameters (e.g., trend line slope, Fibonacci levels) to fit your trading strategy.
3️⃣ Look for signals like breakout alerts, volume spikes, and candlestick patterns to guide your trading decisions.
4️⃣ Customize further if needed—this script serves as a foundation for your personalized trading analysis.
If you have suggestions i am open to them.

ORB with 100 EMAThis was created to only take trades when ORB is above or below 100ema. If ORB is above 100ema and candle closes above opening range then we look for longs aiming for 1:1. If ORB is below 100ema and candle closes below opening range we look for shorts aiming for a 1:1.
This is the initial release to get feedback. I will be updating to signify the significant entry points.

Vertical Lines & MACD High/Low pmThis indicator tracks the MACD phase changes and identifies the highest and lowest prices within each phase. It updates the highest and lowest values for each MACD phase and displays labels directly on the candlesticks at those price points. Whenever the MACD crosses over or under the signal line, it marks the end of the previous phase and the beginning of a new one. The labels show the high and low prices as "🔺" for the peak and "🔻" for the trough. This process occurs continuously across the entire 1-minute chart.

ORB with 100 EMAORB Trading Strategy for FX Pairs on the 30-Minute Time Frame
Overview
This Opening Range Breakout (ORB) strategy is designed for trading FX pairs on the 30-minute time frame. The strategy is structured to take advantage of price momentum while aligning trades with the overall trend using the 100-period Exponential Moving Average (100EMA). The primary objective is to enter trades when price breaks and closes above or below the Opening Range (OR), with additional confirmation from a retest of the OR level if the initial entry is missed.
Strategy Rules
1. Defining the Opening Range (OR)
- The OR is determined by the high and low of the first 30-minute candle after market open.
- This range acts as the key level for breakout trading.
2. Trend Confirmation Using the 100EMA
- The 100EMA serves as a filter to determine trade direction:
- Buy Setup: Only take buy trades when the OR is above the 100EMA.
- Sell Setup: Only take sell trades when the OR is below the 100EMA.
3. Entry Criteria
- Buy Trade: Enter a long position when a candle breaks and closes above the OR high, confirming the breakout.
- Sell Trade: Enter a short position when a candle breaks and closes below the OR low, confirming the breakout.
- Retest Entry: If the initial entry is missed, wait for a price retest of the OR level for a secondary entry opportunity.
4. Risk-to-Reward Ratio (R2R)
- The goal is to target a 1:1 Risk-to-Reward (R2R) ratio.
- Stop-loss placement:
- Buy Trade: Place stop-loss just below the OR low.
- Sell Trade: Place stop-loss just above the OR high.
- Take profit at a distance equal to the stop-loss for a 1:1 R2R.
5. Risk Management
- Risk per trade should be based on personal risk tolerance.
- Adjust lot sizes accordingly to maintain a controlled risk percentage of account balance.
- Avoid over-leveraging, and consider moving stop-loss to breakeven if the price moves favourably.
Additional Considerations
- Avoid trading during major news events that may cause high volatility and unpredictable price movements.
- Monitor market conditions to ensure breakout confirmation with strong momentum rather than false breakouts.
- Use additional confluences such as candlestick patterns, support/resistance zones, or volume analysis for stronger trade validation.
This ORB strategy is designed to provide structured trade opportunities by combining breakout momentum with trend confirmation via the 100EMA. The strategy is straightforward, allowing traders to capitalise on clear breakout movements while implementing effective risk management practices. While the 1:1 R2R target provides a balanced approach, traders should always adapt their risk tolerance and market conditions to optimise trade performance.
By following these rules and maintaining discipline, traders can use this strategy effectively across various FX pairs on the 30-minute time frame.

Enhanced Trading StrategyHow the Script Works
1️⃣ SuperTrend Indicator (Trend Direction)
The script calculates Average True Range (ATR) to measure market volatility.
It then derives upper and lower trend levels to determine the SuperTrend direction:
If price is above the lower trend level, the trend is bullish (1).
If price is below the upper trend level, the trend is bearish (-1).
2️⃣ Moving Averages for Trend Confirmation
Uses Short Moving Average (SMA-9) and Long Moving Average (SMA-21) to confirm trends.
Bullish crossover (SMA-9 crosses above SMA-21) → Buy signal.
Bearish crossover (SMA-9 crosses below SMA-21) → Sell signal.
3️⃣ RSI for Overbought/Oversold Conditions
Relative Strength Index (RSI-14) helps identify momentum.
If RSI < 70, it's not overbought, making it safer to buy.
If RSI > 30, it's not oversold, making it safer to sell.
4️⃣ Stop Loss & Take Profit Mechanism
Stop Loss: Limits losses by exiting if price falls 2% below buy price.
Take Profit: Locks in gains if price rises 4% above buy price.
Exit trades when RSI conditions or price levels hit the stop loss/take profit.
How It Analyzes the Chart
Identifies market trend (SuperTrend).
Filters trends with Moving Averages to avoid false signals.
Uses RSI to confirm if an asset is overbought or oversold.
Sets automatic buy/sell alerts with stop-loss and take-profit levels.
✅ Buy Signal:
Short MA crosses above Long MA
RSI below 70 (not overbought)
SuperTrend is bullish (1)
❌ Sell Signal:
Short MA crosses below Long MA
RSI above 30 (not oversold)
SuperTrend is bearish (-1)
Final Thoughts
This strategy combines trend-following (SuperTrend & MA) with momentum analysis (RSI) to minimize false signals and improve trading accuracy. It's suitable for stocks, forex, crypto, or any financial market. 🚀

Volume-Based Candle Coloringvolume candle coloring
for breakouts and ChoCh
smart money inside the candle

Gap Detection & TrackingGap detector Filled and unfilled
It detect gaps which are filled and which are unfilled.
Unfilled gaps are marked in purple.
It can be customized using settings and gap %age can be chosen.

My Own EMA and RSI Entry Strategyهذه الاستراتيجية تقوم بالتداول بناءً على الشروط التالية:
الدخول في صفقة شراء:
يكون السعر فوق المتوسطين المتحركين الأسيين (EMA) 33 و313.
مؤشر القوة النسبية (RSI) أعلى من 50.
يحدث ذلك خلال ساعات افتتاح السوق الأمريكية (من 9:30 صباحًا إلى 4:00 مساءً بتوقيت نيويورك).
لا يتم الدخول في الصفقة إلا إذا كان RSI قد انخفض سابقًا تحت مستوى 50 (إعادة التعيين).
الخروج من الصفقة:
يتم الخروج عندما يصل RSI إلى 70 أو في حال فقدان أحد شروط الدخول (مثل أن ينخفض السعر تحت أحد المتوسطات المتحركة أو RSI يقل عن 50).
إعادة الدخول:
بعد الخروج من الصفقة، لا يتم الدخول مجددًا حتى ينخفض RSI تحت مستوى 50 أولاً، ثم تتحقق جميع شروط الدخول مرة أخرى.
ملخص الهدف:
الاستراتيجية تسعى للاستفادة من الحركات الصعودية القوية وتجنب الدخول في صفقات عند تشبع السوق أو تراجع القوة النسبية.
تضيف طبقة أمان بمنع الدخول في صفقات متتالية دون تأكيد انعكاس قوي في RSI.

smart-trading-circle 1.3es un indicador tendencial, utiliza estructura y retrocesos para confirmar sus entradas. La mejor utilizacion del mismo es a partir de timeframes a partir de 1h-2h-3h-4h

Advanced Options Signals This advanced TradingView indicator is designed to generate precise buy signals for options trading by combining a broad array of technical tools into one cohesive script. It leverages custom VWAP calculations, multi-timeframe EMAs, RSI, MACD, a custom ADX, Bollinger Bands, and a Z-score filter of the price-VWAP difference to produce robust signals for call and put options.
Key Features:
Custom VWAP Calculation:
Offers the flexibility to use either an anchored VWAP (with a user-defined start time) or a session/daily reset VWAP, ensuring that the reference price adapts to different market conditions.
Multi-Timeframe Trend Confirmation:
Utilizes EMAs from higher timeframes (60-minute and 240-minute charts) to confirm the primary trend, thereby filtering out noise and improving signal accuracy.
Comprehensive Technical Filtering:
Integrates RSI, MACD, a custom ADX (calculated using the directional movement system), Bollinger Bands, and a Z-score filter. This multi-indicator approach refines entry signals and helps reduce false triggers.
Dynamic Risk Management:
Includes ATR-based stop loss suggestions and dynamically generated take profit levels at 25%, 50%, 75%, and 100% targets—ideal for options trading where partial exits can be advantageous.
Targeted Adjustments for NVDA and TSLA:
Recognizing that NVDA and TSLA are high-volatility, high-volume stocks, the script automatically adjusts key parameters (such as the ATR multiplier, ADX threshold, and Z-score thresholds) when it detects these tickers. This fine-tuning improves precision on these popular tech stocks while maintaining full configurability for use on other instruments.
Usage:
While this script is optimized for NVDA and TSLA, it remains fully adaptable for any stock or instrument. Simply adjust the input parameters (such as the periods for technical indicators or the multipliers for volatility filters) to suit the behavior of your target asset. Backtest across different timeframes to ensure it fits your trading style.
Alerts:
Alerts are built in for both call and put signals so you can set notifications for timely trade execution.
Disclaimer: This script is for educational and informational purposes only and should not be construed as financial advice. Trading involves risk, and past performance is not indicative of future results. Use at your own risk.

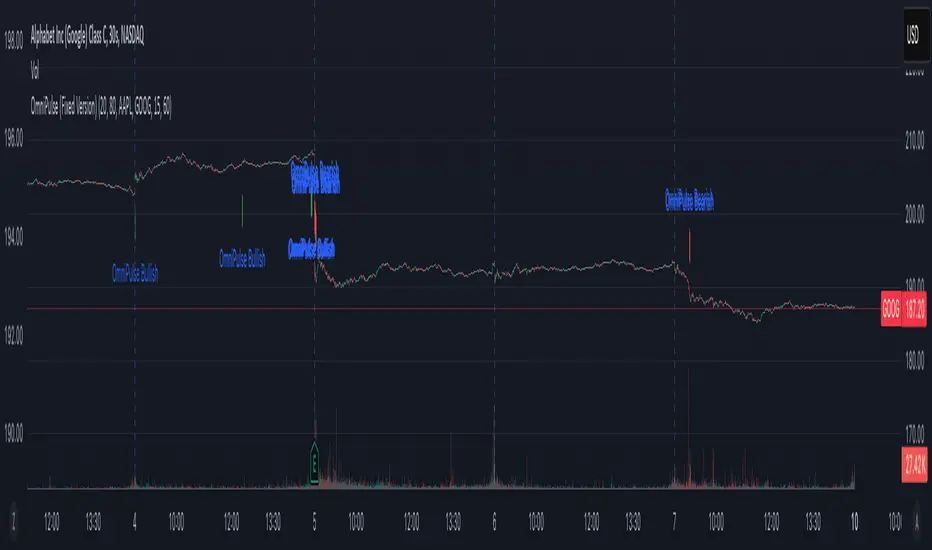
OmniPulse (Fixed Version)OmniPulse (Fixed Version) – Description
OmniPulse is a multi-indicator framework designed to combine three core oscillators—RSI, Stochastic, and Momentum—at various lookback lengths, then refine their signals using placeholder features such as machine learning forecasting, adaptive cycle detection, and neural network filtering. While some of these advanced features are not natively supported in Pine Script, they are represented here in simplified forms to illustrate how a more sophisticated system could be structured.
Key Components:
Multi-Length Oscillator Arrays
RSI (calcrsi() function)
Stochastic (placeholder via ta.sma() on a typical price average)
Momentum (ta.roc())
These are calculated for multiple lengths defined by the rsiLengths, stochLengths, and momentumLengths arrays.
Dual-Threshold Convergence
Compares each oscillator’s value to user-defined upper/lower thresholds (threshold1, threshold2) to identify bullish or bearish conditions.
Summarizes results in a convergence score.
Placeholder Machine Learning Forecast
Demonstrates a simple averaging of oscillator values as a “forecast” when toggled on.
Adaptive Cycle Detection (Placeholder)
Introduces a static cycle period (e.g., 20.0) as a placeholder for more advanced transforms.
Neural Network Filter (Placeholder)
Averages convergence, forecast, and cyclePeriod into a single filteredSignal.
Signal Plotting
Plots the filtered signal on the chart.
Highlights potential bullish or bearish extremes with shape markers based on percentile thresholds.
Practical Use & Extension:
Real Multi-Timeframe Analysis: Replace placeholders with request.security() for each timeframe.
Advanced Forecasting: Incorporate custom or external machine learning models.
Genuine Cycle Detection: Implement more sophisticated logic or user-defined cycle detection tools.
Neural Network Heuristics: Expand the placeholder step into a deeper filtering or weighting system.
Overall, OmniPulse serves as an adaptable blueprint for traders and developers, showcasing how multiple indicators and advanced concepts might be combined into a cohesive, signal-generating framework.
Engulfing + RSI + EMA
SMA50 → Per confermare il trend principale
EMA50 → Per segnali più reattivi
→ Identifica inversioni su SMA50
RSI + EMA con Segnale → Aggiunge un filtro di

Vertical Lines & MACD High/Low amThis indicator tracks the MACD phase changes and identifies the highest and lowest prices within each phase. It updates the highest and lowest values for each MACD phase and displays labels directly on the candlesticks at those price points. Whenever the MACD crosses over or under the signal line, it marks the end of the previous phase and the beginning of a new one. The labels show the high and low prices as "🔺" for the peak and "🔻" for the trough. This process occurs continuously across the entire 1-minute chart.ammmmmmmmmmm

Power of Stocks with RSI and ATR Dynamic SL updated via DeepSeekPower of Stocks with RSI and ATR Dynamic SL updated via DeepSeek, with the alert candle is yellow coloured with better visibility.

CYP STRUCTURE AND RANGEOverview:
CYP STRUCTURE AND RANGE is an innovative indicator that uniquely combines market structure analysis with dynamic range detection. This tool is designed to help traders visualize key swing pivots and consolidation zones, enabling a multi-dimensional view of price action. By marking both significant swing highs/lows and the evolving range boundaries, the indicator aids in identifying potential breakouts, reversals, and critical support/resistance areas.
Originality and Concept:
Integrated Approach:
The indicator integrates two powerful ideas:
Market Structure Detection: It identifies both major swing pivots and finer internal structure levels to provide insight into trend changes and momentum shifts.
Dynamic Range Identification: It calculates and displays the upper and lower boundaries of price consolidation zones, with an optional midline for added context.
Influence and Innovation:
While the script draws upon concepts from the LuxAlgo Smart Money Concepts indicator and Lazy Bear's Ranges Identifier, it represents an original synthesis of these ideas. By merging these proven approaches, the indicator refines and extends the underlying concepts—offering enhanced clarity and customization that stand apart from its inspirations. This mashup is not just a replication but an evolution designed to add unique value to TradingView users.
Key Features and Benefits:
Adaptive Swing Structure:
Automatically detects significant swing highs and lows as well as internal pivots.
Provides clear labeling (e.g., HH, LH, HL, LL) that can help in spotting trend reversals or continuations.
Dynamic Range Visualization:
Plots upper and lower range boundaries based on recent price action.
Offers an optional midline to highlight the central price area during consolidation.
Includes the option to connect range levels and fill the consolidation area with color for easy visual reference.
Customizable Settings:
Choose between historical or present mode for structure display.
Customize color themes (colored or monochrome) and candle coloring based on trend.
Adjustable swing lengths and range connectivity settings let you fine-tune the indicator for different timeframes (e.g., on a 4H chart, a maximum swing length of 35 provides a focused view over approximately 6 days of price action).
How This Indicator Is Useful:
Enhanced Decision-Making:
The combined view of market structure and range consolidation helps traders pinpoint actionable levels, making it easier to plan entries, exits, and manage risk.
Versatility:
Whether you’re a scalper, day trader, or swing trader, the flexibility and adaptability of this tool make it suitable for a variety of trading styles and timeframes.
Visual Clarity:
With clearly defined swing points and consolidation zones, the indicator simplifies complex market dynamics, enabling a quick assessment of the prevailing price action.
Conclusion:
CYP STRUCTURE AND RANGE is an original and useful tool that bridges the gap between traditional swing analysis and range-based methods. It leverages insights from renowned concepts like LuxAlgo Smart Money and Lazy Bear's Ranges Identifier, combining them into a refined, user-friendly package. This synthesis not only preserves the strengths of its inspirations but also introduces unique enhancements that contribute to a more precise and adaptable trading analysis framework.

MACD Scalping Strategy (30m & 1m)Long/short scalping strategy
use the 30m MACD to understand trend and 1m MACD crosses to scalp long/short
