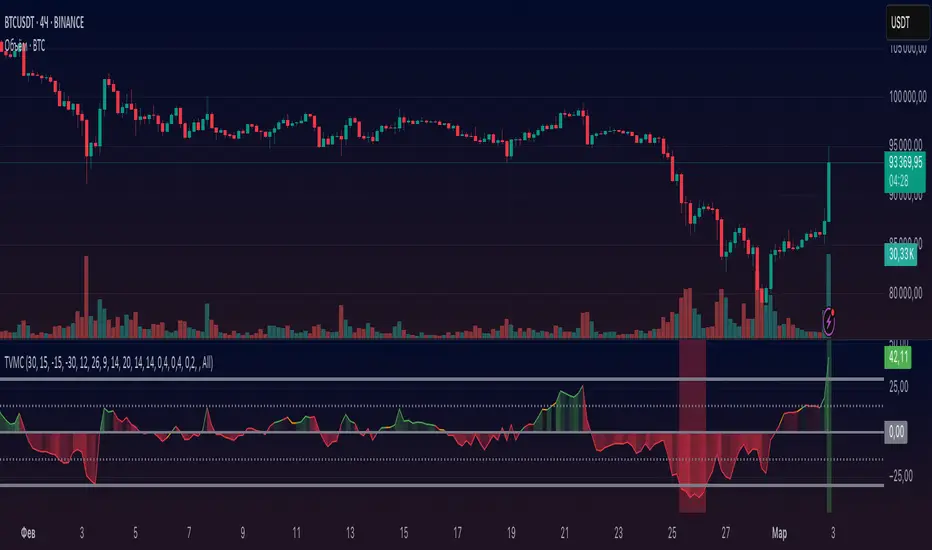
TVMC - Composite Indicator with Technical RatingsDescription:
The TVMC (Trend, Volume, Momentum, Composite) indicator is a powerful multi-component tool designed to provide traders with a comprehensive understanding of market conditions. By combining four essential technical analysis components—trend, momentum, volume, and volatility—this indicator offers clear and actionable insights to assist in decision-making.
Key Features:
1. Trend Component (TC):
* Based on MACD (Moving Average Convergence Divergence), this component analyzes the relationship between two exponential moving averages (fast and slow) to determine the prevailing market trend.
* The MACD signal is normalized to a range of -1 to +1 for consistency and clarity.
2. Momentum Component (MC):
* Utilizes RSI (Relative Strength Index) to measure the strength and speed of price movements.
* This component highlights overbought or oversold conditions, which may indicate potential market reversals.
3. Volume Confirmation (VC):
* Compares the current trading volume to its moving average over a specified period.
* High volume relative to the average confirms the validity of the current trend.
4. Volatility Filter (VF):
* Uses ATR (Average True Range) to gauge market volatility.
* Adjusts and smooths signals to reduce noise during periods of high volatility.
5. Technical Ratings Integration:
* Incorporates TradingView’s Technical Ratings, allowing users to validate signals using moving averages, oscillators, or a combination of both.
* Users can choose their preferred source of ratings for enhanced signal confirmation.
How It Works:
The TVMC indicator combines the weighted contributions of the Trend, Momentum, and Volume components, further refined by the Volatility Filter. Each component plays a specific role:
* Trend: Identifies whether the market is bullish, bearish, or neutral.
* Momentum: Highlights the strength of price action.
* Volume: Confirms whether the current price action is supported by sufficient trading activity.
* Volatility: Filters out excessive noise in volatile market conditions, providing a smoother and more reliable output.
Visualization:
1. Bullish Signals:
* The indicator line turns green and remains above the zero line, indicating upward momentum.
2. Bearish Signals:
* The indicator line turns red and falls below the zero line, signaling downward momentum.
3. Neutral Signals:
* The line is orange and stays near zero, indicating a lack of strong trend or momentum.
4. Zones:
* Horizontal lines at +30 and -30 mark strong bullish and bearish zones, respectively.
* A zero line is included for clear separation between bullish and bearish signals.
Recommended Usage:
* Best Timeframes: The indicator is optimized for higher timeframes such as 4-hour (H4) and daily (D1) charts.
* Trading Style: Suitable for swing and positional trading.
* Customization: The indicator allows users to adjust all major parameters (e.g., MACD, RSI, volume, and ATR settings) to fit their trading preferences.
Customization Options:
* Adjustable weights for Trend, Momentum, and Volume components.
* Fully configurable settings for MACD, RSI, Volume SMA, and ATR periods.
* Timeframe selection for multi-timeframe analysis.
Important Notes:
1. Originality: The TVMC indicator combines multiple analysis methods into a unique framework. It does not replicate or minimally modify existing indicators.
2. Transparency: The description is detailed enough for users to understand the methodology without requiring access to the code.
3. Clarity: The indicator is explained in a way that is accessible even to users unfamiliar with complex technical analysis tools.
Compliance with TradingView Rules:
* The indicator is written in Pine Script version 5, adhering to TradingView’s language standards.
* The description is written in English to ensure accessibility to the global community, with a clear explanation of all components and functionality.
* No promotional content, links, or unrelated references are included.
* The chart accompanying the indicator is clean and demonstrates its intended use clearly, with no additional indicators unless explicitly explained.
Centered Oscillators
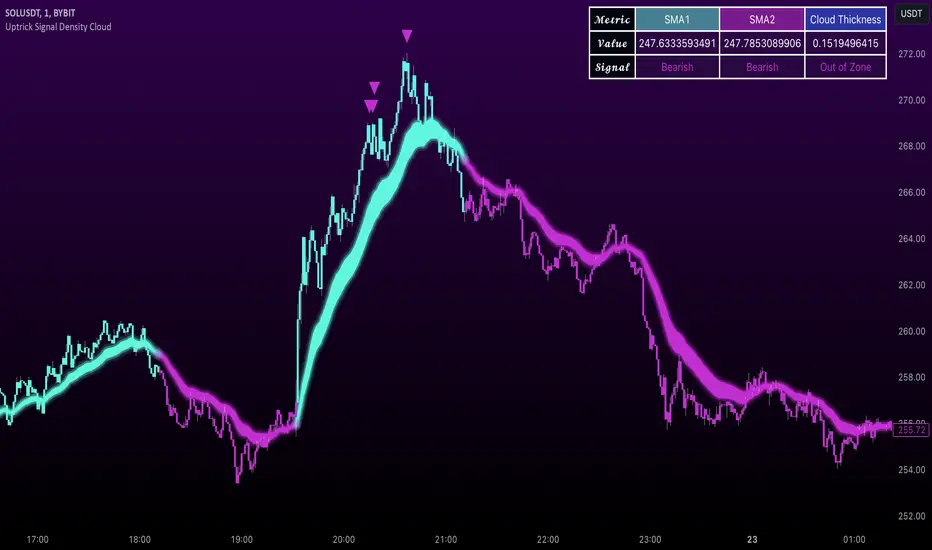
Uptrick Signal Density Cloud🟪 Introduction
The Uptrick Signal Density Cloud is designed to track market direction and highlight potential reversals or shifts in momentum. It plots two smoothed lines on the chart and fills the space between them (often called a “cloud”). The bars on the chart change color depending on bullish or bearish conditions, and small triangles appear when certain reversal criteria are met. A metrics table displays real-time values for easy reference.
🟩 Why These Features Have Been Linked Together
1) Dual-Line Structure
Two separate lines represent shorter- and longer-term market tendencies. Linking them in one tool allows traders to view both near-term changes and the broader directional bias in a single glance.
2) Smoothed Averages
The script offers multiple smoothing methods—exponential, simple, hull, and an optimized approach—to reduce noise. Using more than one type of moving average can help balance responsiveness with stability.
3) Density Cloud Concept
Shading the region between the two lines highlights the gap or “thickness.” A wider gap typically signals stronger momentum, while a narrower gap could indicate a weakening trend or potential market indecision. When the cloud is too wide and crosses a certain threshold defined by the user, it indicates a possible reversal. When the cloud is too narrow it may indicate a potential breakout.
🟪 Why Use This Indicator
• Trend Visibility: The color-coded lines and bars make it easier to distinguish bullish from bearish conditions.
• Momentum Tracking: Thicker cloud regions suggest stronger separation between the faster and slower lines, potentially indicating robust momentum.
• Possible Reversal Alerts: Small triangles appear within thick zones when the indicator detects a crossover, drawing attention to key moments of potential trend change.
• Quick Reference Table: A metrics table shows line values, bullish or bearish status, and cloud thickness without needing to hover over chart elements.
🟩 Inputs
1) First Smoothing Length (length1)
Default: 14
Defines the lookback period for the faster line. Lower values make the line respond more quickly to price changes.
2) Second Smoothing Length (length2)
Default: 28
Defines the lookback period for the slower line or one of the moving averages in optimized mode. It generally responds more slowly than the faster line.
3) Extra Smoothing Length (extraLength)
Default: 50
A medium-term period commonly seen in technical analysis. In optimized mode, it helps add broader perspective to the combined lines.
4) Source (source)
Default: close
Specifies the price data (for example, open, high, low, or a custom source) used in the calculations.
5) Cloud Type (cloudType)
Options: Optimized, EMA, SMA, HMA
Determines the smoothing method used for the lines. “Optimized” blends multiple exponential averages at different lengths.
6) Cloud Thickness Threshold (thicknessThreshold)
Default: 0.5
Sets the minimum separation between the two lines to qualify as a “thick” zone, indicating potentially stronger momentum.
🟪 Core Components
1) Faster and Slower Lines
Each line is smoothed according to user preferences or the optimized technique. The faster line typically reacts more quickly, while the slower line provides a broader overview.
2) Filled Density Cloud
The space between the two lines is filled to visualize in which direction the market is trending.
3) Color-Coded Bars
Price bars adopt bullish or bearish colors based on which line is on top, providing an immediate sense of trend direction.
4) Reversal Triangles
When the cloud is thick (exceeding the threshold) and the lines cross in the opposite direction, small triangles appear, signaling a possible market shift.
5) Metrics Table
A compact table shows the current values of both lines, their bullish/bearish statuses, the cloud thickness, and whether the cloud is in a “reversal zone.”
🟩 Calculation Process
1) Raw Averages
Depending on the mode, standard exponential, simple, hull, or “optimized” exponential blends are calculated.
2) Optimized Averages (if selected)
The faster line is the average of three exponential moving averages using length1, length2, and extraLength.
The slower line similarly uses those same lengths multiplied by 1.5, then averages them together for broader smoothing.
3) Difference and Threshold
The absolute gap between the two lines is measured. When it exceeds thicknessThreshold, the cloud is considered thick.
4) Bullish or Bearish Determination
If sma1 (the faster line) is above sma2 (the slower line), conditions are deemed bullish; otherwise, they are bearish. This distinction is reflected in both bar colors and cloud shading.
5) Reversal Markers
In thick zones, a crossover triggers a triangle at the point of potential reversal, alerting traders to a possible trend change.
🟪 Smoothing Methods
1) Exponential (EMA)
Prioritizes recent data for quicker responsiveness.
2) Simple (SMA)
Takes a straightforward average of the chosen period, smoothing price action but often lagging more in volatile markets.
3) Hull (HMA)
Employs a specialized formula to reduce lag while maintaining smoothness.
4) Optimized (Blended Exponential)
Combines multiple EMA calculations to strike a balance between responsiveness and noise reduction.
🟩 Cloud Logic and Reversal Zones
Cloud thickness above the defined threshold typically signals exceeding momentum and can lead to a quick reversal. During these thick periods, if the width exceeds the defined threshold, small triangles mark potential reversal points. In order for the reversal shape to show, the color of the cloud has to be the opposite. So, for example, if the cloud is bearish, and exceeds momentum, defined by the user, a bullish signal appears. The opposite conditions for a bullish signal. This approach can help traders focus on notable changes rather than minor oscillations.
🟪 Bar Coloring and Layered Lines
Bars take on bullish or bearish tints, matching the faster line’s position relative to the slower line. The lines themselves are plotted multiple times with varying opacities, creating a layered, glowing look that enhances visibility without affecting calculations.
🟩 The Metrics Table
Located in the top-right corner of the chart, this table displays:
• SMA1 and SMA2 current values.
• Bullish or bearish alignment for each line.
• Cloud thickness.
• Reversal zone status (in or out of zone).
This numeric readout allows for a quick data check without hovering over the chart.
🟪 Why These Specific Moving Average Lengths Are Used
Default lengths of 14, 28, and 50 are common in technical analysis. Fourteen captures near-term price movement without overreacting. Twenty-eight, roughly double 14, provides a moderate smoothing level. Fifty is widely regarded as a medium-term benchmark. Multiplying each length by 1.5 for the slower line enhances separation when combined with the faster line.
🟩 Originality and Usefulness
• Multi-Layered Smoothing. The user can select from several moving average modes, including a unique “optimized” blend, possibly reducing random fluctuations in the market data.
• Combined Visual and Numeric Clarity. Bars, clouds, and a real-time table merge into a single interface, enabling efficient trend analysis.
• Focus on Significant Shifts. Thick cloud zones and triangles draw attention to potentially stronger momentum changes and plausible reversals.
• Flexible Across Markets. The adjustable lengths and threshold can be tuned to different asset classes (stocks, forex, commodities, crypto) and timeframes.
By integrating multiple technical concepts—cloud-based trend detection, color coding, reversal markers, and an immediate reference table—the Uptrick Signal Density Cloud aims to streamline chart reading and decision-making.
🟪 Additional Considerations
• Timeframes. Intraday, daily, and weekly charts each yield different signals. Adjust the smoothing lengths and threshold to suit specific trading horizons.
• Market Types. Though applicable across asset classes, parameters might need tweaking to address the volatility of commodities, forex pairs, or cryptocurrencies.
• Confirmation Tools. Pairing this indicator with volume studies or support/resistance analysis can improve the reliability of signals.
• Potential Limitations. No indicator is foolproof; sudden market shifts or choppy conditions may reduce accuracy. Cautious position sizing and risk management remain essential.
🟩 Disclaimers
The Uptrick Signal Density Cloud relies on historical price data and may lag sudden moves or provide false positives in ranging conditions. Always combine it with other analytical techniques and sound risk management. This script is offered for educational purposes only and should not be considered financial advice.
🟪 Conclusion
The Uptrick Signal Density Cloud blends trend identification, momentum assessment, and potential reversal alerts in a single, user-friendly tool. With customizable smoothing methods and a focus on cloud thickness, it visually highlights important market conditions. While it cannot guarantee predictive accuracy, it can serve as a comprehensive reference for traders seeking both a quick snapshot of the current trend and deeper insights into market dynamics.
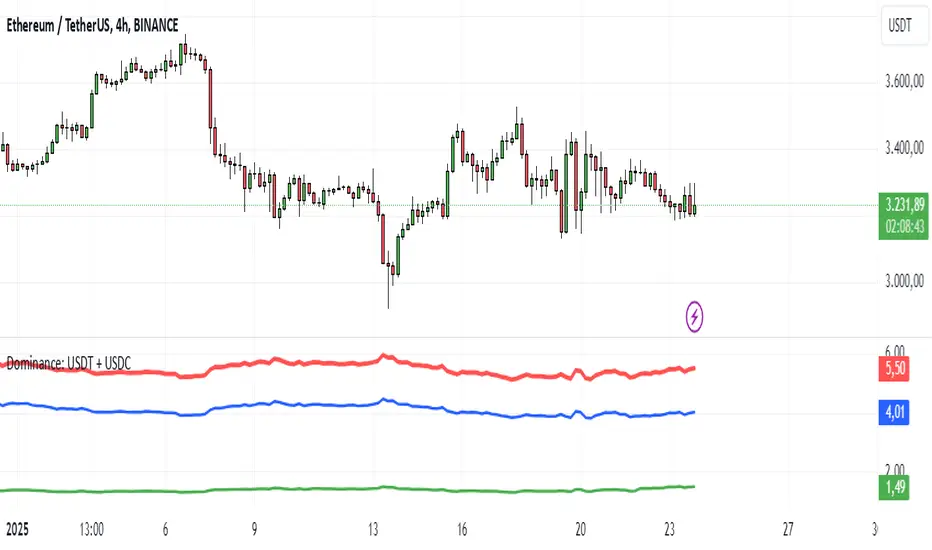
Dominance: USDT + USDCThis script combines the dominance of USDT and USDC, the two largest stablecoins in the market, to provide a clear and accurate view of their impact on the total cryptocurrency market cap.
Key Features:
- Individual Dominance: Displays the percentage dominance of USDT and USDC separately.
- Combined Dominance: Shows a line combining the dominance of both stablecoins to understand their total market influence.
- Real-Time Accuracy: Updates values based on the latest TradingView data.
- Visual Clarity: Unique colors for each line for easy interpretation:
- Blue: USDT Dominance.
- Green: USDC Dominance.
- Red: Total Combined Dominance.
Benefits:
- Strategic Analysis: Evaluate how stablecoins influence capital flow in the crypto market.
- Identify Trends: Understand growth or decline in dominance to detect market direction changes.
- Informed Decisions: Ideal for traders analyzing the relationship between stablecoins and overall market movements.
How to Use:
- Add the script to your chart and monitor the dominance lines.
- Use the insights to support your trading strategy.
Note: This script does not provide buy or sell signals. It is intended for informational and analytical purposes.
RSI MACD Combined Color StrategyOverview
This indicator combines RSI and MACD signals to create a powerful visual trading system, inspired by TrendSpider's AI Strategy Coder examples. It colors candles based on the alignment of three key technical conditions, providing clear visual signals for potential trend strength and direction.
Technical Components
Core Conditions
RSI (Relative Strength Index) > 50
Indicates bullish momentum when price is trading above the centerline
Traditional indicator of trend strength
MACD Line > Signal Line
Shows positive momentum
Classic signal for potential upward movement
MACD Line > 0
Confirms bullish territory
Indicates overall positive momentum
Color Coding System
🟢 Green Candles: All three conditions are met
Strongest bullish signal
Suggests high probability trading opportunities
⚪ Grey Candles: One or two conditions are met
Neutral or transitioning market
Suggests caution or waiting for stronger confirmation
🔴 Red Candles: No conditions are met
Bearish signal
Suggests potential downward pressure
How to Use This Indicator
For Entry Signals
Look for transitions from red or grey to green candles
Green candles suggest strong bullish alignment
Consider entering long positions when candles turn green
For Exit Signals
Watch for color transitions from green to grey or red
Consider taking profits when candles change from green to grey
Consider stop losses when candles turn red
Risk Management
Use color transitions as part of your broader strategy
Don't rely solely on color changes for trading decisions
Combine with other technical analysis tools and risk management practices
Customizable Parameters
RSI Length (default: 14)
MACD Fast Length (default: 12)
MACD Slow Length (default: 26)
MACD Signal Length (default: 9)
Best Practices
Use multiple timeframes for confirmation
Look for confluences with support/resistance levels
Consider volume and market context
Start with default settings and adjust based on your trading style
Backtest different parameter combinations
Notes
This indicator works best in trending markets
Grey candles can indicate transition periods
Consider market conditions and volatility when interpreting signals
Credits
Inspired by TrendSpider's AI Strategy Coder examples and adapted for TradingView using Pine Script v5.
Disclaimer
This technical indicator is for informational purposes only. Always conduct your own analysis and consider risk management principles before making trading decisions. Past performance does not guarantee future results.
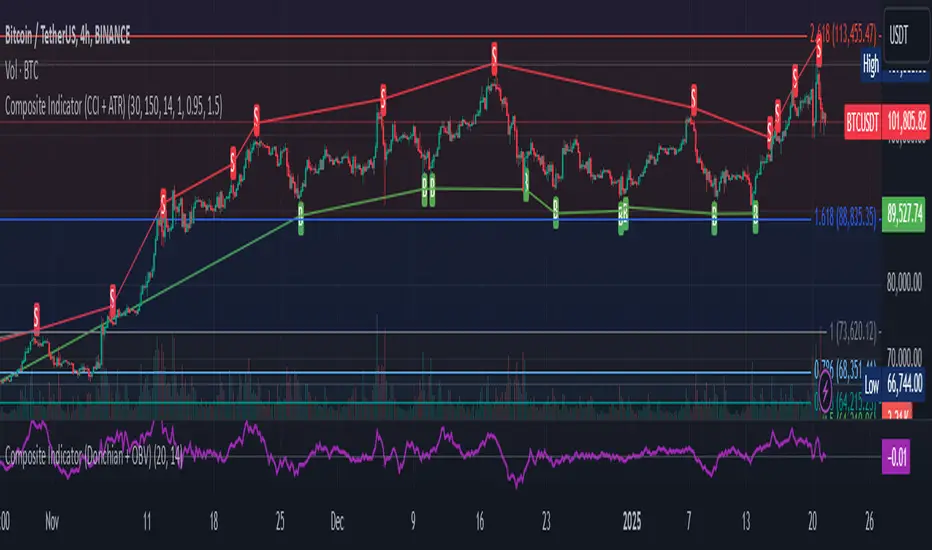
Composite Indicator (CCI + ATR)Composite Indicator (CCI + ATR)
The Composite Indicator (CCI + ATR) combines the Commodity Channel Index (CCI) with the Average True Range (ATR) , providing traders with a dynamic tool for identifying entry and exit points based on momentum and volatility. This indicator is particularly useful for markets like cryptocurrencies, which often exhibit sharp sell-offs and gradual upward trends.
Key Features
Momentum Analysis with CCI: The CCI calculates price momentum by comparing the current price level to its average over a specific period. The indicator generates signals when CCI crosses predefined thresholds.
- Buy Signal: Triggered when CCI crosses above the lower threshold (e.g., -100).
- Sell Signal: Triggered when CCI crosses below the upper threshold (e.g., +100).
Volatility Filtering with ATR: The ATR measures market volatility, ensuring signals occur only during significant price movements.
Separate multipliers for buy and sell signals allow tailored filtering based on market behavior.
Stop Loss Calculation: Dynamic stop loss levels are calculated using the ATR multiplier to adapt to market volatility, offering better risk management.
How It Works
CCI Calculation: The CCI is calculated using the typical price ((High + Low + Close) / 3) and a user-defined length. It detects momentum changes by measuring deviations from the average price.
ATR Calculation: The ATR determines the average price range over a specified period, identifying the market’s volatility. The ATR SMA acts as a baseline to filter signals.
Buy Signal: A buy signal is triggered when:
- CCI crosses above the lower threshold (e.g., -100).
- ATR exceeds its SMA multiplied by the buy multiplier (e.g., 1.0).
Sell Signal: A sell signal is triggered when:
- CCI crosses below the upper threshold (e.g., +100).
- ATR exceeds its SMA multiplied by the sell multiplier (e.g., 0.95).
Stop Loss Integration:
- Long positions: Stop loss = Low – (ATR * ATR Multiplier)
- Short positions: Stop loss = High + (ATR * ATR Multiplier)
Advantages
Combines momentum (CCI) and volatility (ATR) for precise signal generation.
Customizable thresholds and multipliers for different market conditions.
Dynamic stop loss ensures better risk management in volatile markets.
Suggested Parameter Settings
CCI Length: 20 (default). Adjust as follows:
- 10–15: Shorter timeframes (e.g., 5-15 minutes).
- 20: General use for 1-hour timeframes.
- 30–50: Longer timeframes (e.g., 4-hour or daily charts).
CCI Threshold: 100 (default). Adjust as follows:
- 50–75: For more frequent signals in ranging markets.
- 100: Balanced for most trading conditions.
- 150–200: For strong trends to reduce noise.
ATR Length: 14 (default). Adjust as follows:
- 10–14: For assets with moderate volatility.
- 20: For assets with lower volatility.
ATR Buy Multiplier: 1.0 (default). Adjust as follows:
- 0.9–1.0: For gradual uptrends in crypto markets.
- 1.1–1.2: For stronger trend filtering.
ATR Sell Multiplier: 0.95 (default). Adjust as follows:
- 0.8–0.95: For sharp sell-offs.
- 1.0–1.1: For stable downward trends.
ATR Multiplier (Stop Loss): 1.5 (default). Adjust as follows:
- 1.0–1.2: For shorter timeframes or less volatile markets.
- 2.0–2.5: For highly volatile markets like cryptocurrencies.
Example Use Cases
Scalping (5-15 minute charts): Use CCI Length = 10, CCI Threshold = 75, ATR Buy Multiplier = 0.9, ATR Sell Multiplier = 0.8.
Day Trading (1-hour charts): Use CCI Length = 20, CCI Threshold = 100, ATR Buy Multiplier = 1.0, ATR Sell Multiplier = 0.95.
Swing Trading (4-hour or daily charts): Use CCI Length = 30, CCI Threshold = 150, ATR Buy Multiplier = 1.2, ATR Sell Multiplier = 1.0.
Final Thoughts The Composite Indicator (CCI + ATR) is a versatile tool designed to enhance trading decisions by combining momentum analysis with volatility filtering. Whether scalping or swing trading, this indicator provides actionable insights and robust risk management to navigate complex markets effectively.
MCDX_SignalThe MCDX indicator (Market Cycle Dynamic Index) is a technical indicator developed by Trung Pham. It is a tool used for analyzing the stock market, often utilized to identify big money flow (Big Money) and evaluate the strength of individual stocks or the overall market.
MCDX is known for its distinctive histogram chart with red and green bars. The red bars typically represent the inflow of big money, while the green bars indicate small money flow or outflows.

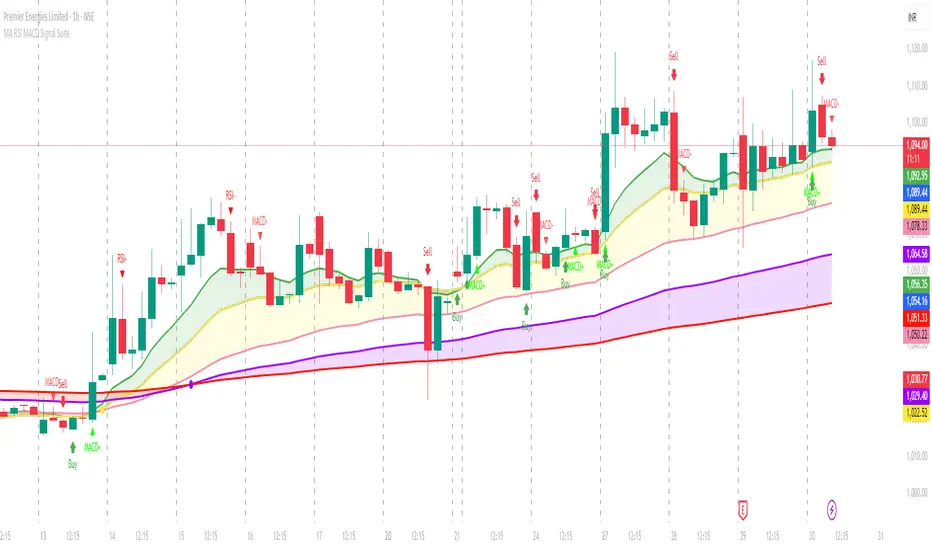
MA RSI MACD Signal SuiteThis Pine Script™ is designed for use in Trading View and generates trading signals based on moving average (MA) crossovers, RSI (Relative Strength Index) signals, and MACD (Moving Average Convergence Divergence) indicators. It provides visual markers on the chart and can be configured to suit various trading strategies.
1. Indicator Overview
The indicator includes signals for:
Moving Averages (MA): It tracks crossovers between different types of moving averages.
RSI: Signals based on RSI crossing certain levels or its signal line.
MACD: Buy and sell signals generated by MACD crossovers.
2. Inputs and Customization
Moving Averages (MAs):
You can customize up to 6 moving averages with different types, lengths, and colors.
MA Type: Choose from different types of moving averages:
SMA (Simple Moving Average)
EMA (Exponential Moving Average)
HMA (Hull Moving Average)
SMMA (RMA) (Smoothed Moving Average)
WMA (Weighted Moving Average)
VWMA (Volume Weighted Moving Average)
T3, DEMA, TEMA
Source: Select the price to base the MA on (e.g., close, open, high, low).
Length: Define the number of periods for each moving average.
Examples:
MA1: Exponential Moving Average (EMA) with a period of 9
MA2: Exponential Moving Average (EMA) with a period of 21
RSI Settings:
RSI is calculated based on a user-defined period and is used to identify potential overbought or oversold conditions.
RSI Length: Lookback period for RSI (default 14).
Overbought Level: Defines the overbought threshold for RSI (default 70).
Oversold Level: Defines the oversold threshold for RSI (default 30).
You can also adjust the smoothing for the RSI signal line and customize when to trigger buy and sell signals based on the RSI crossing these levels.
MACD Settings:
MACD is used for identifying changes in momentum and trends.
Fast Length: The period for the fast moving average (default 12).
Slow Length: The period for the slow moving average (default 26).
Signal Length: The period for the signal line (default 9).
Smoothing Method: Choose between SMA or EMA for both the MACD and the signal line.
3. Signal Logic
Moving Average (MA) Crossover Signals:
Crossover: A bullish signal is generated when a fast MA crosses above a slow MA.
Crossunder: A bearish signal is generated when a fast MA crosses below a slow MA.
The crossovers are plotted with distinct colors, and the chart will display markers for these crossover events.
RSI Signals:
Oversold Crossover: A bullish signal when RSI crosses over its signal line below the oversold level (30).
Overbought Crossunder: A bearish signal when RSI crosses under its signal line above the overbought level (70).
RSI signals are divided into:
Aggressive (Early) Entries: Signals when RSI is crossing the oversold/overbought levels.
Conservative Entries: Signals when RSI confirms a reversal after crossing these levels.
MACD Signals:
Buy Signal: Generated when the MACD line crosses above the signal line (bullish crossover).
Sell Signal: Generated when the MACD line crosses below the signal line (bearish crossunder).
Additionally, the MACD histogram is used to identify momentum shifts:
Rising to Falling Histogram: Alerts when the MACD histogram switches from rising to falling.
Falling to Rising Histogram: Alerts when the MACD histogram switches from falling to rising.
4. Visuals and Alerts
Plotting:
The script plots the following on the price chart:
Moving Averages (MA): The selected MAs are plotted as lines.
Buy/Sell Shapes: Triangular markers are displayed for buy and sell signals generated by RSI and MACD.
Crossover and Crossunder Markers: Crosses are shown when two MAs crossover or crossunder.
Alerts:
Alerts can be configured based on the following conditions:
RSI Signals: Alerts for oversold or overbought crossover and crossunder events.
MACD Signals: Alerts for MACD line crossovers or momentum shifts in the MACD histogram.
Alerts are triggered when specific conditions are met, such as:
RSI crosses over or under the oversold/overbought levels.
MACD crosses the signal line.
Changes in the MACD histogram.
5. Example Usage
1. Trend Reversal Setup:
Buy Signal: Use the RSI oversold crossover and MACD bullish crossover to identify potential entry points in a downtrend.
Sell Signal: Use the RSI overbought crossunder and MACD bearish crossunder to identify potential exit points or short entries in an uptrend.
2. Momentum Strategy:
Combine MACD and RSI signals to identify the strength of a trend. Use MACD histogram analysis and RSI levels for confirmation.
3. Moving Average Crossover Strategy:
Focus on specific MA crossovers, such as the 9-period EMA crossing above the 21-period EMA, for buy signals. When a longer-term MA (e.g., 50-period) crosses a shorter-term MA, it may indicate a strong trend change.
6. Alerts Conditions
The script includes several alert conditions, which can be triggered and customized based on the user’s preferences:
RSI Oversold Crossover: Alerts when RSI crosses over the signal line below the oversold level (30).
RSI Overbought Crossunder: Alerts when RSI crosses under the signal line above the overbought level (70).
MACD Buy/Sell Crossover: Alerts when the MACD line crosses the signal line for a buy or sell signal.
7. Conclusion
This script is highly customizable and can be adjusted to suit different trading strategies. By combining MAs, RSI, and MACD, traders can gain multiple perspectives on the market, enhancing their ability to identify potential buy and sell opportunities.
Dynamic S/R Levels: Edge FinderOverview
The Dynamic S/R Levels: Edge Finder indicator is designed to identify dynamic support and resistance levels based on historical price action. It uses a combination of price extremes (highs and lows) over user-defined lookback periods, weighted moving averages (WMAs), and touch-count analysis to provide actionable insights into key market levels.
This tool is ideal for traders who want to:
Identify dynamic support and resistance zones.
Understand the strength of these levels based on price touches.
Make informed decisions using clear, adaptive levels.
How It Works
Dynamic Levels Calculation:
The indicator calculates dynamic support levels using the lowest lows and dynamic resistance levels using the highest highs over user-defined lookback periods (e.g., 20, 40, 60 bars, etc.).
These levels are updated dynamically as new price data becomes available.
Touch Count Analysis:
The indicator counts how many times the price has touched or come close to each support/resistance level within the lookback period.
Levels with more touches are considered stronger and are highlighted accordingly.
Weighted Moving Averages (WMAs):
The indicator uses 50-period and 100-period WMAs to identify the closest support/resistance levels to the current trend.
Levels near these WMAs are given additional weight, as they are more likely to act as significant barriers.
Level Merging:
If two support or resistance levels are too close to each other (based on the minimum distance percentage), the weaker level (with fewer touches) is removed to avoid clutter.
Visualization:
Support levels are displayed as dashed red lines, and resistance levels are displayed as dashed blue lines.
Each level is labeled with its corresponding touch count, allowing traders to quickly assess its strength.
How to Interpret the Indicator
Strong Support/Resistance Levels:
Levels with higher touch counts (e.g., 5, 10, or more) are considered stronger and are more likely to hold in the future.
Use these levels to plan entries, exits, or stop-loss placements.
Proximity to WMAs:
Levels closest to the 50-period or 100-period WMA are more significant, especially in trending markets.
These levels often act as dynamic barriers where price reactions are more likely.
Breakouts and Rejections:
If the price breaks through a strong resistance level, it may indicate a potential bullish trend.
If the price rejects a strong support level, it may indicate a potential bearish trend.
Always confirm breakouts or rejections with additional analysis (e.g., volume, candlestick patterns).
Level Merging:
Merged levels indicate areas of high confluence, where multiple support/resistance zones overlap.
These areas are particularly important for decision-making, as they represent stronger market reactions.
Key Features
Customizable Lookback Periods: Adjust the lookback periods for each dynamic level to suit your trading style.
Touch Count Labels: Quickly identify the strength of each level based on the number of price touches.
Adaptive Levels: The indicator dynamically updates levels based on recent price action.
Clean Visualization: Levels are automatically merged to avoid clutter and provide a clear view of the market structure.
Usage Tips
Trend Identification: Combine the indicator with trend-following tools (e.g., moving averages, trendlines) to confirm the overall market direction.
Risk Management: Use the identified levels to set stop-loss orders or take-profit targets.
Timeframe Flexibility: The indicator works on all timeframes, but it is particularly effective on higher timeframes (e.g., 1H, 4H, Daily) for more reliable levels.
Example Scenarios
Bounce Trade:
If the price approaches a strong support level (high touch count) and shows signs of rejection (e.g., bullish candlestick patterns), consider a long position with a stop-loss below the support level.
Breakout Trade:
If the price breaks above a strong resistance level with high volume, consider a long position with a target at the next resistance level.
Range-Bound Market:
In a sideways market, use the support and resistance levels to identify range boundaries and trade bounces between them.
Disclaimer
Dynamic S/R Levels: Edge Finder is a technical analysis tool designed to identify dynamic support and resistance levels based on historical price action. It is intended for informational and educational purposes only. This indicator does not provide financial, investment, or trading advice. Users are solely responsible for their trading decisions and should conduct their own research and analysis before making any trades. The developer of this tool is not liable for any financial losses or damages resulting from the use of this indicator. Trading in financial markets involves risk, and you should only trade with capital you can afford to lose.

VWMACD-MFI-OBV Composite# MACD-MFI-OBV Composite
A dynamic volume-based technical indicator combining Volume-Weighted MACD, Money Flow Index (MFI), and normalized On Balance Volume (OBV). This composite indicator excels at identifying breakouts and strong trend movements through multiple volume confirmations, making it particularly effective for momentum and high-volatility trading environments.
## Overview
The indicator integrates trend, momentum, and cumulative volume analysis into a unified visualization system. Each component is carefully normalized to enable direct comparison, while the background color system provides instant trend recognition. This version is specifically optimized for breakout detection and strong trend confirmation.
## Core Components
### Volume-Weighted MACD
Visualized through the background color system, this enhanced MACD implementation uses Volume-Weighted Moving Averages (VWMA) instead of traditional EMAs. This modification ensures greater sensitivity to volume-supported price movements while filtering out less significant low-volume price changes. The background alternates between green (bullish) and red (bearish) to provide immediate trend feedback.
### Money Flow Index (MFI)
Displayed as the purple line, the MFI functions as a volume-weighted momentum oscillator. Operating within a natural 0-100 range, it helps identify potential overbought and oversold conditions while confirming volume support for price movements. The MFI is particularly effective at validating breakout momentum.
### Normalized On Balance Volume (OBV)
The white line represents normalized OBV, providing insight into cumulative buying and selling pressure. The normalization process scales OBV to match other components while maintaining its ability to confirm price trends through volume analysis. This component excels at identifying strong breakout movements and volume surges.
## Signal Integration
The indicator generates its most powerful signals when all three components align, particularly during breakout conditions:
Strong Bullish Signals develop when:
- Background shifts to green (VWMACD bullish)
- MFI shows strong upward momentum
- OBV demonstrates sharp volume accumulation
Strong Bearish Signals emerge when:
- Background turns red (VWMACD bearish)
- MFI exhibits downward momentum
- OBV shows significant volume distribution
## Market Application
This indicator variant is specifically designed for:
Breakout Trading:
The OBV component provides excellent sensitivity to volume surges, making it ideal for breakout confirmation and momentum validation.
Trend Following:
Sharp OBV movements combined with MFI momentum help identify and confirm strong trending conditions.
High Volatility Markets:
The indicator's design excels in active, volatile markets where clear signal generation is crucial for decision-making.
## Technical Implementation
Default Parameters:
Volume-Weighted MACD maintains traditional periods (12/26/9) while leveraging volume weighting. MFI uses standard 14-period calculation with 80/20 overbought/oversold thresholds. All components undergo normalization over a 100-period lookback for stable comparison.
Visual Elements:
- Background: VWMACD trend indication (green/red)
- Purple Line: Money Flow Index
- White Line: Normalized OBV
- Yellow Line: Combined signal (arithmetic mean of normalized components)
- Reference Lines: Key levels at 20, 50, and 80
## Trading Methodology
The indicator supports a systematic approach to breakout and momentum trading:
1. Breakout Identification
Monitor for background color changes accompanied by significant OBV movement, indicating potential breakout conditions.
2. Volume Surge Confirmation
Examine OBV slope and magnitude to confirm genuine breakout scenarios versus false moves.
3. Momentum Validation
Use MFI to confirm breakout strength and identify potential exhaustion points.
4. Combined Signal Analysis
The yellow line provides a unified view of all components, helping identify high-probability breakout opportunities.
## Interpretation Guidelines
Breakout Confirmation:
Strong breakouts typically show alignment of all three components with notable OBV surge. This configuration often precedes significant price movements.
Trend Strength:
Continuous OBV expansion during trends, supported by steady MFI readings, suggests sustained momentum.
## Market Selection
Optimal Markets Include:
- High-beta growth stocks
- Momentum-driven securities
- Stocks with significant volatility
- Active trading instruments
- Examples: TSLA, NVDA, growth stocks
## Version Information
Current Version: 2.0.0
This indicator represents a specialized adaptation of volume-based analysis, optimized for breakout trading and momentum strategies in high-volatility environments.
Comprehensive RSI, MACD & Stochastic Table
RSI, MACD, and Stochastic Multi-Asset Indicator for TradingView
Introduction
The RSI, MACD, and Stochastic Multi-Asset Indicator is a comprehensive tool designed for traders who want to analyze multiple assets simultaneously while utilizing some of the most popular technical indicators. This indicator is tailored for all market types—whether you're trading cryptocurrencies, stocks, forex, or commodities—and provides a consolidated dashboard for faster and more informed decision-making.
This tool combines Relative Strength Index (RSI), Moving Average Convergence Divergence (MACD), and Stochastic Oscillator, three of the most effective momentum and trend-following indicators. It provides a visual, color-coded table for quick insights and alerts for significant buy or sell opportunities.
---
What Does This Indicator Do?
This indicator performs the following key functions:
1. Multi-Asset Analysis: Analyze two assets side by side, allowing you to monitor their momentum, trends, and overbought/oversold conditions simultaneously.
2. Combines Three Powerful Indicators:
RSI: Tracks market momentum and identifies overbought/oversold zones.
MACD: Highlights trend direction and momentum shifts.
Stochastic Oscillator: Provides insights into overbought/oversold zones with smoothing for better accuracy.
3. Color-Coded Dashboard: Displays all indicator values in an easy-to-read table with color coding for quick identification of market conditions.
4. Real-Time Alerts: Generates alerts when strong bullish or bearish conditions are met across multiple indicators.
---
Key Features
1. Customizable Inputs
You can adjust RSI periods, MACD parameters, Stochastic settings, and timeframes to suit your trading style.
Analyze default or custom assets (e.g., BTC/USDT, ETH/USDT).
2. Multi-Timeframe Support
Use this indicator on any timeframe (e.g., 1-minute, 1-hour, daily) to suit your trading strategy.
3. Comprehensive Dashboard
Displays values for RSI, MACD, and Stochastic for two assets in one clean, compact table.
Automatically highlights overbought (red), oversold (green), and neutral (gray) conditions.
4. Buy/Sell Signals
Plots buy/sell signals on the chart when all indicators align in strong bullish or bearish zones.
Example:
Strong Buy: RSI above 50, Stochastic %K above 80, and MACD histogram positive.
Strong Sell: RSI below 50, Stochastic %K below 20, and MACD histogram negative.
5. Real-Time Alerts
Alerts notify you when a strong buy or sell condition is detected, so you don't miss critical trading opportunities.
---
Who Is This Indicator For?
This indicator is perfect for:
Day Traders who need real-time insights across multiple assets.
Swing Traders who want to identify mid-term trends and momentum shifts.
Crypto, Stock, and Forex Traders looking for a consolidated tool that works across all asset classes.
---
How It Works
1. RSI (Relative Strength Index):
Tracks momentum by measuring the speed and change of price movements.
Overbought: RSI > 70 (Red).
Oversold: RSI < 30 (Green).
2. MACD (Moving Average Convergence Divergence):
Combines two exponential moving averages (EMA) to track momentum and trend direction.
Positive Histogram: Bullish momentum.
Negative Histogram: Bearish momentum.
3. Stochastic Oscillator:
Tracks price relative to its high-low range over a specific period.
Overbought: %K > 80.
Oversold: %K < 20.
4. Table View:
Displays indicator values for both assets in an intuitive table format.
Highlights critical zones with color coding.
5. Alerts:
Alerts are triggered when:
RSI, MACD, and Stochastic align in strong bullish or bearish conditions.
These conditions are based on customizable thresholds.
---
How to Use the Indicator
1. Add the Indicator to Your Chart:
After publishing, search for the indicator by its name in TradingView's Indicators tab.
2. Customize Inputs:
Adjust settings for RSI periods, MACD parameters, and Stochastic smoothing to suit your strategy.
3. Interpret the Table:
Check the table for highlighted zones (red for overbought, green for oversold).
Look for bullish or bearish signals in the "Signal" column.
4. Act on Alerts:
Use the real-time alerts to take action when strong conditions are met.
---
Example Use Cases
1. Crypto Day Trading:
Monitor BTC/USDT and ETH/USDT simultaneously for strong bullish or bearish conditions.
Receive alerts when RSI, MACD, and Stochastic align for a potential reversal.
2. Swing Trading Stocks:
Track a stock (e.g., AAPL) and its sector ETF (e.g., QQQ) to find momentum-based opportunities.
3. Forex Scalping:
Identify overbought/oversold conditions across multiple currency pairs.
---
Conclusion
The RSI, MACD, and Stochastic Multi-Asset Indicator simplifies your trading workflow by consolidating multiple technical indicators into one powerful tool. With real-time insights, color-coded visuals, and customizable alerts, this indicator is designed to help you stay ahead in any market.
Whether you're a beginner or an experienced trader, this indicator provides everything you need to make confident trading decisions. Add it to your TradingView chart today and take your analysis to the next level!
---
Make sure to leave your feedback and suggestions so I can continue improving the tool for the community. Happy trading!

Uptrick: Fisher Eclipse1. Name and Purpose
Uptrick: Fisher Eclipse is a Pine version 6 extension of the basic Fisher Transform indicator that focuses on highlighting potential turning points in price data. Its purpose is to allow traders to spot shifts in momentum, detect divergence, and adapt signals to different market environments. By combining a core Fisher Transform with additional signal processing, divergence detection, and customizable aggressiveness settings, this script aims to help users see when a price move might be losing momentum or gaining strength.
2. Overview
This script uses a Fisher Transform calculation on the average of each bar’s high and low (hl2). The Fisher Transform is designed to amplify price extremes by mapping data into a different scale, making potential reversals more visible than they might be with standard oscillators. Uptrick: Fisher Eclipse takes this concept further by integrating a signal line, divergence detection, bar coloring for momentum intensity, and optional thresholds to reduce unwanted noise.
3. Why Use the Fisher Transform
The Fisher Transform is known for converting relatively smoothed price data into a more pronounced scale. This transformation highlights where markets may be overextended. In many cases, standard oscillators move gently, and traders can miss subtle hints that a reversal might be approaching. The Fisher Transform’s mathematical approach tightens the range of values and sharpens the highs and lows. This behavior can allow traders to see clearer peaks and troughs in momentum. Because it is often quite responsive, it can help anticipate areas where price might change direction, especially when compared to simpler moving averages or traditional oscillators. The result is a more evident signal of possible overbought or oversold conditions.
4. How This Extension Improves on the Basic Fisher Transform
Uptrick: Fisher Eclipse adds multiple features to the classic Fisher framework in order to address different trading styles and market behaviors:
a) Divergence Detection
The script can detect bullish or bearish divergences between price and the oscillator over a chosen lookback period, helping traders anticipate shifts in market direction.
b) Bar Coloring
When momentum exceeds a certain threshold (default 3), bars can be colored to highlight surges of buying or selling pressure. This quick visual reference can assist in spotting periods of heightened activity. After a bar color like this, usually, there is a quick correction as seen in the image below.
c) Signal Aggressiveness Levels
Users can choose between conservative, moderate, or aggressive signal thresholds. This allows them to tune how quickly the indicator flags potential entries or exits. Aggressive settings might suit scalpers who need rapid signals, while conservative settings may benefit swing traders preferring fewer, more robust indications.
d) Minimum Movement Filter
A configurable filter can be set to ensure that the Fisher line and its signal have a sufficient gap before triggering a buy or sell signal. This step is useful for traders seeking to minimize signals during choppy or sideways markets. This can be used to eliminate noise as well.
By combining all these elements into one package, the indicator attempts to offer a comprehensive toolkit for those who appreciate the Fisher Transform’s clarity but also desire more versatility.
5. Core Components
a) Fisher Transform
The script calculates a Fisher value using normalized price over a configurable length, highlighting potential peaks and troughs.
b) Signal Line
The Fisher line is smoothed using a short Simple Moving Average. Crossovers and crossunders are one of the key ways this indicator attempts to confirm momentum shifts.
c) Divergence Logic
The script looks back over a set number of bars to compare current highs and lows of both price and the Fisher oscillator. When price and the oscillator move in opposing directions, a divergence may occur, suggesting a possible upcoming reversal or weakening trend.
d) Thresholds for Overbought and Oversold
Horizontal lines are drawn at user-chosen overbought and oversold levels. These lines help traders see when momentum readings reach particular extremes, which can be especially relevant when combined with crossovers in that region.
e) Intensity Filter and Bar Coloring
If the magnitude of the change in the Fisher Transform meets or exceeds a specified threshold, bars are recolored. This provides a visual cue for significant momentum changes.
6. User Inputs
a) length
Defines how many bars the script looks back to compute the highest high and lowest low for the Fisher Transform. A smaller length reacts more quickly but can be noisier, while a larger length smooths out the indicator at the cost of responsiveness.
b) signal aggressiveness
Adjusts the buy and sell thresholds for conservative, moderate, and aggressive trading styles. This can be key in matching the indicator to personal risk preferences or varying market conditions. Conservative will give you less signals and aggressive will give you more signals.
c) minimum movement filter
Specifies how far apart the Fisher line and its signal line must be before generating a valid crossover signal.
d) divergence lookback
Controls how many bars are examined when determining if price and the oscillator are diverging. A larger setting might generate fewer signals, while a smaller one can provide more frequent alerts.
e) intensity threshold
Determines how large a change in the Fisher value must be for the indicator to recolor bars. Strong momentum surges become more noticeable.
f) overbought level and oversold level
Lets users define where they consider market conditions to be stretched on the upside or downside.
7. Calculation Process
a) Price Input
The script uses the midpoint of each bar’s high and low, sometimes referred to as hl2.
hl2 = (high + low) / 2
b) Range Normalization
Determine the maximum (maxHigh) and minimum (minLow) values over a user-defined lookback period (length).
Scale the hl2 value so it roughly fits between -1 and +1:
value = 2 * ((hl2 - minLow) / (maxHigh - minLow) - 0.5)
This step highlights the bar’s current position relative to its recent highs and lows.
c) Fisher Calculation
Convert the normalized value into the Fisher Transform:
fisher = 0.5 * ln( (1 + value) / (1 - value) ) + 0.5 * fisher_previous
fisher_previous is simply the Fisher value from the previous bar. Averaging half of the new transform with half of the old value smooths the result slightly and can prevent erratic jumps.
ln is the natural logarithm function, which compresses or expands values so that market turns often become more obvious.
d) Signal Smoothing
Once the Fisher value is computed, a short Simple Moving Average (SMA) is applied to produce a signal line. In code form, this often looks like:
signal = sma(fisher, 3)
Crossovers of the fisher line versus the signal line can be used to hint at changes in momentum:
• A crossover occurs when fisher moves from below to above the signal.
• A crossunder occurs when fisher moves from above to below the signal.
e) Threshold Checking
Users typically define oversold and overbought levels (often -1 and +1).
Depending on aggressiveness settings (conservative, moderate, aggressive), these thresholds are slightly shifted to filter out or include more signals.
For example, an oversold threshold of -1 might be used in a moderate setting, whereas -1.5 could be used in a conservative setting to require a deeper dip before triggering.
f) Divergence Checks
The script looks back a specified number of bars (divergenceLookback). For both price and the fisher line, it identifies:
• priceHigh = the highest hl2 within the lookback
• priceLow = the lowest hl2 within the lookback
• fisherHigh = the highest fisher value within the lookback
• fisherLow = the lowest fisher value within the lookback
If price forms a lower low while fisher forms a higher low, it can signal a bullish divergence. Conversely, if price forms a higher high while fisher forms a lower high, a bearish divergence might be indicated.
g) Bar Coloring
The script monitors the absolute change in Fisher values from one bar to the next (sometimes called fisherChange):
fisherChange = abs(fisher - fisher )
If fisherChange exceeds a user-defined intensityThreshold, bars are recolored to highlight a surge of momentum. Aqua might indicate a strong bullish surge, while purple might indicate a strong bearish surge.
This color-coding provides a quick visual cue for traders looking to spot large momentum swings without constantly monitoring indicator values.
8. Signal Generation and Filtering
Buy and sell signals occur when the Fisher line crosses the signal line in regions defined as oversold or overbought. The optional minimum movement filter prevents triggering if Fisher and its signal line are too close, reducing the chance of small, inconsequential price fluctuations creating frequent signals. Divergences that appear in oversold or overbought regions can serve as additional evidence that momentum might soon shift.
9. Visualization on the Chart
Uptrick: Fisher Eclipse plots two lines: the Fisher line in one color and the signal line in a contrasting shade. The chart displays horizontal dashed lines where the overbought and oversold levels lie. When the Fisher Transform experiences a sharp jump or drop above the intensity threshold, the corresponding price bars may change color, signaling that momentum has undergone a noticeable shift. If the indicator detects bullish or bearish divergence, dotted lines are drawn on the oscillator portion to connect the relevant points.
10. Market Adaptability
Because of the different aggressiveness levels and the optional minimum movement filter, Uptrick: Fisher Eclipse can be tailored to multiple trading styles. For instance, a short-term scalper might select a smaller length and more aggressive thresholds, while a swing trader might choose a longer length for smoother readings, along with conservative thresholds to ensure fewer but potentially stronger signals. During strongly trending markets, users might rely more on divergences or large intensity changes, whereas in a range-bound market, oversold or overbought conditions may be more frequent.
11. Risk Management Considerations
Indicators alone do not ensure favorable outcomes, and relying solely on any one signal can be risky. Using a stop-loss or other protections is often suggested, especially in fast-moving or unpredictable markets. Divergence can appear before a market reversal actually starts. Similarly, a Fisher Transform can remain in an overbought or oversold region for extended periods, especially if the trend is strong. Cautious interpretation and confirmation with additional methods or chart analysis can help refine entry and exit decisions.
12. Combining with Other Tools
Traders can potentially strengthen signals from Uptrick: Fisher Eclipse by checking them against other methods. If a moving average cross or a price pattern aligns with a Fisher crossover, the combined evidence might provide more certainty. Volume analysis may confirm whether a shift in market direction has participation from a broad set of traders. Support and resistance zones could reinforce overbought or oversold signals, particularly if price reaches a historical boundary at the same time the oscillator indicates a possible reversal.
13. Parameter Customization and Examples
Some short-term traders run a 15-minute chart, with a shorter length setting, aggressively tight oversold and overbought thresholds, and a smaller divergence lookback. This approach produces more frequent signals, which may appeal to those who enjoy fast-paced trading. More conservative traders might apply the indicator to a daily chart, using a larger length, moderate threshold levels, and a bigger divergence lookback to focus on broader market swings. Results can differ, so it may be helpful to conduct thorough historical testing to see which combination of parameters aligns best with specific goals.
14. Realistic Expectations
While the Fisher Transform can reveal potential turning points, no mathematical tool can predict future price behavior with full certainty. Markets can behave erratically, and a period of strong trending may see the oscillator pinned in an extreme zone without a significant reversal. Divergence signals sometimes appear well before an actual trend change occurs. Recognizing these limitations helps traders manage risk and avoids overreliance on any one aspect of the script’s output.
15. Theoretical Background
The Fisher Transform uses a logarithmic formula to map a normalized input, typically ranging between -1 and +1, into a scale that can fluctuate around values like -3 to +3. Because the transformation exaggerates higher and lower readings, it becomes easier to spot when the market might have stretched too far, too fast. Uptrick: Fisher Eclipse builds on that foundation by adding a series of practical tools that help confirm or refine those signals.
16. Originality and Uniqueness
Uptrick: Fisher Eclipse is not simply a duplicate of the basic Fisher Transform. It enhances the original design in several ways, including built-in divergence detection, bar-color triggers for momentum surges, thresholds for overbought and oversold levels, and customizable signal aggressiveness. By unifying these concepts, the script seeks to reduce noise and highlight meaningful shifts in market direction. It also places greater emphasis on helping traders adapt the indicator to their specific style—whether that involves frequent intraday signals or fewer, more robust alerts over longer timeframes.
17. Summary
Uptrick: Fisher Eclipse is an expanded take on the original Fisher Transform oscillator, including divergence detection, bar coloring based on momentum strength, and flexible signal thresholds. By adjusting parameters like length, aggressiveness, and intensity thresholds, traders can configure the script for day-trading, swing trading, or position trading. The indicator endeavors to highlight where price might be shifting direction, but it should still be combined with robust risk management and other analytical methods. Doing so can lead to a more comprehensive view of market conditions.
18. Disclaimer
No indicator or script can guarantee profitable outcomes in trading. Past performance does not necessarily suggest future results. Uptrick: Fisher Eclipse is provided for educational and informational purposes. Users should apply their own judgment and may want to confirm signals with other tools and methods. Deciding to open or close a position remains a personal choice based on each individual’s circumstances and risk tolerance.

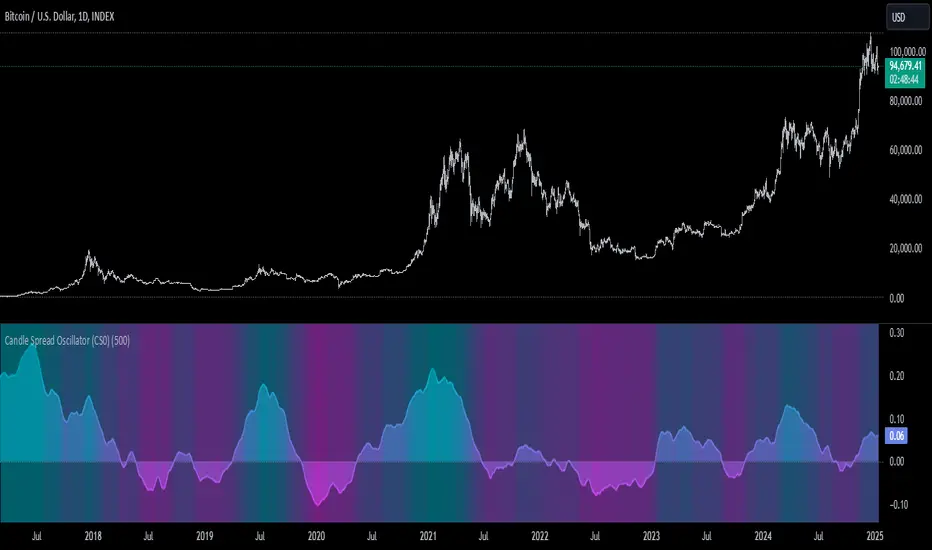
Candle Spread Oscillator (CS0)The Candle Spread Oscillator (CSO) is a custom technical indicator designed to help traders identify momentum and directional strength in the market by analyzing the relationship between the candle body spread and the total candle range. This oscillator provides traders with a visually intuitive representation of price action dynamics and highlights key transitions between positive and negative momentum.
How It Works:
Body Spread vs. Total Range:
The CSO calculates the body spread (difference between the close and open price) and compares it to the total range (difference between the high and low price) of a candle.
The ratio of the body spread to the total range represents the proportion of price movement driven by directional momentum.
Smoothed Oscillator:
To remove noise and enhance clarity, the ratio is smoothed using a Hull Moving Average (HMA). The smoothing period can be adjusted through the "Smoothing Period" input, enabling traders to tailor the indicator to their preferred timeframes or strategies.
Gradient Visualization:
A gradient coloring is applied to the oscillator, transitioning smoothly between colors (e.g., fuchsia for negative momentum and aqua for positive momentum). This provides traders with a clear, intuitive visual cue of market behavior.
Visual Features:
Oscillator Plot:
The oscillator is displayed as an area-style plot, dynamically colored using a gradient. Positive values are represented in shades of aqua, while negative values are in shades of fuchsia.
Midline (0 Level):
A horizontal midline is plotted at the zero level, serving as a key reference point for identifying transitions between positive and negative momentum.
Background Highlights:
The chart background is subtly colored to match the oscillator's state, enhancing the visual emphasis on current momentum conditions.
Alerts for Key Crossovers:
The CSO comes with built-in alert conditions, making it highly actionable for traders:
Cross Up Alert: Triggers when the oscillator crosses above the midline (0), signaling a potential shift into positive momentum.
Cross Down Alert: Triggers when the oscillator crosses below the midline (0), indicating a potential transition into negative momentum.
These alerts allow traders to stay informed about critical market shifts without constantly monitoring the chart.
How to Use:
Trend Identification:
When the oscillator is above the midline and positive, it indicates that price action is moving with bullish momentum.
When the oscillator is below the midline and negative, it reflects bearish momentum.
Momentum Strength:
The magnitude of the oscillator (its distance from the midline) helps traders gauge the strength of the momentum. Stronger moves will push the oscillator further from zero.
Potential Reversals:
Crossovers of the oscillator through the midline can signal potential reversals or shifts in market direction.
Customization:
Adjust the Smoothing Period to adapt the sensitivity of the oscillator to different timeframes. A lower smoothing period reacts faster to price changes, while a higher smoothing period smooths out noise.
Best Use Cases:
Momentum Trading: Identify periods of sustained bullish or bearish momentum to align with the trend.
Reversal Signals: Spot transitions in market direction when the oscillator crosses the midline.
Confirmation Tool: Use the CSO alongside other indicators (e.g., volume, trendlines, or moving averages) to confirm trading signals.
Key Inputs:
Smoothing Period: Customize the sensitivity of the oscillator by adjusting the lookback period for the Hull Moving Average.
Gradient Range: The color gradient transitions between defined thresholds (-0.1 to 0.2 by default), ensuring a smooth visual experience.
[Why Use the Candle Spread Oscillator?
The CSO is a simple yet powerful tool for traders who want to:
Gain a deeper understanding of price momentum.
Quickly visualize shifts between bullish and bearish trends.
Use clear, actionable signals with customizable alerts.
Disclaimer: This indicator is not a standalone trading strategy. It should be used in combination with other technical and fundamental analysis tools. Always trade responsibly, and consult a financial advisor for personalized advice.
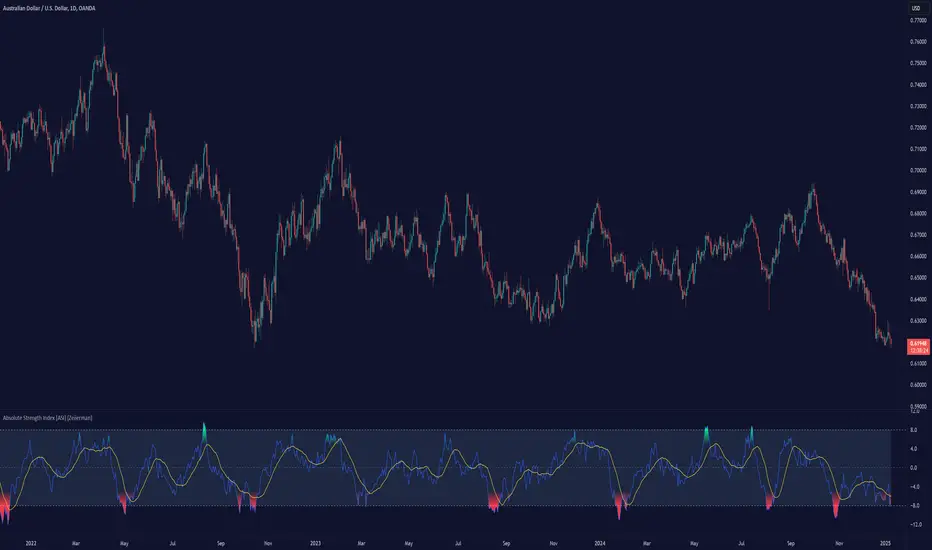
Absolute Strength Index [ASI] (Zeiierman)█ Overview
The Absolute Strength Index (ASI) is a next-generation oscillator designed to measure the strength and direction of price movements by leveraging percentile-based normalization of historical returns. Developed by Zeiierman, this indicator offers a highly visual and intuitive approach to identifying market conditions, trend strength, and divergence opportunities.
By dynamically scaling price returns into a bounded oscillator (-10 to +10), the ASI helps traders spot overbought/oversold conditions, trend reversals, and momentum changes with enhanced precision. It also incorporates advanced features like divergence detection and adaptive signal smoothing for versatile trading applications.
█ How It Works
The ASI's core calculation methodology revolves around analyzing historical price returns, classifying them into top and bottom percentiles, and normalizing the current price movement within this framework. Here's a breakdown of its key components:
⚪ Returns Lookback
The ASI evaluates historical price returns over a user-defined period (Returns Lookback) to measure recent price behavior. This lookback window determines the sensitivity of the oscillator:
Shorter Lookback: Higher responsiveness to recent price movements, suitable for scalping or high-volatility assets.
Longer Lookback: Smoother oscillator behavior is ideal for identifying larger trends and avoiding false signals.
⚪ Percentile-Based Thresholds
The ASI categorizes returns into two groups:
Top Percentile (Winners): The upper X% of returns, representing the strongest upward price moves.
Bottom Percentile (Losers): The lower X% of returns, capturing the sharpest downward movements.
This percentile-based normalization ensures the ASI adapts to market conditions, filtering noise and emphasizing significant price changes.
⚪ Oscillator Normalization
The ASI normalizes current returns relative to the top and bottom thresholds:
Values range from -10 to +10, where:
+10 represents extreme bullish strength (above the top percentile threshold).
-10 indicates extreme bearish weakness (below the bottom percentile threshold).
⚪ Signal Line Smoothing
A signal line is optionally applied to the ASI using a variety of moving averages:
Options: SMA, EMA, WMA, RMA, or HMA.
Effect: Smooths the ASI to filter out noise, with shorter lengths offering higher responsiveness and longer lengths providing stability.
⚪ Divergence Detection
One of ASI's standout features is its ability to detect and highlight bullish and bearish divergences:
Bullish Divergence: The ASI forms higher lows while the price forms lower lows, signaling potential upward reversals.
Bearish Divergence: The ASI forms lower highs while the price forms higher highs, indicating potential downward reversals.
█ Key Differences from RSI
Dynamic Adaptability: ASI adjusts to market conditions through percentile-based scaling, while RSI uses static thresholds.
█ How to Use ASI
⚪ Trend Identification
Bullish Strength: ASI above zero suggests upward momentum, suitable for trend-following trades.
Bearish Weakness: ASI below zero signals downward momentum, ideal for short trades or exits from long positions.
⚪ Overbought/Oversold Levels
Overbought Zone: ASI in the +8 to +10 range indicates potential exhaustion of bullish momentum.
Oversold Zone: ASI in the -8 to -10 range points to potential reversal opportunities.
⚪ Divergence Signals
Look for bullish or bearish divergence labels to anticipate trend reversals before they occur.
⚪ Signal Line Crossovers
A crossover between the ASI and its signal line (e.g., EMA or SMA) can indicate a shift in momentum:
Bullish Crossover: ASI crosses above the signal line, signaling potential upside.
Bearish Crossover: ASI crosses below the signal line, suggesting downside momentum.
█ Settings Explained
⚪ Absolute Strength Index
Returns Lookback: Sets the sensitivity of the oscillator. Shorter periods detect short-term changes, while longer periods focus on broader trends.
Top/Bottom Percentiles: Adjust thresholds for defining winners and losers. Narrower percentiles increase sensitivity to outliers.
Signal Line Type: Choose from SMA, EMA, WMA, RMA, or HMA for smoothing.
Signal Line Length: Fine-tune the responsiveness of the signal line.
⚪ Divergence
Divergence Lookback: Adjusts the period for detecting divergence. Use longer lookbacks to reduce noise.
-----------------
Disclaimer
The information contained in my Scripts/Indicators/Ideas/Algos/Systems does not constitute financial advice or a solicitation to buy or sell any securities of any type. I will not accept liability for any loss or damage, including without limitation any loss of profit, which may arise directly or indirectly from the use of or reliance on such information.
All investments involve risk, and the past performance of a security, industry, sector, market, financial product, trading strategy, backtest, or individual's trading does not guarantee future results or returns. Investors are fully responsible for any investment decisions they make. Such decisions should be based solely on an evaluation of their financial circumstances, investment objectives, risk tolerance, and liquidity needs.
My Scripts/Indicators/Ideas/Algos/Systems are only for educational purposes!
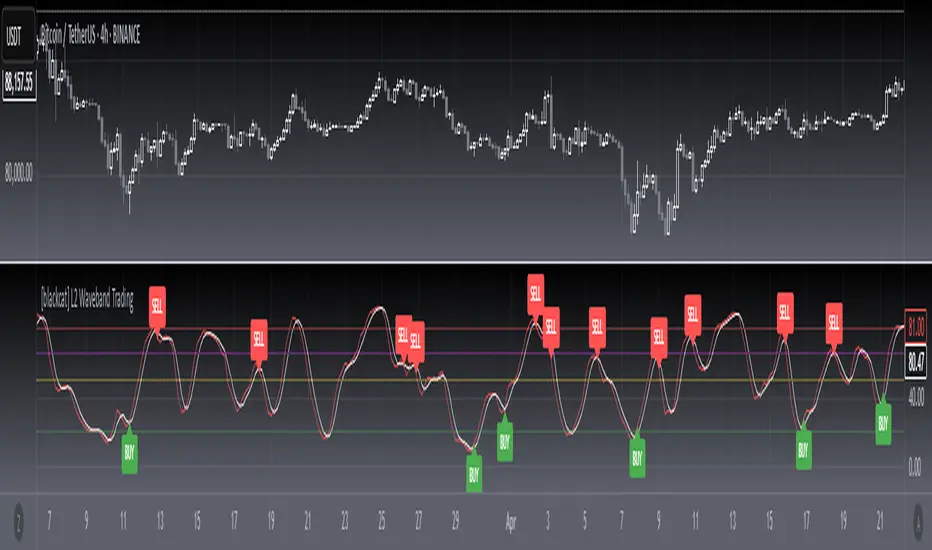
[blackcat] L2 Waveband Trading█ OVERVIEW
The Waveband Trading script calculates trading signals based on a modified Relative Strength Index (RSI)-like system combined with specific price action criteria. It plots two lines representing different smoothed RSI-like indicators and marks potential buying opportunities labeled as "S" for stronger trends and "B" for weaker but still favorable ones.
█ LOGICAL FRAMEWORK
The script begins by defining the waveband_trading_signals function which computes RSI-like metrics and determines buy signals under certain conditions. The main sections include input parameter definitions, function calls, data processing within the function, and plot commands for visual representation. Data flows from historical OHLCV data to various technical computations like EMAs and SMAs before being evaluated against user-defined thresholds to generate trade signals.
█ CUSTOM FUNCTIONS
Waveband Trading Signals:
• Purpose: Computes waveband trading signals using a customized version of the RSI indicator.
• Parameters:
— overboughtLevel: Threshold level indicating market overbought condition.
— oversoldLevel: Threshold level indicating market oversold condition.
— strongHoldLevel: Strong hold condition threshold between neutral and overbought states.
— moderateHoldLevel: Moderate hold condition threshold below strong hold level.
• [b>Returns: A tuple containing:
— k: Smoothed RSI-like metric.
— d: Further smoothed version of 'k'.
— buySignalStrong: Boolean indicating a strong trend buy signal.
— buySignalWeak: Boolean indicating a weak but promising buy signal.
█ KEY POINTS AND TECHNIQUES
• Utilizes EMA and SMA functions to smooth out price variations effectively.
• Employs crossover logic between fast ('k') and slow ('d') indicators to identify entry points.
• Incorporates volume checks ensuring increasing interest in trades aligns with upwards momentum.
• Leverages predefined threshold levels allowing flexibility to adapt to varying market conditions.
• Uses the new labeling feature ( label.new ) introduced in Pine Script v5 for marking significant chart events visually.
█ EXTENDED KNOWLEDGE AND APPLICATIONS
Potential enhancements could involve incorporating additional filters such as MACD crossovers or Fibonacci retracement levels alongside optimizing current conditions via backtesting. This technique might also prove useful in other strategies requiring robust confirmation methods beyond simple price action; alternatively, adapting it into a more automated form for execution on exchanges offering API access. Understanding key functionalities like relative strength assessment, smoothed averaging techniques, and conditional buy/sell rules enriches one’s toolkit when developing complex trading algorithms tailored specifically toward personal investment philosophies.
RSI Convergence DivergenceRSI based oscillator inspired by the MACD.
Indicator that consists of two RSI calibrated at different lengths to take advantage of their convergence, divergence, overall direction, overall strength and several other metrics to extract signals from the price action.
This indicator includes:
- Fast RSI
- Slow RSI
- Signal line to identify convergence/divergence
- Simple moving average applied to the average of the two RSI
- DEMA applied to the average of the two RSI
- An average moving average of the SMA and DEMA
Some of the applications of this indicator:
- Simple convergence/divergence signaled by the moving average going above or below zero.
- Crossover between SMA and DEMA
- Combination of convergence/divergence and one of the 3 MAs reaching overbought or oversold threshold
- Average moving average going above or below 50
The combinations of different conditions are countless and limited only by the imagination of the user.
The visualization inputs, besides allowing to choose the candle coloring, give the user the ability to keep the chart clean and only see the signals he is interested into.

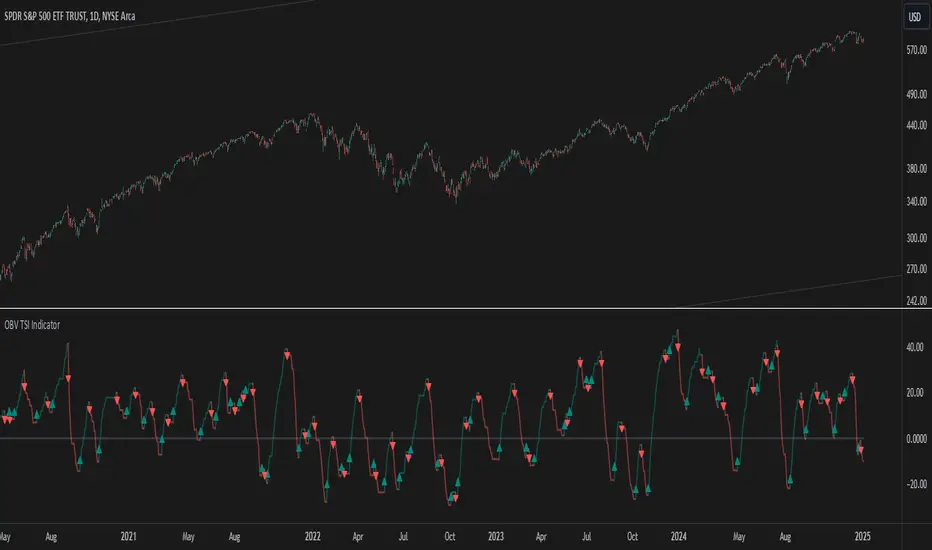
OBV TSI IndicatorThe OBV TSI Indicator combines two powerful technical analysis tools: the On-Balance Volume (OBV) and the True Strength Index (TSI). This hybrid approach provides insights into both volume dynamics and momentum, helping traders identify potential trend reversals, breakouts, or continuations with greater accuracy.
The OBV TSI Indicator tracks cumulative volume shifts via OBV and integrates the TSI for momentum analysis. It offers customizable moving average options for further smoothing. Visual trendlines, pivot points, and signal markers enhance clarity.
The OBV tracks volume flow by summing volumes based on price changes. Positive volume is added when prices rise, and negative volume is subtracted when prices fall. The result is smoothed to detect meaningful trends in volume. A volume spread is derived from the difference between the smoothed OBV and cumulative volume. This is then adjusted by the price deviation to generate the shadow spread, which highlights critical volume-driven price levels.
The shadow spread is added to either the high or low price, depending on its sign, producing a refined OBV output. This serves as the main source for the subsequent TSI calculation. The TSI is a momentum oscillator calculated using double-smoothed price changes. It provides an accurate measure of trend strength and direction.
Various moving average options, such as EMA, DEMA, or TEMA, are applied to the smoothed OBV for additional trend filtering. Users can select their preferred type and length to suit their trading strategy. Trendlines are plotted to visualize the overall direction. When a significant change in trend is detected, up or down arrows indicate potential buy or sell signals. The script identifies key pivot points based on the highest and lowest levels within a defined period. These pivots help pinpoint reversal zones.
The indicator offers customization options, allowing users to adjust the OBV length for smoothing, choose from various moving average types, and fine-tune the short, long, and signal periods for TSI. Additionally, users can toggle visibility for trendlines, signals, and pivots to suit their preferences.
This indicator is ideal for practical use cases such as spotting potential trend reversals by observing TSI crossovers and pivot levels, anticipating breakouts from key price levels using the shadow spread, and validating trends by aligning TSI signals with OBV and moving averages.
The OBV TSI Indicator is a versatile tool designed to enhance decision-making in trading by combining volume and momentum analysis. Its flexibility and visual aids make it suitable for traders of all experience levels. By leveraging its insights, you can confidently navigate market trends and improve your trading outcomes.
FuTech : MACD Crossovers Advanced Alert Lines=============================================================
Indicator : FuTech: MACD Crossovers Advanced Alert Lines
Overview:
The "FuTech: MACD Crossovers Advanced Alert Lines" indicator is designed to assist traders in identifying key technical patterns using the :-
1. MACD (Moving Average Convergence Divergence) and
2. Golden/Death Crossovers
By visualizing these indicators directly on the chart with advanced lines, it helps traders make more informed decisions on when to enter or exit trades.
=============================================================
Key Features of "FuTech: MACD Crossovers Advanced Alert Lines":
1. MACD Crossovers:
a) The MACD is one of the most widely used indicators for identifying momentum shifts and potential buy/sell signals. This indicator plots vertical lines on the chart whenever the MACD line crosses the signal line.
b) Upward Crossover (Bullish Signal) : When the MACD line crosses above the signal line, a green vertical line will appear, indicating a potential buying opportunity.
c) Downward Crossover (Bearish Signal) : When the MACD line crosses below the signal line, a red vertical line will appear, signaling a potential selling opportunity.
2. Golden Cross & Death Cross:
a) The Golden Cross occurs when the price moves above a long-term moving average (like the 50-day moving average), signaling a potential upward trend.
b) The Death Cross occurs when the price moves below a long-term moving average, signaling a potential downward trend.
c) These crossovers are displayed with customizable lines on the chart to easily spot when the market is shifting direction.
d) Golden Cross (Bullish Signal) : A blue vertical line appears when the price crosses above the selected long-term moving average.
e) Death Cross (Bearish Signal) : A purple vertical line appears when the price crosses below the selected long-term moving average.
=============================================================
Customization Options:
This indicator offers several customization options to suit your trading preferences:
1) MACD Settings:
a) Choose between different moving average types (EMA, SMA, or VWMA) for calculating the MACD.
b) Adjust the lengths of the fast, slow, and signal MACD periods.
c) Control the width and color of the vertical lines drawn on the chart for both up and down crossovers.
2) Golden Cross / Death Cross Settings:
a) Select the moving average type for the Golden Cross / Death Cross (EMA, SMA, or VWMA).
b) Define the lookback period for calculating the Golden Cross / Death Cross.
c) Customize the appearance of the Golden and Death Cross lines, including their width and color.
You can use both as well as either of the MACD lines or Golden Crossover / Death Crossover Lines respectively as per your trading strategies
=============================================================
How "FuTech: MACD Crossovers Advanced Alert Lines" indicator Works:
a) The indicator monitors the price and calculates the MACD and Golden/Death Crosses.
b) When the MACD line crosses above or below the signal line, or when the price crosses above or below the long-term moving average, it plots a vertical line on the chart.
c) These lines help traders quickly spot potential turning points in the market, providing clear signals to act upon.
=============================================================
Use Case:
a) Swing Traders: The indicator is useful for spotting momentum shifts and trend reversals, helping you time entries and exits for short- to medium-term trades.
b) Long-Term Traders: The Golden and Death Cross signals help identify major trend changes, giving insights into potential market shifts.
=============================================================
Why Use This "FuTech: MACD Crossovers Advanced Alert Lines" Indicator ?
a) Clear Visuals : The vertical lines provide clear and easy-to-spot signals for MACD crossovers and Golden/Death Crosses.
b) Customizable : Adjust settings for your personal trading strategy, whether you're focusing on short-term momentum or long-term trend shifts.
c) Supports Decision Making : With its advanced line plotting and customizable features, this indicator helps you make quicker and more informed trading decisions.
=============================================================
How to Use:
a) MACD Crossovers: Look for green lines to signal potential buying opportunities (when the MACD line crosses above the signal line) and red lines for selling opportunities (when the MACD line crosses below the signal line).
b) Golden Cross / Death Cross: Use the blue lines to confirm when a positive trend may begin (Golden Cross) and purple lines to warn when a negative trend may start (Death Cross).
=============================================================
Conclusion:
"FuTech: MACD Crossovers Advanced Alert Lines" indicator combines two powerful technical analysis tools, the MACD and Golden/Death Crosses, to provide clear, actionable signals on your chart.
By customizing the appearance of these signals and combining them with your trading strategy, you can enhance your decision-making process and improve your trading outcomes.
=============================================================
Thank you !
Jai Swaminarayan Dasna Das !
He Hari ! Bas Ek Tu Raji Tha !
=============================================================

Regime Classifier Oscillator (AiBitcoinTrend)The Regime Classifier Oscillator (AiBitcoinTrend) is an advanced tool for understanding market structure and detecting dynamic price regimes. By combining filtered price trends, clustering algorithms, and an adaptive oscillator, it provides traders with detailed insights into market phases, including accumulation, distribution, advancement, and decline.
This innovative tool simplifies market regime classification, enabling traders to align their strategies with evolving market conditions effectively.
👽 What is a Regime Classifier, and Why is it Useful?
A Regime Classifier is a concept in financial analysis that identifies distinct market conditions or "regimes" based on price behavior and volatility. These regimes often correspond to specific phases of the market, such as trends, consolidations, or periods of high or low volatility. By classifying these regimes, traders and analysts can better understand the underlying market dynamics, allowing them to adapt their strategies to suit prevailing conditions.
👽 Common Uses in Finance
Risk Management: Identifying high-volatility regimes helps traders adjust position sizes or hedge risks.
Strategy Optimization: Traders tailor their approaches—trend-following strategies in trending regimes, mean-reversion strategies in consolidations.
Forecasting: Understanding the current regime aids in predicting potential transitions, such as a shift from accumulation to an upward breakout.
Portfolio Allocation: Investors allocate assets differently based on market regimes, such as increasing cash positions in high-volatility environments.
👽 Why It’s Important
Markets behave differently under varying conditions. A regime classifier provides a structured way to analyze these changes, offering a systematic approach to decision-making. This improves both accuracy and confidence in navigating diverse market scenarios.
👽 How We Implemented the Regime Classifier in This Indicator
The Regime Classifier Oscillator takes the foundational concept of market regime classification and enhances it with advanced computational techniques, making it highly adaptive.
👾 Median Filtering: We smooth price data using a custom median filter to identify significant trends while eliminating noise. This establishes a baseline for price movement analysis.
👾 Clustering Model: Using clustering techniques, the indicator classifies volatility and price trends into distinct regimes:
Advance: Strong upward trends with low volatility.
Decline: Downward trends marked by high volatility.
Accumulation: Consolidation phases with subdued volatility.
Distribution: Topping or bottoming patterns with elevated volatility.
This classification leverages historical price data to refine cluster boundaries dynamically, ensuring adaptive and accurate detection of market states.
Volatility Classification: Price volatility is analyzed through rolling windows, separating data into high and low volatility clusters using distance-based assignments.
Price Trends: The interaction of price levels with the filtered trendline and volatility clusters determines whether the market is advancing, declining, accumulating, or distributing.
👽 Dynamic Cycle Oscillator (DCO):
Captures cyclic behavior and overlays it with smoothed oscillations, providing real-time feedback on price momentum and potential reversals.
Regime Visualization:
Regimes are displayed with intuitive labels and background colors, offering clear, actionable insights directly on the chart.
👽 Why This Implementation Stands Out
Dynamic and Adaptive: The clustering and refit mechanisms adapt to changing market conditions, ensuring relevance across different asset classes and timeframes.
Comprehensive Insights: By combining price trends, volatility, and cyclic behaviors, the indicator provides a holistic view of the market.
This implementation bridges the gap between theoretical regime classification and practical trading needs, making it a powerful tool for both novice and experienced traders.
👽 Applications
👾 Regime-Based Trading Strategies
Traders can use the regime classifications to adapt their strategies effectively:
Advance & Accumulation: Favorable for entering or holding long positions.
Decline & Distribution: Opportunities for short positions or risk management.
👾 Oscillator Insights for Trend Analysis
Overbought/oversold conditions: Early warning of potential reversals.
Dynamic trends: Highlights the strength of price momentum.
👽 Indicator Settings
👾 Filter and Classification Settings
Filter Window Size: Controls trend detection sensitivity.
ATR Lookback: Adjusts the threshold for regime classification.
Clustering Window & Refit Interval: Fine-tunes regime accuracy.
👾 Oscillator Settings
Dynamic Cycle Oscillator Lookback: Defines the sensitivity of cycle detection.
Smoothing Factor: Balances responsiveness and stability.
Disclaimer: This information is for entertainment purposes only and does not constitute financial advice. Please consult with a qualified financial advisor before making any investment decisions.

MACD Pseudo Super Smoother [MACDPSS]The MACD Pseudo Super Smoother (MACDPSS) is a variation of the classic Moving Average Convergence Divergence (MACD) indicator. It utilizes the Pseudo Super Smoother (PSS) filter, a Finite Impulse Response (FIR) filter, to smooth both the MACD line and the signal line, providing a potentially refined representation of momentum compared to the traditional MACD which typically uses Exponential Moving Averages (EMAs).
The PSS, inspired by the Super Smoother filter (an Infinite Impulse Response (IIR) filter), aims to reduce noise while minimizing lag. The MACDPSS leverages this FIR implementation to create a unique MACD variant. The core concept of MACD, which involves analyzing the relationship between two moving averages of different lengths to identify momentum shifts, remains intact.
Filter Types and Customization
The MACDPSS offers independent control over the smoothing applied to the MACD line and the signal line through two "Filter Style" inputs:
Oscillator MA Type: This setting determines the filter type used to calculate the fast and slow moving averages that form the basis of the MACD line.
Signal Line MA Type: This setting controls the filter type used to smooth the MACD line, generating the signal line.
Each of these settings allows a choice between two distinct PSS filter types:
Type 1: Provides a smoother output with a more gradual response, characterized by greater attenuation of high-frequency components.
Type 2: Exhibits increased reactivity, allowing for a faster response to shifts in momentum, but with a potential for overshoot.
This dual-filter approach provides flexibility in tailoring the indicator's responsiveness and smoothness to individual preferences and specific market conditions. The user can, for example, choose a smoother Type 1 filter for the MACD line and a more reactive Type 2 filter for the signal line, or vice-versa.
Calculations
The MACDPSS calculates the MACD line by subtracting the slow moving average from the fast moving average, both derived using the PSS filter with the selected "Oscillator MA Type." The signal line is then calculated by applying the PSS filter with the selected "Signal Line MA Type" to the MACD line. The histogram represents the difference between the MACD line and the signal line.
Interpretation
The interpretation of the MACDPSS is similar to the standard MACD. Crossovers between the MACD line and the signal line, the position of the MACD line relative to the zero line, and the slope and direction of the histogram are all used to gauge momentum and potential trend changes.
Disclaimer
The MACDPSS, while inspired by the Super Smoother, utilizes a distinct FIR approximation (the PSS). Therefore, its behavior will not perfectly mirror that of a MACD calculated using IIR filters. The PSS is designed to be a rough approximation. This indicator should be used in conjunction with other technical analysis tools, and users should be aware of the inherent differences between FIR and IIR filter characteristics when interpreting the indicator's signals. Like any moving average based indicator, the MACDPSS is a lagging indicator, although it tries to improve it. The novelty of this indicator comes from applying a unique FIR filter to a classic momentum oscillator in a configurable way.

Buy/Sell Signals (MACD + RSI) 1HThis is a Pine Script indicator for TradingView that plots Buy/Sell signals based on the combination of MACD and RSI indicators on a 1-hour chart.
Description of the Code:
Indicator Setup:
The script is set to overlay the Buy/Sell signals directly on the price chart (using overlay=true).
The indicator is named "Buy/Sell Signals (MACD + RSI) 1H".
MACD Settings:
The MACD (Moving Average Convergence Divergence) uses standard settings of:
Fast Length: 12
Slow Length: 26
Signal Line Smoothing: 9
The MACD line and the Signal line are calculated using the ta.macd() function.
RSI Settings:
The RSI (Relative Strength Index) is calculated with a 14-period setting using the ta.rsi() function.
Buy/Sell Conditions:
Buy Signal:
Triggered when the MACD line crosses above the Signal line (Golden Cross).
RSI value is below 50.
Sell Signal:
Triggered when the MACD line crosses below the Signal line (Dead Cross).
RSI value is above 50.
Signal Visualization:
Buy Signals:
Green "BUY" labels are plotted below the price bars where the Buy conditions are met.
Sell Signals:
Red "SELL" labels are plotted above the price bars where the Sell conditions are met.
Chart Timeframe:
While the code itself doesn't enforce a specific timeframe, the name indicates that this indicator is intended to be used on a 1-hour chart.
To use it effectively, apply the script on a 1-hour chart in TradingView.
How It Works:
This indicator combines MACD and RSI to generate Buy/Sell signals:
The MACD identifies potential trend changes or momentum shifts (via crossovers).
The RSI ensures that Buy/Sell signals align with broader momentum (e.g., Buy when RSI < 50 to avoid overbought conditions).
When the defined conditions for Buy or Sell are met, visual signals (labels) are plotted on the chart.
How to Use:
Copy the code into the Pine Script editor in TradingView.
Save and apply the script to your 1-hour chart.
Look for:
"BUY" signals (green): Indicating potential upward trends or buying opportunities.
"SELL" signals (red): Indicating potential downward trends or selling opportunities.
This script is simple and focuses purely on providing actionable Buy/Sell signals based on two powerful indicators, making it ideal for traders who prefer a clean chart without clutter. Let me know if you need further customization!

Statistical Trend Analysis (Scatterplot) [BigBeluga]Statistical Trend Analysis (Scatterplot) provides a unique perspective on market dynamics by combining the statistical concept of z-scores with scatterplot visualization to assess price momentum and potential trend shifts.
🧿 What is Z-Score?
Definition: A z-score is a statistical measure that quantifies how far a data point is from the mean, expressed in terms of standard deviations.
In this Indicator:
A high positive z-score indicates the price is significantly above the average.
A low negative z-score indicates the price is significantly below the average.
The indicator also calculates the rate of change of the z-score, helping identify momentum shifts in the market.
🧿 Key Features:
Scatterplot Visualization:
Displays data points of z-score and its change across four quadrants.
Quadrants help interpret market conditions:
Upper Right (Strong Bullish Momentum): Most data points here signal an ongoing uptrend.
Upper Left (Weakening Momentum): Data points here may indicate a potential market shift or ranging market.
Lower Left (Strong Bearish Momentum): Indicates a dominant downtrend.
Lower Right (Trend Shift to Bullish/Ranging): Suggests weakening bearish momentum or an emerging uptrend.
Color-Coded Candles:
Candles are dynamically colored based on the z-score, providing a visual cue about the price's deviation from the mean.
Z-Score Time Series:
A line plot of z-scores over time shows price deviation trends.
A gray histogram displays the rate of change of the z-score, highlighting momentum shifts.
🧿 Usage:
Use the scatterplot and quadrant gauges to understand the current market momentum and potential shifts.
Monitor the z-score line plot to identify overbought/oversold conditions.
Utilize the gray histogram to detect momentum reversals and trend strength.
This tool is ideal for traders who rely on statistical insights to confirm trends, detect potential reversals, and assess market momentum visually and quantitatively.

Profitability Visualization with Bid-Ask Spread ApproximationOverview
The " Profitability Visualization with Bid-Ask Spread Approximation " indicator is designed to assist traders in assessing potential profit and loss targets in relation to the current market price or a simulated entry price. It provides flexibility by allowing users to choose between two methods for calculating the offset from the current price:
Bid-Ask Spread Approximation: The indicator attempts to estimate the bid-ask spread by using the highest (high) and lowest (low) prices within a given period (typically the current bar or a user-defined timeframe) as proxies for the ask and bid prices, respectively. This method provides a dynamic offset that adapts to market volatility.
Percentage Offset: Alternatively, users can specify a fixed percentage offset from the current price. This method offers a consistent offset regardless of market conditions.
Key Features
Dual Offset Calculation Methods: Choose between a dynamic bid-ask spread approximation or a fixed percentage offset to tailor the indicator to your trading style and market analysis.
Entry Price Consideration: The indicator can simulate an entry price at the beginning of each trading session (or the first bar on the chart if no sessions are defined). This feature enables a more realistic visualization of potential profit and loss levels based on a hypothetical entry point.
Profit and Loss Targets: When the entry price consideration is enabled, the indicator plots profit target (green) and loss target (red) lines. These lines represent the price levels at which a trade entered at the simulated entry price would achieve a profit or incur a loss equivalent to the calculated offset amount.
Offset Visualization: Regardless of whether the entry price is considered, the indicator always displays upper (aqua) and lower (fuchsia) offset lines. These lines represent the calculated offset levels based on the chosen method (bid-ask approximation or percentage offset).
Customization: Users can adjust the percentage offset, toggle the bid-ask approximation and entry price consideration, and customize the appearance of the lines through the indicator's settings.
Inputs
useBidAskApproximation A boolean (checkbox) input that determines whether to use the bid-ask spread approximation (true) or the percentage offset (false). Default is false.
percentageOffset A float input that allows users to specify the percentage offset to be used when useBidAskApproximation is false. The default value is 0.63.
considerEntryPrice A boolean input that enables the consideration of a simulated entry price for calculating and displaying profit and loss targets. Default is true.
Calculations
Bid-Ask Approximation (if enabled): bidApprox = request.security(syminfo.tickerid, timeframe.period, low) Approximates the bid price using the lowest price (low) of the current period. askApprox = request.security(syminfo.tickerid, timeframe.period, high) Approximates the ask price using the highest price (high) of the current period. spreadApprox = askApprox - bidApprox Calculates the approximate spread.
Offset Amount: offsetAmount = useBidAskApproximation ? spreadApprox / 2 : close * (percentageOffset / 100) Determines the offset amount based on the selected method. If useBidAskApproximation is true, the offset is half of the approximated spread; otherwise, it's the current closing price (close) multiplied by the percentageOffset.
Entry Price (if enabled): var entryPrice = 0.0 Initializes a variable to store the entry price. if considerEntryPrice Checks if entry price consideration is enabled. if barstate.isnew Checks if the current bar is the first bar of a new session. entryPrice := close Sets the entryPrice to the closing price of the first bar of the session.
Profit and Loss Targets (if entry price is considered): profitTarget = entryPrice + offsetAmount Calculates the profit target price level. lossTarget = entryPrice - offsetAmount Calculates the loss target price level.
Plotting
Profit Target Line: Plotted in green (color.green) with a dashed line style (plot.style_linebr) and increased linewidth (linewidth=2) when considerEntryPrice is true.
Loss Target Line: Plotted in red (color.red) with a dashed line style (plot.style_linebr) and increased linewidth (linewidth=2) when considerEntryPrice is true.
Upper Offset Line: Always plotted in aqua (color.aqua) to show the offset level above the current price.
Lower Offset Line: Always plotted in fuchsia (color.fuchsia) to show the offset level below the current price.
Limitations
Approximation: The bid-ask spread approximation is based on high and low prices and may not perfectly reflect the actual bid-ask spread of a specific broker, especially during periods of high volatility or low liquidity.
Simplified Entry: The entry price simulation is basic and assumes entry at the beginning of each session. It does not account for specific entry signals or order types.
No Order Execution: This indicator is purely for visualization and does not execute any trades.
Data Discrepancies: The high and low values used for approximation might not always align with real-time bid and ask prices due to differences in data aggregation and timing between TradingView and various brokers.
Disclaimer
This indicator is for educational and informational purposes only and should not be considered financial advice. Trading involves substantial risk, and past performance is not indicative of future results. Always conduct thorough research and consider your own risk tolerance before making any trading decisions. It is recommended to combine this indicator with other technical analysis tools and a well-defined trading strategy.
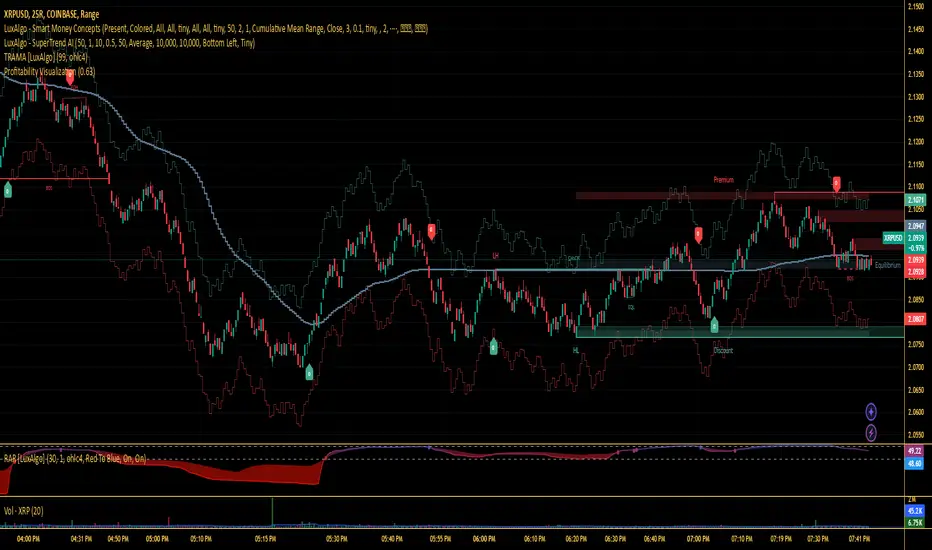
Sunil High-Frequency Strategy with Simple MACD & RSISunil High-Frequency Strategy with Simple MACD & RSI
This high-frequency trading strategy uses a combination of MACD and RSI to identify quick market opportunities. By leveraging these indicators, combined with dynamic risk management using ATR, it aims to capture small but frequent price movements while ensuring tight control over risk.
Key Features:
Indicators Used:
MACD (Moving Average Convergence Divergence): The strategy uses a shorter MACD configuration (Fast Length of 6 and Slow Length of 12) to capture quick price momentum shifts. A MACD crossover above the signal line triggers a buy signal, while a crossover below the signal line triggers a sell signal.
RSI (Relative Strength Index): A shorter RSI length of 7 is used to gauge overbought and oversold market conditions. The strategy looks for RSI confirmation, with a long trade initiated when RSI is below the overbought level (70) and a short trade initiated when RSI is above the oversold level (30).
Risk Management:
Dynamic Stop Loss and Take Profit: The strategy uses ATR (Average True Range) to calculate dynamic stop loss and take profit levels based on market volatility.
Stop Loss is set at 0.5x ATR to limit risk.
Take Profit is set at 1.5x ATR to capture reasonable price moves.
Trailing Stop: As the market moves in the strategy’s favor, the position is protected by a trailing stop set at 0.5x ATR, allowing the strategy to lock in profits as the price moves further.
Entry & Exit Signals:
Long Entry: Triggered when the MACD crosses above the signal line (bullish crossover) and RSI is below the overbought level (70).
Short Entry: Triggered when the MACD crosses below the signal line (bearish crossover) and RSI is above the oversold level (30).
Exit Conditions: The strategy exits long or short positions based on the stop loss, take profit, or trailing stop activation.
Frequent Trades:
This strategy is designed for high-frequency trading, with trade signals occurring frequently as the MACD and RSI indicators react quickly to price movements. It works best on lower timeframes such as 1-minute, 5-minute, or 15-minute charts, but can be adjusted for different timeframes based on the asset’s volatility.
Customizable Parameters:
MACD Settings: Adjust the Fast Length, Slow Length, and Signal Length to tune the MACD’s sensitivity.
RSI Settings: Customize the RSI Length, Overbought, and Oversold levels to better match your trading style.
ATR Settings: Modify the ATR Length and multipliers for Stop Loss, Take Profit, and Trailing Stop to optimize risk management according to market volatility.
Important Notes:
Market Conditions: This strategy is designed to capture smaller, quicker moves in trending markets. It may not perform well during choppy or sideways markets.
Optimizing for Asset Volatility: Adjust the ATR multipliers based on the asset’s volatility to suit the risk-reward profile that fits your trading goals.
Backtesting: It's recommended to backtest the strategy on different assets and timeframes to ensure optimal performance.
Summary:
The Sunil High-Frequency Strategy leverages a simple combination of MACD and RSI with dynamic risk management (using ATR) to trade small but frequent price movements. The strategy ensures tight stop losses and reasonable take profits, with trailing stops to lock in profits as the price moves in favor of the trade. It is ideal for scalping or intraday trading on lower timeframes, aiming for quick entries and exits with controlled risk.
