Highs & Lows - Multi TimeFrame### **📌 HL-MWD (Highs & Lows - Multi Timeframe Indicator) – Community Release**
#### **🔹 Overview**
The **HL-MWD Indicator** is a **multi-timeframe support & resistance tool** that plots **historical highs and lows** from **daily, weekly, and monthly timeframes** onto an intraday chart. It helps traders **identify key levels of support and resistance** that have influenced price action over different timeframes.
This indicator is useful for **day traders, swing traders, and position traders** who rely on **multi-timeframe analysis** to spot critical price levels.
---
### **🔥 Key Features**
✅ **Plots Highs & Lows for Daily, Weekly, and Monthly Timeframes**
✅ **Customizable Lookback Periods for Each Timeframe**
✅ **Adjustable Line Colors, Styles (Solid, Dotted, Dashed), and Widths**
✅ **Extend Lines into the Future to Identify Key Price Levels**
✅ **Option to Display Price Labels for Each Level**
✅ **Gradient Option to Highlight Recent Highs & Lows (Disabled by Default)**
✅ **Compatible with Intraday, Daily, and Weekly Charts**
---
### **📈 How It Works**
- **Daily Highs & Lows:** Captures the **highest and lowest prices** within the selected lookback period (default: **14 bars**).
- **Weekly Highs & Lows:** Marks the **highest and lowest prices** within the chosen weekly lookback (default: **52 bars**).
- **Monthly Highs & Lows:** Displays the **high and low points** from the monthly timeframe (default: **36 bars**).
- **Extended Lines:** Project past highs and lows **into the future** to help identify **potential support & resistance zones**.
---
### **⚠️ TradingView Lookback Limitations**
🔹 **TradingView has a limit on how many historical bars can be accessed per timeframe**, which affects how far back the indicator can retrieve data.
🔹 **Intraday charts (e.g., 5m, 15m) have a limited number of past bars**, meaning:
- **You won’t be able to view 36 months' worth of monthly levels** on a **5-minute chart**, because TradingView doesn’t store that much data in lower timeframes.
- **If multiple timeframes (e.g., weekly + monthly) are enabled at the same time**, some historical data may **not be available on shorter timeframes**.
🔹 **Recommendation:**
- If using **monthly lookbacks (36 months+), view them on a daily or higher timeframe**.
- If using **weekly lookbacks (52 weeks+), higher intraday timeframes (e.g., 1-hour, 4-hour) are better suited**.
- **Lower timeframes (1m, 5m, 15m) may miss some levels** if TradingView's bar limit is exceeded.
---
### **⚙️ Customization Options**
| **Setting** | **Default Value** | **Description** |
|------------------|----------------|----------------|
| **Daily Lookback** | `14` | Number of bars used to calculate daily highs/lows. |
| **Weekly Lookback** | `52` | Number of bars used to calculate weekly highs/lows. |
| **Monthly Lookback** | `36` | Number of bars used to calculate monthly highs/lows. |
| **Line Colors** | Daily: `Blue` Weekly: `Green` Monthly: `Red` | Customizable colors for each timeframe. |
| **Line Style** | `Solid` | Options: Solid, Dashed, Dotted. |
| **Line Width** | `1` | Thickness of the plotted lines. |
| **Extend Line** | `1` | Controls how far the highs/lows extend into the future. |
| **Display Price Labels** | `Enabled` | Shows price labels on each level. |
---
### **🛠️ How to Use It**
- **Enable/disable different timeframes** based on your strategy.
- **Customize colors, line styles, and widths** to match your charting style.
- **Use extended lines to identify support & resistance zones.**
- **Watch price reactions at these levels** for potential entries, exits, and stop-loss placements.
---
### **🚀 Final Thoughts**
The **HL-MWD Indicator** is a **powerful multi-timeframe tool** that helps traders **visualize key support & resistance levels** from higher timeframes on an intraday chart.
⚠️ **However, TradingView’s lookback limits apply—so for longer-term levels, higher timeframes are recommended.**
📌 **Now published for the community!** Let me know if you need any last-minute tweaks! 🔥
Educational

Range Filter Buy and Sell 5minThis Range Filter Buy and Sell Indicator is designed for a 5-minute chart but can be customized for other assets by adjusting the parameters. It utilizes a range-based filtering mechanism to identify potential buy and sell opportunities based on price movement relative to a dynamic range

autotrade.it DCA bot Emulator
DCA Bot Emulator – Modified Version
This script is originally created by ericlin0122. Full credit goes to the original author for developing the core strategy.
Link:
🔹 What I Modified:
I have added an alert system to integrate this strategy with my third-party tool, allowing for automated execution of trades. I also add to have choice to where to start trade
🔹 Disclaimer:
This strategy is for educational purposes only and should not be considered financial advice. Please use it at your own risk.

Multi-Timeframe ATR MonitorShows multiple time frame ATR's. Specifically the 1,3,5,15,60 and daily ATR's of the security you are looking at. Works best on indexes and stocks or anything that trades out 2 decimals.

RSI, PGO, EMA StrategyCombination of RsI Cross Over Above 50 , Pgo Crossover above 0 Ema For Trend-following, Atr is tsl 1% .

XGBoost Approximation Indicator with HTF Filter Ver. 3.2XGBoost Approx Indicator with Higher Timeframe Filter Ver. 3.2
What It Is
The XGBoost Approx Indicator is a technical analysis tool designed to generate trading signals based on a composite of multiple indicators. It combines Simple Moving Average (SMA), Relative Strength Index (RSI), MACD, Rate of Change (ROC), and Volume to create a composite indicator score. Additionally, it incorporates a higher timeframe filter (HTF) to enhance trend confirmation and reduce false signals.
This indicator helps traders identify long (buy) and short (sell) opportunities based on a weighted combination of trend-following and momentum indicators.
How to Use It Properly
Setup and Configuration:
Add the indicator to your TradingView chart.
Customize input settings based on your trading strategy. Key configurable inputs include:
HTF filter (default: 1-hour)
SMA, RSI, MACD, and ROC lengths
Custom weightings for each component
Thresholds for buy and sell signals
Understanding the Signals:
Green "Long" Label: Appears when the composite indicator crosses above the buy threshold, signaling a potential buy opportunity.
Red "Short" Label: Appears when the composite indicator crosses below the sell threshold, signaling a potential sell opportunity.
These signals are filtered by a higher timeframe SMA trend to improve accuracy.
Alerts:
The indicator provides alert conditions for long and short entries.
Traders can enable alerts in TradingView to receive real-time notifications when a new signal is triggered.
Safety and Best Practices
Use in Conjunction with Other Analysis: Do not rely solely on this indicator. Combine it with price action, support/resistance levels, and fundamental analysis for better decision-making.
Adjust Settings for Your Strategy: The default settings may not suit all markets or timeframes. Test different configurations before trading live.
Backtest Before Using in Live Trading: Evaluate the indicator’s past performance on historical data to assess its effectiveness in different market conditions.
Avoid Overtrading: False signals can occur, especially in low volatility or choppy markets. Use additional confirmation (e.g., trendlines or moving averages).
Risk Management: Always set stop-loss levels and position sizes to limit potential losses.

ATR Percentages BoxThis custom indicator provides a quick visual reference for volatility-based price ranges, directly on your TradingView charts. It calculates and displays three ranges derived from the Daily Average True Range (ATR) with a standard 14-period setting:
5 Min (3% ATR): Ideal for very short-term scalping and quick intraday moves.
1 Hour (5% ATR): Useful for hourly setups, short-term trades, and intraday volatility assessment.
Day (10% ATR): Perfect for daily volatility context, swing trades, or placing stops and targets.
The ranges are clearly shown in a compact box at the top-right corner, providing traders immediate insights into realistic price movements, helping to optimise entries, stops, and profit targets efficiently.

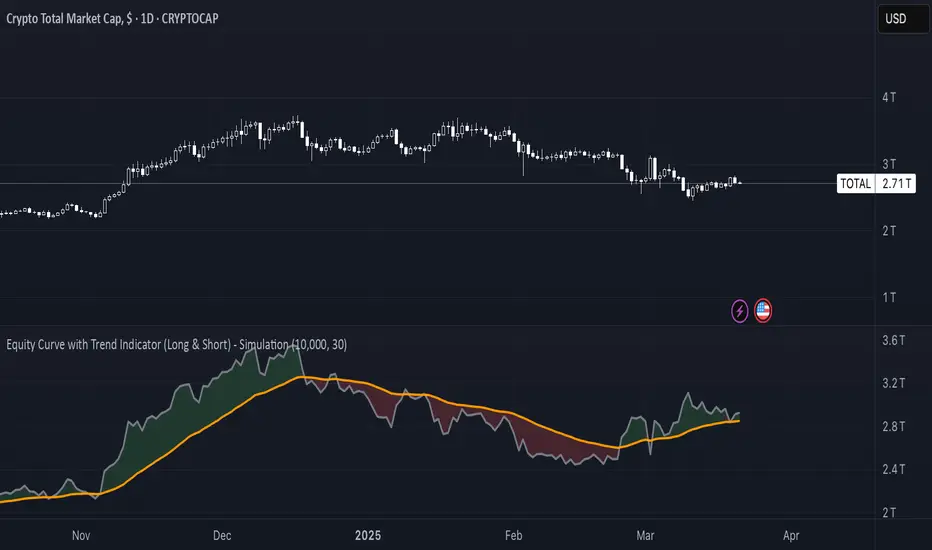
Equity Curve with Trend Indicator (Long & Short) - SimulationOverview:
Market Regime Detector via Virtual Equity Curve is a unique indicator that simulates the performance of a trend-following trading system—incorporating both long and short trades—to help you identify prevailing market regimes. By generating a “virtual equity” curve based on simple trend signals and applying trend analysis directly on that curve, this indicator visually differentiates trending regimes from mean-reverting (or sideways) periods. The result is an intuitive display where green areas indicate a trending (bullish) regime (i.e., where trend-following strategies are likely to perform well) and red areas indicate a mean-reverting (bearish) regime.
Features:
Simulated Trade Performance:
Uses a built-in trend-following logic (a simple 10/50 SMA crossover example) to simulate both long and short trades. This simulation creates a virtual equity curve that reflects the cumulative performance of the system over time.
Equity Trend Analysis:
Applies an Exponential Moving Average (EMA) to the simulated equity curve to filter short-term noise. The EMA acts as a trend filter, enabling the indicator to determine if the equity curve is in an upward (trending) or downward (mean-reverting) phase.
Dynamic Visual Regime Detection:
Fills the area between the equity curve and its EMA with green when the equity is above the EMA (indicating a healthy trending regime) and red when below (indicating a mean-reverting or underperforming regime).
Customizable Parameters:
Easily adjust the initial capital, the length of the equity EMA, and other settings to tailor the simulation and visual output to your trading style and market preferences.
How It Works:
Trade Simulation:
The indicator generates trading signals using a simple SMA crossover:
When the 10-period SMA is above the 50-period SMA, it simulates a long entry.
When the 10-period SMA is below the 50-period SMA, it simulates a short entry. The virtual equity is updated bar-by-bar based on these simulated positions.
Equity Trend Filtering:
An EMA is calculated on the simulated equity curve to smooth out fluctuations. The relative position of the equity curve versus its EMA is then used as a proxy for the market regime:
Bullish Regime: Equity is above its EMA → fill area in green.
Bearish Regime: Equity is below its EMA → fill area in red.
Visualization:
The indicator plots:
A gray line representing the simulated equity curve.
An orange line for the EMA of the equity curve.
A dynamic fill between the two lines, colored green or red based on the prevailing regime.
Inputs & Customization:
Initial Capital: Set your starting virtual account balance (default: 10,000 USD).
Equity EMA Length: Specify the lookback period for the EMA applied to the equity curve (default: 30).
Trend Signal Logic:
The current implementation uses a simple SMA crossover for demonstration purposes. Users can modify or replace this logic with their own trend-following indicator to tailor the simulation further.
EMA Scalping - No Stop LossStrateji Özeti: EMA Scalping - Zararı Durdurmak Yok
Genel Amaç
Bu strateji, altcoinlerde 1 ve 5 dakikalık zaman aralığında scalping yapmak için tasarlandı.
Hedefi:
1- Sinyal Sayısını Makul Tutmak: Çok az veya çok fazla sinyal değil, dengeli bir sıklık.
2- Kaybedilen İşlemleri Azaltmak: Yanlış açma filtreleyerek kârlı çıkış verimini artırmak.
3- Kafa Karışıklığını Önlemek: Stop-loss olmadan sade bir giriş-çıkış yapısı sunar.
Temel Mantık
1- EMA Kesişimi: Fiyat, 13 dönemlik EMA'yı yukarı veya aşağı kestiğinde sinyallerle üretildi.
2- Güçlü Filtreler: ADX, hacim ve mum bağlantılarıyla yalnızca güvenilir hareketlerde işlem yapılır.
3- Kâr Hedefi: ATR tabanlı bir hedefle pozisyonlar kârlı kapanır; zararı durdurma yoktur.
Ne Olunca Almalıyım?
Koşullar:
1- Fiyat, 13 EMA'yı yukarı keser (fiyat EMA'nın üstüne çıkar).
Mum yeşil kapanır (kapanış > açılış), yani yükseliş onaylanır.
2- ADX > 30: Güçlü bir trend olduğunu gösterir.
Hacim 1.5x MA'dan büyük: Hareketin hacimle desteklenmesi doğrular.
Kısa pozisyon yoksa.
3- Grafik: Yeşil "AL" üçgeni göründüğünde uzun pozisyonlarda açılıyor.
Kâr Hedefi: Giriş fiyatı + (ATR * 1,5).
Türkçe: Örnek:
Fiyat: 0.001, EMA: 0.00099
Mum yeşili kapanır (0,001 > 0,00099)
ADX: 32, Hacim: 1.5x
Giriş: 0,001, Kâr Hedefi: 0,00115 (ATR = 0,0001)
Ne Olunca Satmalıyım?
Koşullar:
1- Fiyat, 13 EMA'yı aşağı keser (fiyat EMA'nın adına iner).
Mum kırmızı kapanır (kapanış < açılış), yani düşüş onaylanır.
ADX > 30: Güçlü bir trend olduğunu gösterir.
2- Hacim 1.5x MA'dan büyük: Hareketin hacimle desteklenmesi doğrular.
Uzun pozisyon yoksa.
3- Grafik: Kırmızı "SAT" üçgeni göründüğünde kısa pozisyonda açılıyor.
Kâr Hedefi: Giriş fiyatı - (ATR * 1,5).
Türkçe: Örnek:
Fiyat: 0.0009, EMA: 0.00091
Anne kırmızısı kapanır (0,0009 < 0,00091)
ADX: 31, Hacim: 1.5x
Giriş: 0,0009, Kâr Hedefi: 0,00075 (ATR = 0,0001)
Ne Olunca Çıkma mı?
1- Uzun Pozisyon: Fiyat, kâr hedefine (giriş + ATR*1.5) ulaşırsa biter.
2- Kısa Pozisyon: Fiyat, kâr hedefine (giriş - ATR *1.5) ulaşırsa biter.
Not: Zararı durdurma yok; Ücretler kâr hedefi vurulana kadar açık kalır. Ters yöndeki büyük hareketlerde manuel kapatmayı düşünebilirsiniz.
Türkçe: Örnek:
Uzun: Giriş 0.001, Kâr Hedefi 0.00115 → Fiyat 0.00115'e ulaşırsa kapanır.
Kısa: Giriş 0.0009, Kâr Hedefi 0.00075 → Fiyat 0.00075'e ulaşırsa kapanır.
Stratejinin Özellikleri
Giriş Koşulları:
1- EMA 13: Fiyatın trend belirleyicisi.
Yeşil/Kırmızı Anne: Kesişimin gücü doğrular.
2- ADX > 30: Zayıf trendleri eleyerek dayanıklılığı arttırır.
Hacim 1.5x: Güçlü momentumu garanti eder.
3- Pozisyon Kontrolü: Aynı ve uzun ve kısa pozisyon açılmaz.
Çıkış Koşulları:
Sadece kâr hedefi (ATR*1.5) ile kapanır.
Zararı durdurma olmadığı için sade ve öngörülebilir.
Avantajlar:
1- Yanlış ayırmalar, kaybedilen işlem miktarının düşmesi.
2- Scalping için yeterli sinyal üretir.
3- Kafa karışıklığını önler.
Riskli:
Stop-loss olmaması, ters yöndeki büyük hareketlerdeki pozisyonların açık dağılımının nedeni olabilir. Manuel izleme önerilir.

SMA 150 & SMA 200Simple SMA150 (blue) and SMA200 (red). Use this to identify if the stock is at which stage.

EDGE MIX with FVG [Edge]The "EDGE MIX with FVG" indicator is a versatile tool designed to provide traders with valuable insights into price momentum and acceleration. By harnessing the power of mathematics and visualization, this indicator helps traders make informed decisions in the fast-paced world of financial markets.

1H EMA 200 + 15M Supertrend Strategy This strategy is a **multi-timeframe trend-following strategy** that uses the **200 EMA on the 1-hour chart** for trend confirmation and the **Supertrend indicator on the 15-minute chart** for entry signals. Here’s a brief description of how it works:
---
### **Key Components**
1. **Trend Confirmation (1-Hour Chart)**:
- The **200 EMA** is used to determine the overall trend.
- **Buy Signal**: Price is above the 200 EMA (uptrend).
- **Sell Signal**: Price is below the 200 EMA (downtrend).
2. **Entry Signal (15-Minute Chart)**:
- The **Supertrend indicator** is used to generate entry signals.
- **Buy Signal**: Supertrend is in an uptrend (green).
- **Sell Signal**: Supertrend is in a downtrend (red).
3. **Stop-Loss and Take-Profit**:
- **Stop-Loss**: Fixed at the Supertrend value at the time of entry.
- **Take-Profit**: 1.5x the distance between the entry price and the stop-loss.
4. **Trade Management**:
- The strategy **closes the previous trade** whenever a new signal is generated, ensuring only one trade is active at a time.
---
### **How It Works**
1. **Buy Setup**:
- Price is above the 200 EMA (1-hour chart).
- Supertrend is green (15-minute chart).
- A buy trade is opened with:
- **Stop-Loss**: Supertrend value at entry.
- **Take-Profit**: 1.5x the distance between the entry price and the stop-loss.
2. **Sell Setup**:
- Price is below the 200 EMA (1-hour chart).
- Supertrend is red (15-minute chart).
- A sell trade is opened with:
- **Stop-Loss**: Supertrend value at entry.
- **Take-Profit**: 1.5x the distance between the stop-loss and the entry price.
3. **Trade Exit**:
- The trade is closed when either the **stop-loss** or **take-profit** is hit.
- If a new signal is generated, the previous trade is closed, and a new trade is opened.
---
### **Example**
- **Buy Trade**:
- Entry Price: $100
- Supertrend (Stop-Loss): $98
- Take-Profit: $100 + 1.5 * ($100 - $98) = $103
- **Sell Trade**:
- Entry Price: $100
- Supertrend (Stop-Loss): $102
- Take-Profit: $100 - 1.5 * ($102 - $100) = $97
---
### **Advantages**
- **Trend-Following**: Trades in the direction of the higher timeframe trend.
- **Clear Entry Signals**: Uses Supertrend for precise entries.
- **Risk Management**: Fixed stop-loss and take-profit levels based on Supertrend.
---
### **Customization**
- Adjust the **ATR length** and **factor** in the Supertrend settings.
- Modify the **take-profit multiplier** (e.g., 2x SL) if needed.
---
This strategy is designed to capture trends while managing risk effectively. Let me know if you need further adjustments! 🚀


ROHIT Smart Money ConceptsThis all-in-one indicator displays real-time market structure (internal & swing BOS / CHoCH), order blocks, premium & discount zones, equal highs & lows, and much more...allowing traders to automatically mark up their charts with widely used price action methodologies. Following the release of our Fair Value Gap script, we received numerous requests from our community to release more features in the same category.
"Smart Money Concepts" (SMC) is a fairly new yet widely used term amongst price action traders looking to more accurately navigate liquidity & find more optimal points of interest in the market. Trying to determine where institutional market participants have orders placed (buy or sell side liquidity) can be a very reasonable approach to finding more practical entries & exits based on price action.
The indicator includes alerts for the presence of swing structures and many other relevant conditions.
Features
This indicator includes many features relevant to SMC, these are highlighted below:
Full internal & swing market structure labeling in real-time
Break of Structure (BOS)
Change of Character (CHoCH)
Order Blocks (bullish & bearish)
Equal Highs & Lows
Fair Value Gap Detection
Previous Highs & Lows
Premium & Discount Zones as a range
Options to style the indicator to more easily display these concepts
Settings
Mode: Allows the user to select Historical (default) or Present, which displays only recent data on the chart.
Style: Allows the user to select different styling for the entire indicator between Colored (default) and Monochrome.
Color Candles: Plots candles based on the internal & swing structures from within the indicator on the chart.
Internal Structure: Displays the internal structure labels & dashed lines to represent them. (BOS & CHoCH).
Confluence Filter: Filter non-significant internal structure breakouts.
Swing Structure: Displays the swing structure labels & solid lines on the chart (larger BOS & CHoCH labels).
Swing Points: Displays swing points labels on chart such as HH, HL, LH, LL.
Internal Order Blocks: Enables Internal Order Blocks & allows the user to select how many most recent Internal Order Blocks appear on the chart.
Swing Order Blocks: Enables Swing Order Blocks & allows the user to select how many most recent Swing Order Blocks appear on the chart.
Equal Highs & Lows: Displays EQH/EQL labels on chart for detecting equal highs & lows.
Bars Confirmation: Allows the user to select how many bars are needed to confirm an EQH/EQL symbol on chart.
Fair Value Gaps: Displays boxes to highlight imbalance areas on the chart.
Auto Threshold: Filter out non-significant fair value gaps.
Timeframe: Allows the user to select the timeframe for the Fair Value Gap detection.
Extend FVG: Allows the user to choose how many bars to extend the Fair Value Gap boxes on the chart.
Highs & Lows MTF: Allows the user to display previous highs & lows from daily, weekly, & monthly timeframes as significant levels.
Premium/Discount Zones: Allows the user to display Premium, Discount, and Equilibrium zones on the chart

Enhanced Trade Calculator**Enhanced Trade Calculator for TradingView**
### Description
The Enhanced Trade Calculator is designed to simplify your trade management by calculating optimal position sizes, stop loss levels, and target prices directly on your TradingView chart. This indicator helps traders control risk efficiently and adhere to proper money management principles.
### Key Features
- **Shares to Buy**: Calculates the number of shares to purchase based on your account size and desired allocation percentage.
- **Stop Loss Price**: Automatically determines the ideal stop loss level based on either a fixed percentage risk or an ATR-based calculation for dynamic volatility management.
- **Target Price (2:1 RRR)**: Suggests a target price to achieve a 2:1 risk-to-reward ratio.
- **Customizable Inputs**: Easily adjust your account size, risk percentage, and allocation percentage to fit your trading strategy.
### How to Use
1. **Configure Your Settings**
- Enter your **Account Size**.
- Set your **Risk %** (e.g., 1% or 2%).
- Define your **Allocation %** (e.g., 10% of your account per trade).
- Choose whether to use **ATR for Stop Loss** for dynamic risk management or a fixed percentage-based stop loss.
3. **Interpreting the Table**
- **Current Price**: Displays the latest price of the selected asset.
- **Shares to Buy**: Shows the calculated number of shares to purchase.
- **Stop Loss Price**: Indicates where your stop loss should be placed to limit potential losses.
- **Target Price**: Suggests a 2:1 risk-to-reward target for taking profit.
### Recommended Usage
- Ideal for swing traders, position traders, and investors who want a clear, calculated approach to trade entry and risk management.
### Notes
- The indicator does not execute trades but is designed to provide precise calculations to assist in your decision-making.
- For optimal results, combine this indicator with your preferred technical analysis strategy.

Scalping 3min ETH/BTC//Charlie g 385
//@version=6
indicator("Scalping 3min ETH/BTC", overlay=true)
// Input Parameters
stochastic_length = input(5, title="Stochastic Length")
stochastic_smoothK = input(2, title="Stochastic %K Smoothing")
stochastic_smoothD = input(2, title="Stochastic %D Smoothing")
rsi_length = input(7, title="RSI Length")
atr_length = input(14, title="ATR Length")
fib_lookback = input(30, title="Fibonacci Lookback")
// Calculate Indicators
raw_k = ta.stoch(high, low, close, stochastic_length)
k = ta.sma(raw_k, stochastic_smoothK)
d = ta.sma(k, stochastic_smoothD)
rsi = ta.rsi(close, rsi_length)
atr = ta.atr(atr_length)
ma200 = ta.sma(close, 30) // Média móvel de 200 períodos para tendência bullish
// Fibonacci Levels
lowest_low = ta.lowest(low, fib_lookback)
highest_high = ta.highest(high, fib_lookback)
rangy = highest_high - lowest_low
fib_levels = array.new_float(0)
array.push(fib_levels, lowest_low + 0.236 * rangy)
array.push(fib_levels, lowest_low + 0.382 * rangy)
array.push(fib_levels, lowest_low + 0.5 * rangy)
array.push(fib_levels, lowest_low + 0.618 * rangy)
array.push(fib_levels, lowest_low + 0.786 * rangy)
// Check if close is near a Fibonacci level
near_fib = false
for i = 0 to array.size(fib_levels) - 1
level = array.get(fib_levels, i)
if math.abs(close - level) < 0.5 * atr
near_fib := true
break
// Detect Stochastic Crossovers
cross_above = ta.crossover(k, d)
cross_below = ta.crossunder(k, d)
// Generate Trading Signals
buy_signal = near_fib and cross_above and (rsi > 30)
sell_signal = near_fib and cross_below and (rsi < 70)
// Plot Buy and Sell Signals
plotshape(series=buy_signal, title="Buy Signal", style=shape.triangleup, location=location.belowbar, color=color.green, size=size.small)
plotshape(series=sell_signal, title="Sell Signal", style=shape.triangledown, location=location.abovebar, color=color.red, size=size.small)
// Entry, Exit, and Stop-Loss Logic
var bool inPosition = false // Rastreia se estamos em uma posição
var float entryPrice = na // Armazena o preço de entrada
var float stopLoss = na // Armazena o stop loss atual
if buy_signal
inPosition := true
entryPrice := close
stopLoss := close * (1 - 0.0025) // Stop Loss inicial: 0,25% abaixo do preço de entrada
if inPosition
// Verificar se o stop loss foi atingido
if low <= stopLoss
inPosition := false
alert("SELL_STOP_LOSS;" + str.tostring(stopLoss), alert.freq_once_per_bar_close)
// Verificar se o alvo de lucro foi atingido (5% ou mais)
else if high >= entryPrice * 1.05
if close > ma200 // Tendência Bullish
// Ajustar stop loss para 0,25% abaixo do preço atual, se maior
newStopLoss = close * (1 - 0.0025)
if newStopLoss > stopLoss
stopLoss := newStopLoss
alert("ADJUST_STOP;" + str.tostring(stopLoss), alert.freq_once_per_bar_close)
else
inPosition := false
alert("SELL_PROFIT;" + str.tostring(entryPrice * 1.05), alert.freq_once_per_bar_close)
// Plot Entry Price Text
if buy_signal
label.new(bar_index, low, "BUY: " + str.tostring(entryPrice), color=color.black, textcolor=color.rgb(0, 255, 136), style=label.style_label_up)
// Plot Exit Price Text
if sell_signal
label.new(bar_index, high, "SELL: " + str.tostring(close), color=color.black, textcolor=color.rgb(255, 0, 0), style=label.style_label_down)
// Plot Stop-Loss Text
if buy_signal
label.new(bar_index, low, "SL: " + str.tostring(stopLoss), color=color.black, textcolor=color.rgb(255, 123, 0), style=label.style_label_up, yloc=yloc.belowbar)
// Take Profit Logic (mantido para visualização)
tp2 = entryPrice * 1.005
tp4 = entryPrice * 1.01
tp6 = entryPrice * 1.02
tp8 = entryPrice * 1.03
tp10 = entryPrice * 1.04
tp2_hit = not na(entryPrice) and ta.crossover(high, tp2)
tp4_hit = not na(entryPrice) and ta.crossover(high, tp4)
tp6_hit = not na(entryPrice) and ta.crossover(high, tp6)
tp8_hit = not na(entryPrice) and ta.crossover(high, tp8)
tp10_hit = not na(entryPrice) and ta.crossover(high, tp10)
// Plot Take Profit Signals
plotshape(series=tp2_hit, title="TP 0.05%", style=shape.labeldown, location=location.abovebar, color=color.rgb(243, 187, 33), size=size.small, text="TP 2%")
plotshape(series=tp4_hit, title="TP 1%", style=shape.labeldown, location=location.abovebar, color=color.rgb(51, 243, 33), size=size.small, text="TP 4%")
plotshape(series=tp6_hit, title="TP 2%", style=shape.labeldown, location=location.abovebar, color=color.rgb(180, 243, 33), size=size.small, text="TP 6%")
plotshape(series=tp8_hit, title="TP 3%", style=shape.labeldown, location=location.abovebar, color=color.rgb(33, 184, 243), size=size.small, text="TP 8%")
plotshape(series=tp10_hit, title="TP 4%", style=shape.labeldown, location=location.abovebar, color=color.rgb(236, 33, 243), size=size.small, text="TP 10%")
// Alert Logic
if buy_signal
alert("BUY;" + str.tostring(close), alert.freq_once_per_bar_close)
if sell_signal
alert("SELL;" + str.tostring(close), alert.freq_once_per_bar_close)
if tp2_hit
alert("TP1/2;" + str.tostring(tp2), alert.freq_once_per_bar_close)
if tp4_hit
alert("TP1" + str.tostring(tp4), alert.freq_once_per_bar_close)
if tp6_hit
alert("TP2;" + str.tostring(tp6), alert.freq_once_per_bar_close)
if tp8_hit
alert("TP3;" + str.tostring(tp8), alert.freq_once_per_bar_close)
if tp10_hit
alert("TP4;" + str.tostring(tp10), alert.freq_once_per_bar_close)

ESTX50 Relative Strength Screener: 5M & 1DRelative Strength screener for trading the Euro STOXX 50 market.

Scalping 3min ETH/BTC - Stoch RSI Fibonacci//@version=6
indicator("Scalping 3min ETH/BTC - Stoch RSI Fibonacci", overlay=true)
// Input Parameters
stochastic_length = input(5, title="Stochastic Length")
stochastic_smoothK = input(2, title="Stochastic %K Smoothing")
stochastic_smoothD = input(2, title="Stochastic %D Smoothing")
rsi_length = input(7, title="RSI Length")
atr_length = input(14, title="ATR Length")
fib_lookback = input(30, title="Fibonacci Lookback")
// Calculate Indicators
raw_k = ta.stoch(high, low, close, stochastic_length)
k = ta.sma(raw_k, stochastic_smoothK)
d = ta.sma(k, stochastic_smoothD)
rsi = ta.rsi(close, rsi_length)
atr = ta.atr(atr_length)
// Fibonacci Levels
lowest_low = ta.lowest(low, fib_lookback)
highest_high = ta.highest(high, fib_lookback)
rangy = highest_high - lowest_low
fib_levels = array.new_float(0)
array.push(fib_levels, lowest_low + 0.236 * rangy)
array.push(fib_levels, lowest_low + 0.382 * rangy)
array.push(fib_levels, lowest_low + 0.5 * rangy)
array.push(fib_levels, lowest_low + 0.618 * rangy)
array.push(fib_levels, lowest_low + 0.786 * rangy)
// Check if close is near a Fibonacci level
near_fib = false
for i = 0 to array.size(fib_levels) - 1
level = array.get(fib_levels, i)
if math.abs(close - level) < 0.5 * atr
near_fib := true
break
// Detect Stochastic Crossovers
cross_above = ta.crossover(k, d)
cross_below = ta.crossunder(k, d)
// Generate Trading Signals
buy_signal = near_fib and cross_above and (rsi > 30)
sell_signal = near_fib and cross_below and (rsi < 70)
// Plot Signals
plotshape(series=buy_signal, title="Buy Signal", style=shape.triangleup, location=location.belowbar, color=color.green, size=size.small)
plotshape(series=sell_signal, title="Sell Signal", style=shape.triangledown, location=location.abovebar, color=color.red, size=size.small)
// Take Profit Logic
var float entryPrice = na
if buy_signal
entryPrice := close
tp2 = entryPrice * 1.02
tp4 = entryPrice * 1.04
tp6 = entryPrice * 1.06
tp8 = entryPrice * 1.08
tp10 = entryPrice * 1.10
tp2_hit = not na(entryPrice) and ta.crossover(high, tp2)
tp4_hit = not na(entryPrice) and ta.crossover(high, tp4)
tp6_hit = not na(entryPrice) and ta.crossover(high, tp6)
tp8_hit = not na(entryPrice) and ta.crossover(high, tp8)
tp10_hit = not na(entryPrice) and ta.crossover(high, tp10)
// Plot Take Profit Signals
plotshape(series=tp2_hit, title="TP 2%", style=shape.labeldown, location=location.abovebar, color=color.rgb(243, 187, 33), size=size.small, text="TP 2%")
plotshape(series=tp4_hit, title="TP 4%", style=shape.labeldown, location=location.abovebar, color=color.rgb(51, 243, 33), size=size.small, text="TP 4%")
plotshape(series=tp6_hit, title="TP 6%", style=shape.labeldown, location=location.abovebar, color=color.rgb(180, 243, 33), size=size.small, text="TP 6%")
plotshape(series=tp8_hit, title="TP 8%", style=shape.labeldown, location=location.abovebar, color=color.rgb(33, 184, 243), size=size.small, text="TP 8%")
plotshape(series=tp10_hit, title="TP 10%", style=shape.labeldown, location=location.abovebar, color=color.rgb(236, 33, 243), size=size.small, text="TP 10%")
// Alert Logic
if buy_signal
alert("BUY;" + str.tostring(close), alert.freq_once_per_bar_close)
if sell_signal
alert("SELL;" + str.tostring(close), alert.freq_once_per_bar_close)
if tp2_hit
alert("TP2;" + str.tostring(tp2), alert.freq_once_per_bar_close)
if tp4_hit
alert("TP4;" + str.tostring(tp4), alert.freq_once_per_bar_close)
if tp6_hit
alert("TP6;" + str.tostring(tp6), alert.freq_once_per_bar_close)
if tp8_hit
alert("TP8;" + str.tostring(tp8), alert.freq_once_per_bar_close)
if tp10_hit
alert("TP10;" + str.tostring(tp10), alert.freq_once_per_bar_close)

EMA & Bollinger BandsMulti EMA with bollinger band using 2.1 as the SD for the bands. This moving averages are used as support and resistances in the chart in various timeframes to do chart analysis.
This is an open code for everyone

RSI (Wilder's)RSI calculated using the original method proposed by J. Wilders.
Its the correct way to calculate RSI and not what is available freely in softwares


LF-Free Trend MasterLF-Free Trend Master is a powerful trading indicator that combines multiple techniques, including TMA (Triangular Moving Average), AlphaTrend, and HLC Cloud, to help traders identify trends, entry points, and risk management strategies effectively.
🔹 Key Features:
✅ HLC Cloud: Identifies support and resistance zones based on historical highs and lows.
✅ TMA Bands: Uses a triangular moving average to filter market noise and detect the primary trend.
✅ AlphaTrend Signal: Helps spot trend reversals and momentum-based trade signals.
✅ Risk Management System: Automatically suggests Stop Loss (SL) and Take Profit (TP) levels based on ATR.
✅ Session Analysis: Highlights major trading sessions (London, New York, Tokyo, Sydney) to optimize trading strategies based on market volatility.
🔹 How It Works:
📌 A Buy Signal (▲) appears when the indicator detects a strong bullish trend, along with recommended SL & TP levels.
📌 A Sell Signal (▼) is triggered when the system identifies a bearish trend, providing optimal entry and exit points.
📌 The TMA Bands Color helps traders recognize trend direction:
Green = Uptrend
Red = Downtrend
📌 Trading sessions are highlighted to show the most volatile periods for better trade timing.
🔹 Why Choose LF-Free Trend Master?
✔️ Reduces market noise and filters out false signals.
✔️ Clearly defines trend directions for easier decision-making.
✔️ Provides automatic entry, exit, and risk management recommendations.
✔️ Helps traders optimize strategies based on trading sessions.
LF-Free Trend Master is ideal for trend-following and reversal traders. Test it in a demo environment before applying it to live trading for the best results! 🚀
