Moving Average DistanceLook at the chart bars as they relate to distance from a specified moving average.
You can pick from SMA/EMA/etc.
I am publishing this due to a request from a user to make code modifications.
I tried to just open source the original closed-source version, but it doesn't let me do that. So I am publishing it again as a new release with the source code available.
Enjoy!
Exponential Moving Average (EMA)

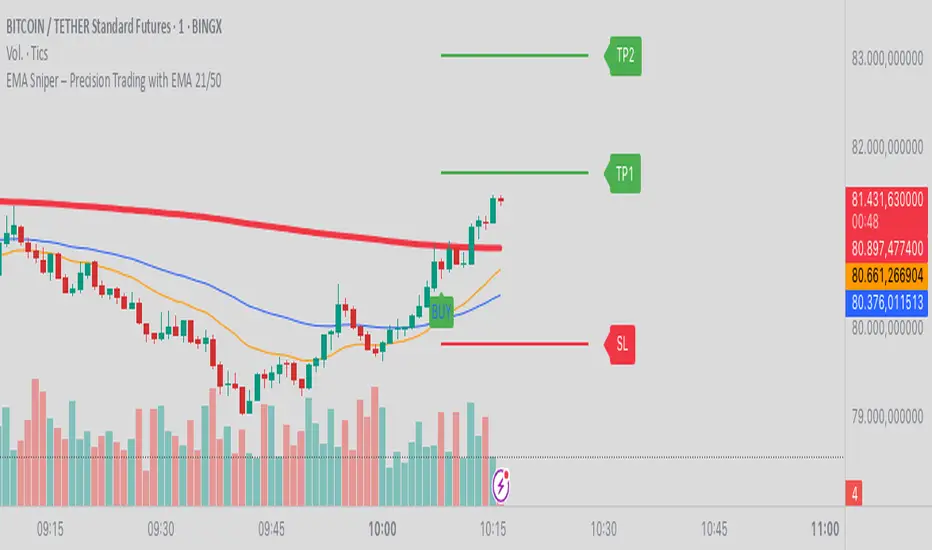
EMA Sniper – Precision Trading with EMA 21/50Title: EMA Sniper – Precision Trading with EMA 21/50
Description:
🚀 EMA Sniper is a powerful trading tool designed to identify trend shifts with precision using the EMA 21/50 crossover, while also displaying Stop Loss (SL) and Take Profit (TP) levels directly on the chart.
🔹 Features:
✅ EMA 21/50 Crossover Signals – Buy signals appear when EMA 21 crosses above EMA 50, and sell signals appear when EMA 21 crosses below EMA 50.
✅ Smart Stop Loss & Take Profit – SL is dynamically placed below/above EMA 50 for optimized risk management, while TP follows a 2:1 risk/reward ratio.
✅ Clear Visual Alerts – The indicator plots SL and TP levels as lines on the chart, along with buy and sell markers for quick decision-making.
✅ Multi-Market & Multi-Timeframe – Works across forex, crypto, stocks, and indices on any timeframe.
🚀 Perfect for traders looking for a structured approach to trend-based trading!
Let me know if you’d like any modifications! 🔥
Estrategia EMA - Única señal por cambio de tendenciaOperar solo cuando aparesca la Señal y colocar SL en el ultimo hight y o ultimo Low

Combined EMA Technical Analysis + Entry SignalsThe script, titled "Combined EMA Technical Analysis + Entry Signals", is an overlay indicator that integrates several popular technical indicators and visual tools to assist traders in analyzing price action and identifying potential entry points. Here's a breakdown of its key features:
1. Exponential Moving Averages (EMAs)
EMAs Calculated: 8, 9, 20, 21, and 50-period EMAs.
Customization: Users can adjust the colors of each EMA via input settings (e.g., ema8Color, ema9Color).
Visualization: Plots the EMAs on the chart with customizable colors and linewidths.
Crossovers: Detects bullish (upward) and bearish (downward) crosses between:
EMA 8 and EMA 20.
EMA 9 and EMA 21.
Signals: Marks crossover points with green (bullish) or red (bearish) circles on the chart.
2. Volume Weighted Average Price (VWAP)
Calculation: Computes a daily VWAP based on the typical price (high + low + close) / 3 multiplied by volume, reset each day.
Color Coding:
Green if the current price is above VWAP (bullish).
Red if below VWAP (bearish).
White if equal to VWAP.
Crossovers: Plots green/red circles when the price crosses above/below the VWAP.
3. Current Price Display
Feature: Optionally displays the current price as a dotted horizontal line and a label.
Color Coding: Green if the candle is bullish (close ≥ open), red if bearish.
Position: Updates dynamically on the last bar.
4. Additional Technical Indicators
RSI (Relative Strength Index):
Length: Customizable (default 14).
Overbought/Oversold Levels: Default 70/30, adjustable.
Displayed in a table with color-coded states (red for overbought, green for oversold, gray for neutral).
MACD (Moving Average Convergence Divergence):
Parameters: Short EMA (12), Long EMA (26), Signal Line (9), all adjustable.
Displays "Bullish" (green) or "Bearish" (red) based on MACD line vs. signal line.
Tracks crosses above/below the zero line with color-coded states.
PSAR (Parabolic Stop and Reverse):
Parameters: Start (0.02), Increment (0.02), Maximum (0.2).
Plots as circles on the chart, colored green (bullish) or red (bearish) based on price position relative to PSAR.
5. Market Flow Visualization
Time-Based Lines:
Vertical lines at 10:00 AM and 10:30 AM (Eastern Time) with customizable colors, widths, and styles (solid, dashed, dotted).
Shaded Areas:
9:30 AM - 10:00 AM (orange shade by default).
10:00 AM - 10:30 AM (purple shade by default).
Purpose: Highlights key time periods in the trading day (e.g., market open and early momentum phases).
6. Entry Signals (Opposite Candle Logic)
EMA Cross Detection: Monitors 9/21 and 8/20 EMA crosses.
Opposite Candle Confirmation:
After a bullish cross (e.g., EMA 9 > EMA 21), waits for a red candle (close < open) on a user-defined timeframe (default 2 minutes).
After a bearish cross, waits for a green candle (close > open).
Visualization: Marks these entry points with a red cross below the bar (bullish signal) or green cross above the bar (bearish signal).
Alerts: Triggers alert messages when these conditions are met, e.g., "EMA 9/21 Bullish Cross - First Opposite Candle Closed!"
7. Table Display
Location: Customizable (e.g., "Bottom Right", "Top Left").
Text Size: Adjustable (Auto, Normal, Small, Tiny).
Content: Summarizes the state of various indicators:
EMA 8/20: Bullish (green) if EMA 8 > EMA 20, Bearish (red) otherwise.
EMA 9/21: Bullish (green) if EMA 9 > EMA 21, Bearish (red) otherwise.
EMA 50: Bullish (green) if price > EMA 50, Bearish (red) otherwise.
VWAP: Bullish (green) if price > VWAP, Bearish (red) otherwise.
MACD: Bullish (green) or Bearish (red) based on MACD vs. signal line.
MACD Zero: Bullish (green) or Bearish (red) based on zero-line crosses.
PSAR: Bullish (green) if price > PSAR, Bearish (red) otherwise.
RSI: Overbought (red), Oversold (green), or numeric value (gray).
Toggle Options: Users can show/hide each row.
How to Use This Indicator
Add to TradingView: Copy the script into TradingView's Pine Script editor and save it.
Customize Settings: Adjust colors, timeframes, and table options via the indicator's settings menu.
Interpret Signals:
Watch for EMA crossovers and opposite candle confirmations for entry points.
Use the table to quickly assess the overall trend across multiple indicators.
Monitor VWAP and time-based shading for context during the trading session.
Set Alerts: Enable alerts for EMA crosses or opposite candle signals to automate notifications.

Fibonacci Retracement & EMA Alert (Higher Highs & Lower Lows)So this indicator is based on the following.
it is made to be used on the 4h time frame. There will be 3 lines on your chart a red one, green one and blue one
Red Line : that is exactly where the 61.8% retracement would be from high to low or low to high.
Green Line : Same as the red line but it is the 38.2% retracement
Blue line : that is your 50 ema.
So how I use this indicator is when my red and blue line align this indicator will send you an alert, I look for possible Buy or Sell entries around that point. Combining it with market structure and support and resistance.

RSI & EMA Crossover Strategy with Daily & Weekly RSI Filter### Algorithm Description: RSI & EMA-Based Trading Strategy with Daily & Weekly RSI Filter
#### **Overview:**
This algorithm is designed to generate trading signals using a combination of **Relative Strength Index (RSI) and Exponential Moving Averages (EMA)**, with a multi-timeframe filter that ensures alignment between the daily and weekly RSI. The strategy aims to capture momentum-based trades while filtering out weak signals using higher timeframe confirmations.
#### **Key Components:**
1. **Primary Indicators:**
- **Relative Strength Index (RSI)**: Used to identify overbought and oversold conditions and confirm momentum direction.
- **Exponential Moving Averages (EMA)**: Used to determine trend direction and dynamic support/resistance levels.
2. **Multi-Timeframe RSI Filter:**
- **Daily RSI (Lower Timeframe)**: Used to identify potential entry points.
- **Weekly RSI (Higher Timeframe)**: Acts as a trend filter to ensure trades align with broader market direction.
#### **Trading Conditions:**
##### **Buy (Long) Entry Conditions:**
1. **Weekly RSI > 50** (indicating bullish momentum on the higher timeframe).
2. **Daily RSI crosses above 50** from below.
3. **Price is above both the 8-EMA and 21-EMA** on the daily timeframe.
4. **Confirmation:** Bullish price action near the EMAs.
##### **Sell (Short) Entry Conditions:**
1. **Weekly RSI < 50** (indicating bearish momentum on the higher timeframe).
2. **Daily RSI crosses below 50** from above.
3. **Price is below both the 8-EMA and 21-EMA** on the daily timeframe.
4. **Confirmation:** Bearish price action near the EMAs.
#### **Exit Strategy:**
- **Profit Target:** Can be set at a fixed percentage (e.g., 2-5%) or based on key resistance/support levels.
- **Stop Loss:** Placed below/above the 21-EMA or at a recent swing low/high.
- **Trailing Stop:** Can be applied based on ATR or moving averages.
#### **Advantages of This Strategy:**
✅ **Multi-Timeframe Confirmation:** Avoids false signals by ensuring alignment between daily and weekly trends.
✅ **Momentum-Based Approach:** Uses RSI for entry confirmation, reducing the risk of trading against the trend.
✅ **Trend Filtering:** EMAs ensure that trades are taken in the direction of the primary trend.
Would you like this converted into Pine Script for automation? 🚀

Forex finsetupThis script includes forex sessions, EMAs and RSI. It help us to trade during any session. EMAs are for identifying trend. RSI for finding the strength.

1H EMA 200 + 15M Supertrend Strategy This strategy is a **multi-timeframe trend-following strategy** that uses the **200 EMA on the 1-hour chart** for trend confirmation and the **Supertrend indicator on the 15-minute chart** for entry signals. Here’s a brief description of how it works:
---
### **Key Components**
1. **Trend Confirmation (1-Hour Chart)**:
- The **200 EMA** is used to determine the overall trend.
- **Buy Signal**: Price is above the 200 EMA (uptrend).
- **Sell Signal**: Price is below the 200 EMA (downtrend).
2. **Entry Signal (15-Minute Chart)**:
- The **Supertrend indicator** is used to generate entry signals.
- **Buy Signal**: Supertrend is in an uptrend (green).
- **Sell Signal**: Supertrend is in a downtrend (red).
3. **Stop-Loss and Take-Profit**:
- **Stop-Loss**: Fixed at the Supertrend value at the time of entry.
- **Take-Profit**: 1.5x the distance between the entry price and the stop-loss.
4. **Trade Management**:
- The strategy **closes the previous trade** whenever a new signal is generated, ensuring only one trade is active at a time.
---
### **How It Works**
1. **Buy Setup**:
- Price is above the 200 EMA (1-hour chart).
- Supertrend is green (15-minute chart).
- A buy trade is opened with:
- **Stop-Loss**: Supertrend value at entry.
- **Take-Profit**: 1.5x the distance between the entry price and the stop-loss.
2. **Sell Setup**:
- Price is below the 200 EMA (1-hour chart).
- Supertrend is red (15-minute chart).
- A sell trade is opened with:
- **Stop-Loss**: Supertrend value at entry.
- **Take-Profit**: 1.5x the distance between the stop-loss and the entry price.
3. **Trade Exit**:
- The trade is closed when either the **stop-loss** or **take-profit** is hit.
- If a new signal is generated, the previous trade is closed, and a new trade is opened.
---
### **Example**
- **Buy Trade**:
- Entry Price: $100
- Supertrend (Stop-Loss): $98
- Take-Profit: $100 + 1.5 * ($100 - $98) = $103
- **Sell Trade**:
- Entry Price: $100
- Supertrend (Stop-Loss): $102
- Take-Profit: $100 - 1.5 * ($102 - $100) = $97
---
### **Advantages**
- **Trend-Following**: Trades in the direction of the higher timeframe trend.
- **Clear Entry Signals**: Uses Supertrend for precise entries.
- **Risk Management**: Fixed stop-loss and take-profit levels based on Supertrend.
---
### **Customization**
- Adjust the **ATR length** and **factor** in the Supertrend settings.
- Modify the **take-profit multiplier** (e.g., 2x SL) if needed.
---
This strategy is designed to capture trends while managing risk effectively. Let me know if you need further adjustments! 🚀

4 EMA & RSI with DivergenceThis script is a powerful tool for traders who want to use a combination of EMA and RSI for technical analysis. With the ability to detect divergences, traders can identify better trading opportunities. This indicator provides flexibility in settings and appearance, allowing users to customize according to their trading strategy.

30ULAS EMAThis indicator displays 20 popular Exponential Moving Averages (EMAs), ranging from EMA 5 to EMA 250. It helps traders visualize different trend perspectives and identify potential support/resistance levels. The tool is designed for educational and development purposes only. Users are responsible for their own trading decisions.

Panic Drop Bitcoin 5 EMA Buy & Sell SignalPanic Drop BTC 5 EMA
What It Does:
This indicator tracks Bitcoin’s price against a 5-period Exponential Moving Average (EMA) to deliver simple buy and sell signals. A green arrow below the candle signals a buy when Bitcoin closes above the 5-EMA, while a red arrow above signals a sell when it closes below. Perfect for spotting Bitcoin’s momentum shifts—whether you’re a newbie, crypto trader, or short on time.
Key Features:
Plots a customizable 5-EMA (default: blue line).
Buy () and Sell () signals on crossovers/crossunders.
Optional background highlight: green (above EMA), red (below).
Alerts for buy/sell triggers.
Fully adjustable: timeframe, colors, signal toggles.
How to Use It:
Add to your BTC/USD chart (works on any timeframe—daily default recommended).
Watch for green arrows (buy) below candles and red arrows (sell) above.
Customize via settings:
Adjust EMA period (default: 5).
Set timeframe (e.g., "D" for daily, "1H" for hourly).
Change colors or toggle signals/background off.
Set alerts: Right-click a signal > "Add Alert" > Select "Buy Signal" or "Sell Signal."
Trade smart: Use signals to catch Bitcoin dips (e.g., buy below $100K) or exits.
Why It’s Great:
Beginners: Clear arrows simplify decisions.
Crypto Traders: 5-EMA catches Bitcoin’s fast moves.
Busy Investors: Signals save time—no deep analysis needed.
Created by Timothy Assi (Panic Drop), eToro’s elite investor. Test it, tweak it, and trade with confidence!

9 EMA, 20 EMA & Engulfing Signals Rajdeep main 4This indicator is a combination of 3 major technical aspects.
1. 9 EMA
2. 20 EMA
3. Engulfing candles
This indicator gives you signals about a strong pullback for taking trade. This strategy works well in all timeframes.
How to take trade?
1. Wait for the signal to happen.
2. Observe the candle showing signal & take trade as soon as next candle crosses High of signal candle, vice versa.
3. SL will be signal candle's low, vice versa.
4. TGT will be 1:1 considering the SL.
5. Can trail SL.
Thank You.

GRIM309 CallPut StrategyThis draws the 5, 10, 20, 50 and 200 EMA lines.
It creates suggestions of when to open and close call positions (GREEN) as well as open and close put positions (RED) it has a early warning system, and in case there is a spike between the last 5 positions it will signal close the position, this is optional (isWarning)
There is also a cooldown period, when set at 2 it means wait a position before initiating another, I did not like the position closing and then opening directly afterwards, you could cooldown for 3 and skip 2 candles or more etc. Set to 1 then it will open/close without cooling down.
Additionally the very bottom shows wether it is in an uptrend or downtrend currently (Yellow triangle)

Ton 1R TrendEMA-ATR-Spread Indicator
Originated by : Ton Liberator
This indicator calculates values using the formula:
EMA - (ATR × ATRMultiplier) - (Spread × SpreadMultiplier)
A versatile tool that combines Exponential Moving Average (EMA), Average True Range (ATR) volatility, and stock price spreads based on price ranges.
All components are fully customizable:
Adjust the EMA by selecting length and timeframe
Customize ATR with selectable length, timeframe, smoothing method (RMA, SMA, EMA, WMA), and multiplier
Spread is automatically calculated according to Thai stock market rules based on current price
Spread multiplier can be adjusted to fine-tune sensitivity
-------------------------
EMA-ATR-Spread Indicator
โดย : Ton Liberator
Indicator นี้คำนวณค่าโดยใช้สูตร:
EMA - (ATR × ATRMultiplier) - (Spread × SpreadMultiplier)
เป็นเครื่องมือที่ผสมผสานระหว่างค่าเฉลี่ยเคลื่อนที่แบบถ่วงน้ำหนัก (EMA) ค่าความผันผวนของราคา (ATR) และค่าสเปรดของหุ้นตามช่วงราคา
โดยทั้งหมดนี้สามารถปรับแต่งได้ตามต้องการ:
ปรับค่า EMA โดยเลือกความยาวและ timeframe ได้ตามต้องการ
ปรับค่า ATR โดยเลือกความยาว, timeframe, วิธีการ smoothing (RMA, SMA, EMA, WMA) และค่าตัวคูณ
ค่าสเปรดคำนวณอัตโนมัติตามหลักการของตลาดหลักทรัพย์ไทย โดยขึ้นอยู่กับราคาปัจจุบันของหุ้น
สามารถปรับค่าตัวคูณของสเปรดได้ตามต้องการ

Distance % from MAs + plotsPlots the distance, expressed as percentage, from MAs in a pane, as well as the MAs themselves in the price chart pane.

Air Gap MTFThis scripts automatically locate the EMA values on 30min/1hr/4hr for user specified EMA values.
On chart it will draw a line for each of the EMA, also labelling which MTF and timeframe, along with the current price.
The lines and price tag will update automatically in real-time so you don't have to keep adjusting the line!

PVSRA Candles Auto Override with 5 EMAs - Semper v1PVSRA Candles, 5 EMAs(10, 20, 50, 200, 800), LOD. HOD< LOW, HOW and Asia 50%

Ton1REMA-ATR-Spread Indicator: Multi-Factor Price Analysis Tool
Originated by : Ton Liberator
This indicator calculates values using the formula:
EMA - (ATR × ATRMultiplier) - (Spread × SpreadMultiplier)
A versatile tool that combines Exponential Moving Average (EMA), Average True Range (ATR) volatility, and stock price spreads based on price ranges.
All components are fully customizable:
Adjust the EMA by selecting length and timeframe
Customize ATR with selectable length, timeframe, smoothing method (RMA, SMA, EMA, WMA), and multiplier
Spread is automatically calculated according to Thai stock market rules based on current price
Spread multiplier can be adjusted to fine-tune sensitivity
-------------------------
EMA-ATR-Spread Indicator: เครื่องมือวิเคราะห์ราคาแบบหลายปัจจัย
โดย : Ton Liberator
Indicator นี้คำนวณค่าโดยใช้สูตร:
EMA - (ATR × ATRMultiplier) - (Spread × SpreadMultiplier)
เป็นเครื่องมือที่ผสมผสานระหว่างค่าเฉลี่ยเคลื่อนที่แบบถ่วงน้ำหนัก (EMA) ค่าความผันผวนของราคา (ATR) และค่าสเปรดของหุ้นตามช่วงราคา
โดยทั้งหมดนี้สามารถปรับแต่งได้ตามต้องการ:
ปรับค่า EMA โดยเลือกความยาวและ timeframe ได้ตามต้องการ
ปรับค่า ATR โดยเลือกความยาว, timeframe, วิธีการ smoothing (RMA, SMA, EMA, WMA) และค่าตัวคูณ
ค่าสเปรดคำนวณอัตโนมัติตามหลักการของตลาดหลักทรัพย์ไทย โดยขึ้นอยู่กับราคาปัจจุบันของหุ้น
สามารถปรับค่าตัวคูณของสเปรดได้ตามต้องการ

PVSRA Candles Auto Override with 5 EMAs - Semper v1PVSRA Candles, , 5 EMAs (10, 20, 50, 200 and 800), LOD, HOD, LOW, HOW and Asia 50%.

Multi EMA IndicatorMulti EMA 6-9-21 by WK
Here is a complete Trading Wave indicator for you that will display the EMA, SMA, and MA of 6, 9, 21, 33, and 100 with different colors. It also includes user settings so you can easily change the periods and colors.

Moving Average Shift [ChartPrime]Moving Average Shift indicator combines multiple moving average (MA) types with a unique MA Shift Oscillator to help traders visualize trend direction, price deviations, and mean reversion states.
⯁ KEY FEATURES
Customizable Moving Averages: Choose from SMA, EMA, SMMA (RMA), WMA, or VWMA.
Trend-Based Coloring: Candles are dynamically colored based on price position relative to the MA.
MA Shift Oscillator: Identifies price deviations and potential mean reversion zones.
Threshold Filtering: Helps filter mean reversion signals using a user-defined threshold.
Diamond Signals for Mean Reversion: Plots diamonds on the chart when the oscillator crosses back above or below the threshold level.
Oscillator Color Coding: The oscillator has four color states:
Color 1: Above 0 and increasing.
Color 2: Above 0 and decreasing.
Color 3: Below 0 and increasing.
Color 4: Below 0 and decreasing.
⯁ HOW TO USE
Use the indicator to follow the trend based on MA direction and price relation to it.
The MA Shift Oscillator helps identify potential mean reversion points where price may revert toward the MA.
The threshold setting allows traders to filter out weak mean reversion signals and focus on significant shifts.
The four-color oscillator visually indicates trend momentum and potential trend shifts.
⯁ CONCLUSION
The Moving Average Shift indicator is a powerful tool that merges trend-following and mean reversion strategies into one comprehensive system. By allowing traders to select different types of moving averages, it provides flexibility in trend analysis while visually enhancing price action with dynamic candle coloring. The MA Shift Oscillator further strengthens decision-making by detecting deviations and highlighting potential mean reversion points.

Buy/Sell Signals based on EMA CrossI, Kimaya Bavakay have done some backtesting for you, Please use this on DAILY TF ONLY and It shall only be used for EQUITY STOCKS!!!

10 Moving Averages10 Moving Averages Indicator Enhance Your Trend Analysis and Crossover Strategies
This free TradingView indicator overlays 10 fully customizable moving averages on your chart, empowering you to analyze trends and crossovers with clarity. Designed with versatility in mind, it allows you to choose from multiple types of moving averages—Simple (SMA), Exponential (EMA), Running (RMA), Weighted (WMA), or Volume-Weighted (VWMA)—for each line.
Key Features:
10 Moving Averages in One: Monitor up to 10 different moving averages simultaneously, perfect for comparing trends across multiple timeframes or methods.
Customizable Settings:
Type Selection: Easily switch between SMA, EMA, RMA, WMA, and VWMA.
Adjustable Lengths: Configure the period for each moving average to fit your trading strategy.
Color Options: Intuitively set distinct colors for each MA for quick visual identification.
Show/Hide Individual MAs: Activate or deactivate any moving average without cluttering your chart.
Organized & User-Friendly: The input parameters are neatly grouped, making configuration straightforward even for beginners.
Whether you’re a day trader looking to spot quick crossovers or a long-term investor gauging overall market trends, this indicator offers the flexibility and precision you need. Enjoy a more comprehensive view of price action and make more informed trading decisions.
Happy charting and best of luck in your trading journey!
