BALANCED Strategy: Intraday Pro + Smart DashboardWelcome to the BALANCED Strategy: Intraday Pro.
This all-in-one indicator is designed for Intraday traders looking to capture trend movements while effectively filtering out sideways market noise. It combines the power of Supertrend for direction, EMA 100 for the baseline trend, and rigorous validation via RSI and ADX.
The script also integrates a complete Risk Management system with targets based on the Golden Ratio (Fibonacci) and a real-time Dashboard.
⏳ Recommended Timeframes
This algorithm is optimized for Intraday volatility:
M5 (5 Minutes) ⭐️: Ideal for quick Scalping. The ADX filter is crucial here to avoid false signals.
M15 (15 Minutes) 🏆: The "Sweet Spot." It offers the best balance between signal frequency and trend reliability.
M30 / H1: For a "Swing Intraday" approach—calmer, fewer signals, but higher precision.
Not recommended for M1 (1 Minute) with default settings (too much noise).
🚀 How It Works
The algorithm follows a strict 3-step logic to generate high-quality signals:
1. Trend Identification (The Engine)
Supertrend: Determines the immediate direction.
EMA 100: Acts as a background trend filter. We only buy above and sell below the EMA.
2. Noise Filtering (Safety)
ADX (Average Directional Index): The signal is only validated if there is sufficient volatility (Configurable threshold, default 12) to avoid "chop markets" (flat markets).
RSI (Relative Strength Index): Strict momentum filter. Buy only if RSI > 50, Sell if RSI < 50.
3. Entry Confirmation (The Trigger)
The script doesn't just rely on a crossover. It waits for "Price Action" confirmation: the candle must close higher than the previous one (for Long) or lower (for Short) to validate the entry.
🛡️ Risk Management (Money Management)
This is the core strength of this tool. Upon signal validation, the script automatically calculates and plots:
Stop Loss (SL): Based on volatility (ATR). It places the stop at the recent Low/High with a safety padding.
Take Profit (TP): Two modes available:
Fibonacci Mode (Default): Targets the 1.618 extension (Golden Ratio) of the risk taken.
Fixed Ratio Mode: Targets a manual Risk/Reward ratio (e.g., 2.0).
📊 The Dashboard
Located at the bottom right, the smart dashboard provides vital info at a glance:
Signal Time: To check if the alert is fresh.
Type (LONG/SHORT): Color-coded (Green/Pink).
Tech Data: RSI and ADX values at the moment of the signal.
Exact Prices: Entry Level, Target (TP), and Stop Loss (SL).
⚙️ Configurable Settings
Sensitivity: Adjust the Supertrend factor (Default 2.0).
Filters: Toggle the RSI filter ON/OFF or adjust the ADX threshold.
Execution: Choose between Fibonacci Target (1.618) or a Manual Ratio.
⚠️ Disclaimer: This tool is a technical decision aid and does not constitute financial investment advice. Always use prudent risk management and backtest the indicator on your preferred assets before live use.
Forecasting

Impulse Day PlanOverview
This script provides a structured intraday trade plan built on three interacting components:
Impulse-based TP/SL system
Detects trend bias shifts and automatically generates Entry, TP1–TP3 and SL based on impulse range projections. Targets update dynamically and wick-touch confirmation is used for accurate ✓ tracking.
ATR day zones
A blended ATR model (Daily + selected base timeframe) produces support, balance and resistance zones derived from the previous session close. These zones provide directional context and realistic intraday expansion boundaries.
VWAP/EMA trend filter
Trend confirmation is applied using VWAP and EMA 50/200 structure. Signals are only considered aligned when price, VWAP and EMA trend agree.
The script displays a compact dashboard with the active trade plan, including:
Entry
TP1, TP2, TP3
Stop Loss
Checkmarks showing completed targets
This makes the indicator a planning framework, not a simple overlay.
How it differs from my previous publications
I previously released:
Smart Money OB + Limit Orders + Priority
SM OB Intraday Bot Assistant
Impulse TP/SL Zones
Those scripts focus on isolated concepts such as Smart Money structure, intraday automation or basic impulse mapping.
This script introduces a new integrated workflow: impulse TP/SL logic, ATR day zones and VWAP/EMA trend confirmation operating together as a single system. It does not reproduce the functionality of my previous tools and is designed as a standalone intraday planning method.
How to use
Select a base timeframe for the ATR zone model (15m, 1H, 4H).
Follow the dashboard for entry, targets and SL.
Use ATR zones to understand where targets sit within the day’s expected range.
Execute trades only when impulse signal and VWAP/EMA trend align.

SMA Cross PreventionTraditional MA crossover indicators are reactive — they tell you a cross happened after the fact.
This indicator is prescriptive — it tells you exactly what price action is required to prevent a cross from happening.
The Core Insight
When a fast MA is above a slow MA but they're converging, traders ask: "Will we get a death cross?"
This indicator answers a more useful question:
"What is the minimum price path required to prevent the cross?"
By treating the MA structure as a constraint and solving for the required input (future prices), we transform a lagging indicator into a forward-looking risk assessment tool.

RSI DivergenceStupid simple logic of RSI divergence. Took it simple, but be mindful - it has errors on the go - especially when in opposite trend some fakeouts happen - so you always must do your own personal check before making a final decision.
Usually the signal appears after 5 candles - logic is to trade pullbacks, not the divergence itself - as mentioned, it could be faked out, as well - especially in opposite trend than the divergence itself.
This is a signal, that appears in ideal conditions - as we know, not all divergences happen under the same logic, therefore don't expect it to print the quality level signals on every possible turnaround.
You must keep this as your assistant, not your decision maker.
Hope this indicator can serve anyone on the go.

Custom RSI + Divergence + Bold Lines (v6, matched)📌 Custom RSI with Divergence & Dynamic Coloring
This indicator enhances the classic Relative Strength Index (RSI) by combining
dynamic visual feedback with automatic regular divergence detection.
It is designed to help traders quickly identify overbought / oversold conditions
and potential momentum shifts through clear and intuitive visualization.
⸻
🔍 Key Features
1️⃣ Dynamic RSI Line Coloring
• Overbought zone (RSI > Overbought level) → RSI line turns green
• Oversold zone (RSI < Oversold level) → RSI line turns red
• Neutral zone → RSI line remains white
This allows instant recognition of the current RSI state.
⸻
2️⃣ Overbought / Oversold Visual Highlighting
• Clear overbought and oversold reference lines
• Background shading when RSI enters these zones
→ improves signal visibility and reaction speed
⸻
3️⃣ Automatic Regular Divergence Detection
• Bullish Divergence
• Price makes a lower low
• RSI makes a higher low
• Pivot lows are connected with a bold green line
• Bearish Divergence
• Price makes a higher high
• RSI makes a lower high
• Pivot highs are connected with a bold red line
Pivot points are connected directly, making divergence structures easy to identify at a glance.
⸻
4️⃣ Clear Signal Markers
• Bullish divergence: ▲ (bottom of the RSI pane)
• Bearish divergence: ▼ (top of the RSI pane)
⸻
⚙️ Inputs
• RSI Length
• Overbought / Oversold Levels
• Pivot Length (controls divergence sensitivity)
⸻
💡 How to Use
• Oversold + Bullish Divergence → Potential rebound setup
• Overbought + Bearish Divergence → Potential pullback or reversal
• Best used in combination with trend analysis, support/resistance, and volume
⸻
⚠️ Notes
• Divergence signals are probabilistic, not guaranteed.
• In ranging markets, divergences may appear more frequently.
• Always apply proper risk management.
⸻
🎯 Best For
• Traders who actively use RSI
• Traders looking for clean and intuitive divergence visualization
• Users who prefer minimal but informative indicators

Contra Trading Setup - Buy on CloseContra Trding Setp
1. Closing Price is less than 20SMA
2. Today low is less than last 5 days low
3.Today close is above yesterday close
4. If all 3 conditions met
Then tomorrow close should be >Today Close
Buy On Close
Exit After 5 - 7 Trading Session.

Dynamische Open/Close Levels mit Historie🎯 Key Features
This indicator provides clean, configurable horizontal lines showing the Open and Close prices of a higher chosen timeframe (e.g., the last 5-minute candle), serving as dynamic support and resistance levels.
Unlike traditional indicators that draw messy "steps" across your entire chart, this tool is designed for clarity and precise control.
Controlled History: Easily define how many of the last completed periods (e.g., 5-minute blocks) should remain visible on the chart. Set to 0 for only the current, active levels.
No Stepladder Effect: Uses advanced drawing methods (line.new and object management) to ensure the historical levels remain static and do not clutter your chart history.
Dynamic Labels: The labels (e.g., "Open (5)") automatically adjust to show the timeframe you configured in the indicator settings, eliminating confusion when switching timeframes.
Customizable: Full control over colors, line length, and label positioning/size.
💡 Ideal Use Case
Perfect for scalpers and day traders operating on lower timeframes (1m, 3m) who want to quickly visualize and respect crucial price action levels from a higher context (e.g., 5m, 15m, 1h).

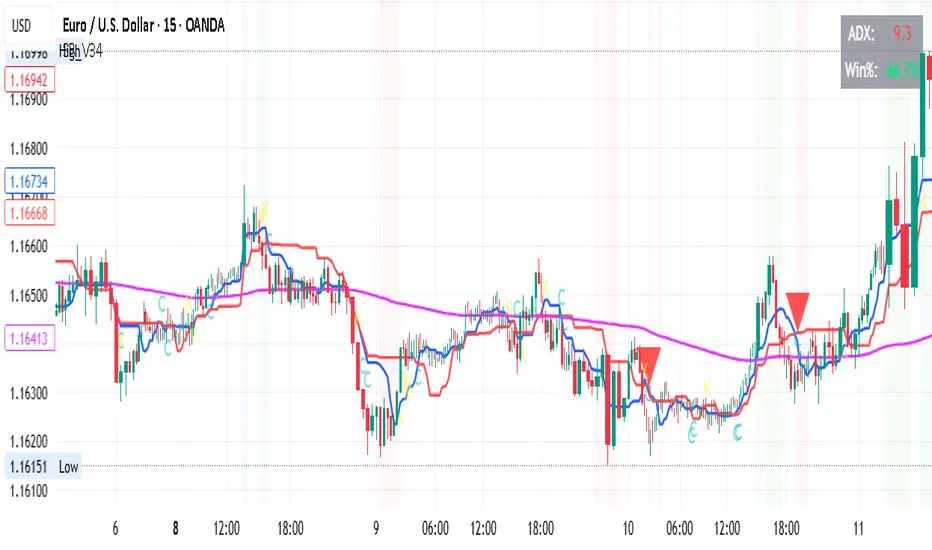
OPTIMISED FOR 15Min on certain FOREX Ichimoku & Friends Strategy
Timeframe
15-Minute Chart
Entry Rules
Required Conditions ALL Must Be True
For LONG Entries:
Trend: Price is above EMA 200 (purple line)
Ichimoku: Tenkan (blue) is above Kijun (red)
Price Position: Close is above BOTH Tenkan AND Kijun
ADX: Must be above 22 (shows strong trend)
RSI: Between 50 and 70 (has momentum, not overbought)
Cooldown: At least 12 bars since last trade closed
For SHORT Entries:
Trend: Price is below EMA 200 (purple line)
Ichimoku: Tenkan (blue) is below Kijun (red)
Price Position: Close is below BOTH Tenkan AND Kijun
ADX: Must be above 22 (shows strong trend)
RSI: Between 30 and 50 (has momentum, not oversold)
Cooldown: At least 12 bars since last trade closed
Entry Signals Any ONE of These
Signal Type 1: Cross (C)
Long: Tenkan crosses above Kijun AND price closes above Kijun
Short: Tenkan crosses below Kijun AND price closes below Kijun
Wait 1 bar to confirm the cross holds
Signal Type 2: Bounce (B) - Most Reliable
Long: Price touches/dips to Kijun, then bounces up with strong bullish candle
Short: Price touches/spikes to Kijun, then rejects down with strong bearish candle
Must occur within last 3 bars
Signal Type 3: Breakout (K)
Long: Price breaks above Kijun with strong bullish momentum candle
Short: Price breaks below Kijun with strong bearish momentum candle
Candle body must be at least 40% of ATR
Risk Management
Stop Loss Placement
Placed at the lower of:
Recent swing low (last 5 bars) for longs
Kijun minus 0.5 ATR for longs
Minimum distance: 2.5 x ATR
FOR SHORTS: Mirror logic using swing highs
Take Profit
2x the stop loss distance
Example: If stop is 20 pips away, target is 40 pips
Position Size
100% of equity per trade (as per current settings)
Adjust based on your risk tolerance
Trade Management
When to Enter
Only when ALL entry conditions are met
Check that background is shaded (green for long, red for short)
Small letter markers (C, B, K) show which signal type triggered
When to Exit
Take Profit hit (2x R:R ratio)
Stop Loss hit (smart placement protects capital)
Strategy closes position (conditions reverse)
Cooldown Period
Wait 12 bars (3 hours on 15m chart) after any trade closes
Prevents revenge trading and overtrading
Visual Indicators on Chart
Lines
Blue (Tenkan): 9-period conversion line
Red (Kijun): 26-period base line
Purple (EMA 200): Long-term trend line
Orange (EMA 50): Not used in current rules
Signals
Large Green Triangle Up: LONG entry
Large Red Triangle Down: SHORT entry
Small Letters (C/B/K): Which signal type triggered
Background Colors
Light Green: Conditions favorable for LONG (ADX good, uptrend)
Light Red: Conditions favorable for SHORT (ADX good, downtrend)
No Color: Not safe to trade
Top Right Display
ADX Value: Green = above threshold, Red = below
Win Rate: Shows current performance
Quick Checklist Before Entry
LONG Trade Checklist:
Price above purple EMA 200
Blue line above red line
Price above both blue AND red lines
ADX number is green (above 22)
RSI between 50-70
Background is light green
At least 12 bars since last trade
Signal marker appeared (triangle or letter)
SHORT Trade Checklist:
Price below purple EMA 200
Blue line below red line
Price below both blue AND red lines
ADX number is green (above 22)
RSI between 30-50
Background is light red
At least 12 bars since last trade
Signal marker appeared (triangle or letter)
Tips for Success
Best Signal Type: Bounce (B) signals typically have highest win rate
ADX is Critical: Do not trade when ADX is red - wait for trends
Be Patient: 2-3 trades per day on 15m is normal and healthy
Trust the System: Do not second-guess the signals
Respect Cooldown: Waiting prevents emotional trading
Monitor Win Rate: Keep above 50% for profitability with 2:1 R:R
Adjustable Settings
If you want to modify strategy performance:
For Higher Win Rate Fewer Trades:
Increase "Minimum ADX" to 25
Increase "Cooldown Bars" to 15
Turn OFF breakout signals
For More Trades Slightly Lower Win Rate:
Decrease "Minimum ADX" to 20
Decrease "Cooldown Bars" to 8
Keep all signal types enabled
For Better Risk:Reward:
Increase "Risk:Reward Ratio" to 2.5 or 3.0
This means bigger targets, letting winners run more
What NOT to Do
Do not trade without ADX confirmation (when number is red)
Do not enter during cooldown period
Do not trade when price is chopping around EMA 200
Do not override the stop loss - let it work
Do not take signals when Tenkan and Kijun are flat/parallel
Do not force trades - wait for all conditions
Do not trade if you see no background shading
Notes
Current Performance: 67% win rate (2/3 trades)
Timeframe: 15-minute (3 hours = 12 bars cooldown)
Profit Factor Target: Above 1.5 is excellent
Strategy works best during: European and US trading sessions when volatility is higher
DYOR NFA
Core Suite Essentials This script provides institutional-grade, multi-factor market analysis in a unified toolkit. Its true sophistication lies in its ability to reveal the critical interplay—the "dance"—between its core components, offering a profound view of market structure, momentum, and trend health that goes far beyond standard indicators.
Core Differentiators
Reveals the Core Trend "Dance":
The script masterfully visualizes the critical interaction between three foundational elements:
Ichimoku (Tenkan Sen & Kijun Sen): The leading actors defining momentum and equilibrium.
Bollinger Middle Band (BBM): The dynamic stage of support/resistance.
This interaction provides an institutional-grade read on trend integrity:
Strong Trend: A clean, bullish alignment with the Tenkan Sen leading, the Kijun Sen following, and the BBM acting as firm support confirms a powerful, unified move.
Trend Break Warning: The BBM moving between the Tenkan and Kijun signals convergence and compression, a critical alert of weakening momentum and a potential reversal.
Multi-Timeframe Momentum Confirmation:
This core trend analysis is fortified with a layered momentum gauge, providing a robust, institutional-style confirmation system:
Proprietary RSI-Based Bands across weekly, daily, and intraday frames.
Stochastic Channels (Sto12/Sto50) for additional context on price position.
Strategic Filters for Swing & Position Traders:
For higher-timeframe analysis, it delivers essential quantitative tools:
AnEMA29 Angle: Objectively quantifies trend strength and direction.
PDMDR (DMI Ratio): Measures directional dominance to filter low-conviction markets.
Integrated Cross-Asset Intelligence:
Completing the institutional perspective is a Correlation & Hedging Assistant, contextualizing price action against peers and identifying strategic opportunities based on RSI divergences.
Conclusion
This is not a mere collection of indicators; it is a consolidated analytical workstation. It captures the nuanced "dance" of the core trend triad, layers on multi-timeframe momentum confirmation, and provides strategic filters for timing and cross-asset context. This holistic, institutional-grade approach delivers a definitive and actionable market narrative.
ICHIMOKU
@insomniac_vampire

Alloyz Traders_RSI by Sagar BRSI for Intraday purpose with moving average and volume weightage price added in RSI.

NQ 300+ Point Day Checklist (Bias + Alerts + Markers)This indicator helps identify high-range (≥300-point) days on Nasdaq-100 futures (NQ / MNQ) using a clear, rule-based checklist.
It evaluates volatility, compression, price displacement, prior-day structure, and overnight activity to generate a daily expansion score (0–6). Higher scores signal an increased likelihood of a strong trending or expansion day.
The script also provides:
Expansion probability levels (Normal / Watch / High-Prob)
Bullish, bearish, or neutral bias
On-chart markers and background highlights
Optional alerts for early awareness
Best used on the Daily timeframe to help traders focus on high-opportunity days and avoid overtrading during consolidation.
This is a context and probability tool — not a trade signal.

Miela Labs | John Dee's Watchtower [257-463]Bridging the gap between 16th-century esoteric mathematics and modern algorithmic trading.
The Enochian Watchtower is not merely a trend indicator; it is a computational artifact developed by Miela Labs LLC. This script translates Dr. John Dee’s "Great Table of the Watchtowers" and the "Sigil Dei Aemeth" into actionable financial data points.
Using our proprietary Occultator V2.0 Engine, we have derived specific mathematical constants that resonate with the current market structure.
🏛️ The Algorithmic Logic
This indicator utilizes three sacred numbers to construct a "Future Vision" of the market:
1. The Axis Mundi (Vector 257): derived from Fermat Primes and John Dee’s Grid coordinates. This Weighted Moving Average (WMA) acts as the spinal cord of the trend.
2. The Gates (Cipher 463): A prime number derived from the "Galethog" cipher stride. These bands define the absolute volatility limits (Heaven & Earth Gates).
3. Future Vision (Offset 21): Utilizing Fibonacci time sequences, the indicator projects Support and Resistance levels 21 bars into the future, allowing traders to anticipate market movements before they occur.
⚡ How to Use
• The Trend: If price is above the Purple Axis (257), the market is in a bullish phase.
• The Entry: Look for "L" (Long) and "S" (Short) signals. These are confirmed when the signal path crosses the Axis.
• The Future: Watch the projected lines on the right side of the chart to identify upcoming resistance zones.
About Miela Labs
Miela Labs is a Technomancy Research Institute based in McKinney, Texas. We specialize in building open-source esoteric trading tools and the Magic Programming Language (MPL).
🌐 Official Hub: Visit Miela Labs
💻 Source Code & Research: GitHub Repository
Disclaimer: This tool is for educational and research purposes only. It demonstrates the application of esoteric mathematics in financial analysis. Trade responsibly.

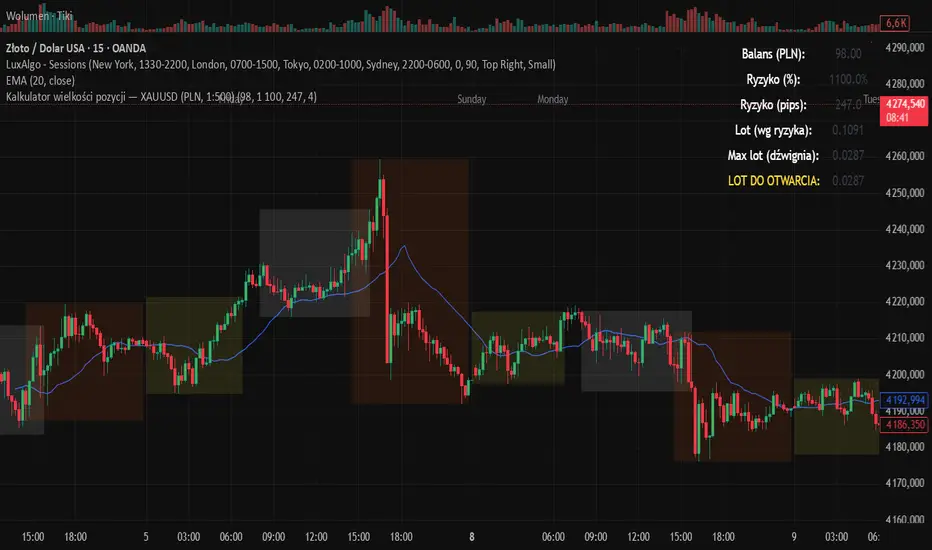
Kalkulator pozycji XAUUSD PLN, 1:500, 1100 to 100 kontaPosition calculator based on the number of pips that you quickly enter from the tool, this device will select the appropriate lot for you and you can quickly take a position
RS Rating Viet Nam by Admin AlphaStockSo sanh vs VNMIDCAP
Bạn có thể thay đổi BenchMark trong Code thành VNINDEX hay bất kỳ chỉ số nào

Fanfans极简原版优化版### 中英文双语总结(300字内)
中文:该指标为Fanfans极简原版优化版,基于RSI和ATR构建核心交易信号,新增趋势(EMA)、成交量、时间、价格位置多维度过滤,及动态ATR倍数调整功能。含同方向订单间隔限制、多级止盈止损(支持阈值触发),内置信号质量评分、标签标注与警报推送,可自定义过滤规则和显示样式,通过多维度筛选降低无效信号,提升短周期交易信号准确性。
English: This is an optimized version of Fanfans' minimalist indicator, building core trading signals based on RSI and ATR. It adds multi-dimensional filters (trend/EMA, volume, time, price position) and dynamic ATR multiplier adjustment, includes same-direction order interval limits, multi-level SL/TP (supporting threshold triggers), built-in signal quality scoring, label annotation and alert push. Customizable filter rules and display styles reduce invalid signals via multi-dimensional screening, improving short-term trading signal accuracy.

Fanfans结构加强vwap版 + 极简系统### 中英文双语总结(300字内)
中文:该指标整合Fanfans结构、动态摆动VWAP、高斯GWMA、MACD及极简交易系统,支持趋势过滤(可选GWMA/VWAP/结构维度)、多离场模式(ATR止盈止损/GWMA离场/混合)与移动止损。具备多空信号标注、止损止盈线绘制、多维度共振警报,图表信息面板实时展示结构/VWAP/GWMA/MACD状态,可自定义过滤规则、显示样式及交易参数,适配短周期交易,兼顾趋势判断与信号执行的灵活性。
English: This indicator integrates Fanfans structure, dynamic swing VWAP, Gaussian GWMA, MACD and a simple trading system. It supports trend filtering (GWMA/VWAP/structure optional), multiple exit modes (ATR SL/TP, GWMA exit, hybrid) and trailing stop. Featuring long/short signal labeling, SL/TP line drawing, multi-dimensional resonance alerts, its chart info panel displays real-time status of structure/VWAP/GWMA/MACD. Customizable filter rules, display styles and trading parameters make it suitable for short-term trading, balancing trend judgment and signal execution flexibility.

Fanfans结构+极简合并增强版V2
中文:该指标整合Fanfans结构、高斯GWMA、动态摆动VWAP、MACD及极简交易信号,内置结构/GWMA/VWAP/EMA多维度过滤、成交量确认、动态ATR等优化功能。支持多空信号标注、止损止盈分层设置、信号质量评分,搭配图表信息面板与多级别警报共振机制,适用于1分钟等短周期交易,兼顾信号灵敏度与准确性。
English: This indicator integrates Fanfans structure, Gaussian GWMA, dynamic swing VWAP, MACD, and simple trading signals. It features multi-dimensional filters (structure/GWMA/VWAP/EMA), volume confirmation, dynamic ATR optimization. Supporting long/short signal labeling, layered SL/TP settings, signal quality scoring, it comes with a chart info panel and multi-level alert resonance. Suitable for short-term trading (e.g., 1-minute timeframe), balancing signal sensitivity and accuracy.

GLI / Asset Structural Trend RatioBasicly I asked AI to create a GLI to Asset trend ratio indicator.


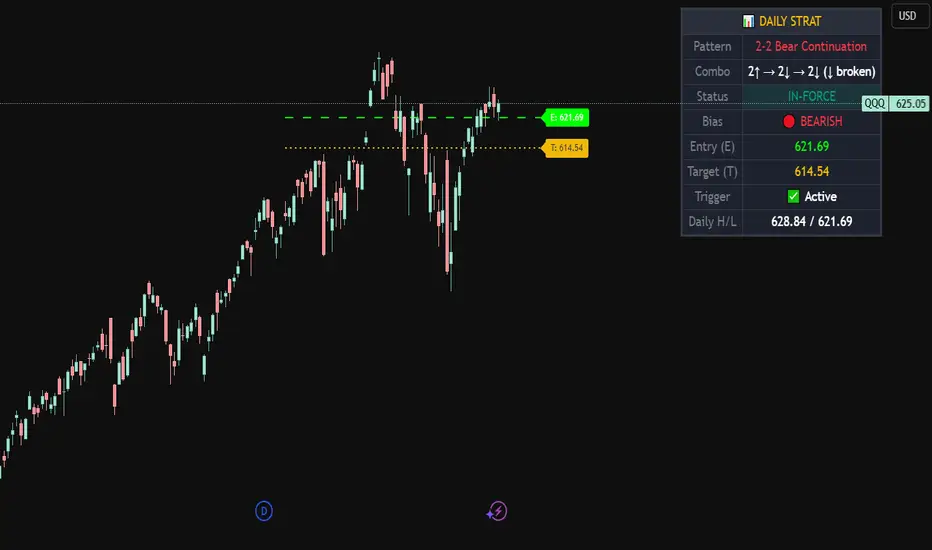
Strat Daily Predictor📊 Strat Daily Predictor
This indicator analyzes Daily timeframe Strat patterns and displays actionable trading setups on any chart timeframe.
🔹 FEATURES:
• Detects all major Strat patterns (2-1-2, 3-1-2, 3-2-2, 1-2-2, 2-2, 1-2, 1-3)
• Shows Entry (E) and Target (T) price levels
• Pattern status: ACTIONABLE, TRIGGERED, or IN-FORCE
• Visual Entry/Target lines on chart
• Entry signals when price breaks trigger levels
• Works on any timeframe using Daily analysis
🔹 PATTERN TYPES:
• Continuation patterns (trend following)
• Reversal patterns (counter-trend)
• Bullish & Bearish setups
🔹 TABLE DISPLAYS:
• Current pattern name
• Bar combo (e.g., 2↑ → 1 → 2↑)
• Bias (BULLISH/BEARISH)
• Entry & Target prices
• Daily High/Low levels
🔹 HOW TO USE:
1. Add to any timeframe chart
2. Check table for Daily pattern setup
3. Wait for ACTIONABLE patterns
4. Enter when price breaks Entry level
5. Target shown on chart
🔹 ALERTS:
• Long Entry
• Short Entry
• Actionable Pattern
• In-Force Pattern
Based on Rob Smith's "The Strat" methodology.
Granger Causality Flow IndicatorGranger Causality Flow Indicator
█ OVERVIEW
The Granger Causality Flow Indicator is a statistical analysis tool designed to identify predictive relationships between two assets (Symbol X and Symbol Y). In econometrics, "Granger Causality" does not test for actual physical causation (e.g., rain causes mud); rather, it tests for predictive causality .
This script is designed to answer a specific question for traders: "Does the past price action of Asset X provide statistically significant information about the future price of Asset Y, beyond what is already contained in the past prices of Asset Y itself?"
This tool is particularly useful for Pairs Traders , Arbitrageurs , and Macro Analysts looking to identify lead-lag relationships between correlated assets (e.g., BTC vs. ETH, NASDAQ vs. SPY, or Gold vs. Silver).
█ CONCEPTS & CALCULATIONS
To determine if Symbol X "Granger-causes" Symbol Y, this script utilizes a variance-reduction approach based on Auto-Regressive (AR) models. Due to the runtime constraints of Pine Script™, we employ an optimized proxy for the standard Granger test using an AR(1) logic (looking back 1 period).
The calculation performs a comparative test over a rolling window (Default: 50 bars):
The Restricted Model (Baseline):
We attempts to predict the current value of Y using only the previous value of Y (Auto-Regression). We measure the error of this prediction (the "Residuals") and calculate the Variance of the Restricted Model (Var_R) .
The Unrestricted Model (Proxy):
We then test if the past value of X can explain the errors made by the Restricted Model. If X contains predictive power, including it should reduce the error variance. We calculate the remaining Variance of the Unrestricted Model (Var_UR) .
The GC Score:
The script calculates a score based on the ratio of variance reduction:
Score = 1 - (Var_UR / Var_R)
If the Score is High (> 0) : It implies that including X significantly reduced the prediction error for Y. Therefore, X "Granger-causes" Y.
If the Score is Low or 0 : It implies X added no predictive value.
█ HOW TO USE
This indicator is not a simple Buy/Sell signal generator; it is a context filter for cross-asset analysis.
1. Setup
Symbol 1 (X): The potential "Leader" (e.g., BINANCE:BTCUSDT).
Symbol 2 (Y): The potential "Follower" (e.g., BINANCE:ETHUSDT).
Differencing: Enabled by default. This checks the changes in price rather than absolute price, which is crucial for statistical stationarity.
2. Interpreting the Visuals
The script changes the background color and displays a table to indicate the current flow of causality:
Green Background (X → Y): Symbol 1 is leading Symbol 2. Price moves in Symbol 1 are statistically likely to foreshadow moves in Symbol 2.
Orange Background (Y → X): Symbol 2 is leading Symbol 1. The relationship has inverted.
Blue Background (Bidirectional): Both assets are predicting each other (tight coupling or feedback loop).
Gray/No Color: No statistically significant relationship detected.
3. Trading Application
Trend Confirmation: If you trade Symbol Y, wait for the background to turn Green . This indicates that the "Leader" (Symbol X) is currently exerting predictive influence, potentially making trend-following setups on Symbol Y more reliable.
Divergence Warning: If you are trading a correlation pair and the causality breaks (turns Gray), the correlation may be weakening, signaling a higher risk of divergence.
█ SETTINGS
Symbol 1 (X) & Symbol 2 (Y): The two tickers to analyze.
Use Differencing: (Default: True) Converts prices to price-changes. Highly recommended for accurate statistical results to avoid spurious regression.
Calculation Window: The number of bars used to compute the variance and coefficients. Larger windows provide smoother, more stable signals but react slower to regime changes.
Significance Threshold: (0.01 - 0.99) The minimum variance reduction score required to trigger a causal signal.
█ DISCLAIMER
This tool provides statistical analysis of historical price data and does not guarantee future performance. Granger Causality is a measure of predictive capability, not necessarily fundamental causation. Always use appropriate risk management.

Dynamic Swing Anchored VWAP (Zeiierman) with alert functionoriginal script by the author, added alert function only

Swing Trading IndicatorThis script is a swing‑trading dashboard designed for BTC, ETH, S&P 500 (for now). It combines weekly RSI, USDT.D, VIX, moving averages and Fisher Transform into a single visual tool, with background highlights, an on‑chart info table and ready‑made alerts to help you time high‑probability swing entries and manage risk.
1. Overview
The indicator is intended to work on daily timeframe.
Signals are context‑aware: BTC and ETH get USDT.D conditions, SPX gets VIX and EMA‑100 logic, and all non‑ETH symbols can also use Fisher Transform as a mean‑reversion filter.
2. Conditions and background highlights
Each component sets a boolean condition and, when active, paints a background layer:
Weekly RSI condition
True when weekly RSI is below its symbol‑specific threshold.
USDT.D conditions
BTC: triggered when USDT.D is above the user threshold and the chart symbol is BTC.
ETH: same logic for ETH, but tracked separately..
VIX condition (SPX only)
True when VIX high is at or above the VIX threshold while the chart is SPX.
EMA condition (BTC & SPX)
BTC: daily close below EMA‑200.
SPX: daily close below EMA‑100.
Fisher Transform condition (non‑ETH)
Fisher Transform on the chart timeframe, using the configured period.
True when Fisher value is below the Fisher threshold.
3. Intended use and notes
This indicator is designed as a confluence tool for swing traders, not a standalone buy/sell system. It works best on assets that are in a clear uptrend, where the main idea is to accumulate during corrections within that broader bullish structure.
During larger market shocks, deep corrections, or black‑swan events, trend‑based and mean‑reversion filters can produce false signals, because volatility and correlations often behave abnormally in those periods. For that reason, this script should always be combined with independent risk management, higher‑timeframe trend analysis, and your own discretion.
