KEMAD | QuantumResearchQuantumResearch KEMAD Indicator
The QuantumResearch KEMAD Indicator is a sophisticated trend-following and volatility-based tool designed for traders who demand precision in detecting market trends and price reversals. By leveraging advanced techniques implemented in PineScript, this indicator integrates a Kalman filter, an Exponential Moving Average (EMA), and dynamic ATR-based deviation bands to produce clear, actionable trading signals.
1. Overview
The KEMAD Indicator aims to:
Reduce Market Noise: Employ a Kalman filter to smooth price data.
Identify Trends: Use an EMA of the filtered price to define the prevailing market direction.
Set Dynamic Thresholds: Adjust breakout levels with ATR-based deviation bands.
Generate Signals: Provide clear long and short trading signals along with intuitive visual cues.
2. How It Works
A. Kalman Filter Smoothing
Purpose: The Kalman filter refines the selected price source (e.g., close price) by reducing short-term fluctuations, thus offering a clearer view of the underlying price movement.
Customization: Users can adjust key parameters such as:
Process Noise: Controls the filter’s sensitivity to recent changes.
Measurement Noise: Determines how responsive the filter is to incoming price data.
Filter Order: Sets the number of data points considered in the smoothing process.
B. EMA-Based Trend Detection
Primary Trend EMA: A 25-period EMA is applied to the Kalman-filtered price, serving as the core trend indicator.
Signal Mechanism:
Long Signal: Triggered when the price exceeds the EMA plus an ATR-based upper deviation.
Short Signal: Triggered when the price falls below the EMA minus an ATR-based lower deviation.
C. ATR Deviation Bands
ATR Utilization: The Average True Range (ATR) is computed (default length of 21) to assess market volatility.
Dynamic Thresholds:
Upper Deviation: Calculated by adding 1.5× ATR to the EMA (for long signals).
Lower Deviation: Calculated by subtracting 1.1× ATR from the EMA (for short signals).
These bands adapt to current volatility, ensuring that signal thresholds are both dynamic and market-sensitive.
3. Visual Representation
The indicator’s design emphasizes clarity and ease of use:
Color-Coded Bar Signals:
Green Bars: Indicate bullish conditions when a long signal is active.
Red Bars: Indicate bearish conditions when a short signal is active.
Trend Confirmation Line: A 54-period EMA is plotted to further validate trend direction. Its color dynamically changes to reflect the active trend.
Background Fill: The space between a calculated price midpoint (typically the average of high and low) and the EMA is filled, visually emphasizing the prevailing market trend.
4. Customization & Parameters
The KEMAD Indicator is highly configurable, allowing traders to tailor the tool to their specific trading strategies and market conditions:
ATR Settings:
ATR Length: Default is 21; adjusts sensitivity to market volatility.
EMA Settings:
Trend EMA Length: Default is 25; smooths price action for trend detection.
Confirmation EMA Length: Default is 54; aids in confirming the trend.
Kalman Filter Parameters:
Process Noise: Default is 0.01.
Measurement Noise: Default is 3.0.
Filter Order: Default is 5.
Deviation Multipliers:
Long Signal Multiplier: Default is 1.5× ATR.
Short Signal Multiplier: Default is 1.1× ATR.
Appearance: Eight customizable color themes are available to suit individual visual preferences.
5. Trading Applications
The versatility of the KEMAD Indicator makes it suitable for various trading strategies:
Trend Following: It helps identify and ride sustained bullish or bearish trends by filtering out market noise.
Breakout Trading: Detects when prices move beyond the ATR-based deviation bands, signaling potential breakout opportunities.
Reversal Detection: Alerts traders to potential trend reversals when price crosses the dynamically smoothed EMA.
Risk Management: Offers clearly defined entry and exit points, based on volatility-adjusted thresholds, enhancing trade precision and risk control.
6. Final Thoughts
The QuantumResearch KEMAD Indicator represents a unique blend of advanced filtering (via the Kalman filter), robust trend analysis (using EMAs), and dynamic volatility assessment (through ATR deviation bands).
Its PineScript implementation allows for a high degree of customization, making it an invaluable tool for traders looking to reduce noise, accurately detect trends, and manage risk effectively.
Whether used for trend following, breakout strategies, or reversal detection, the KEMAD Indicator is designed to adapt to varying market conditions and trading styles.
Important Disclaimer: Past data does not predict future behavior. This indicator is provided for informational purposes only; no indicator or strategy can guarantee future results. Always perform thorough analysis and use proper risk management before trading.
Moving Averages

MediMoving Average with Customized Deviation by MarcosJuniorAn indicator that uses two adjustable arithmetic moving averages, as needed, where the averages are from the same periods, one average being standard and the other average using a calculation base for standard deviation based on the volatility of the moment.

SMA + RSI + ADX + ATR StrategyСильно не ругайте это первая моя стратегия, она простая но со вкусом как говорят, пробуйте вносите изменения.
Помощь в допиливании стратегии приветсвуется!
✅ Используются индикаторы:
SMA 10 и SMA 200 – для входа по пересечению
RSI – для подтверждения тренда
ADX – для определения силы тренда
ATR – для расчёта волатильности
✅ Работает на таймфреймах:
M5, H3, H4, D1, MN
✅ Открывает сделки:
BUY – когда SMA10 пересекает SMA200 вверх, и RSI + ADX подтверждают тренд
SELL – когда SMA10 пересекает SMA200 вниз, и RSI + ADX подтверждают тренд
✅ Управляет риском:
Использует не более 2% от депозита на одну сделку
✅ Поддерживает хеджирование

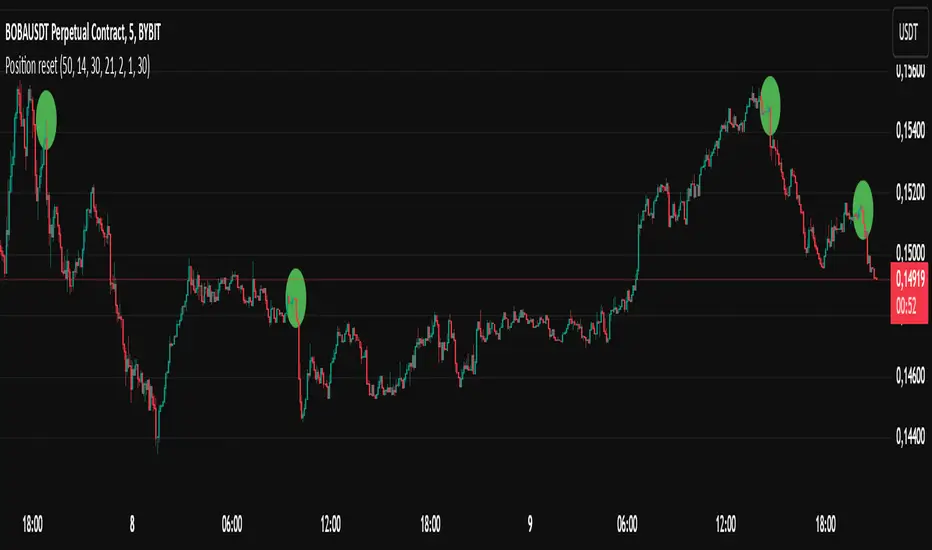
Position resetThe "Position Reset" indicator
The Position Reset indicator is a sophisticated technical analysis tool designed to identify possible entry points into short positions based on an analysis of market volatility and the behavior of various groups of bidders. The main purpose of this indicator is to provide traders with information about the current state of the market and help them decide whether to open short positions depending on the level of volatility and the mood of the main players.
The main components of the indicator:
1. Parameters for the RSI (Relative Strength Index):
The indicator uses two sets of parameters to calculate the RSI: one for bankers ("Banker"), the other for hot money ("Hot Money").
RSI for Bankers:
RSIBaseBanker: The baseline for calculating bankers' RSI. The default value is 50.
RSIPeriodBanker: The period for calculating the RSI for bankers. The default period is 14.
RSI for hot money:
RSIBaseHotMoney: The baseline for calculating the RSI of hot money. The default value is 30.
RSIPeriodHotMoney: The period for calculating the RSI for hot money. The default period is 21.
These parameters allow you to adjust the sensitivity of the indicator to the actions of different groups of market participants.
2. Sensitivity:
Sensitivity determines how strongly changes in the RSI will affect the final result of calculations. It is configured separately for bankers and hot money:
SensitivityBanker: Sensitivity for bankers' RSI. It is set to 2.0 by default.
SensitivityHotMoney: Sensitivity for hot money RSI. It is set to 1.0 by default.
Changing these parameters allows you to adapt the indicator to different market conditions and trader preferences.
3. Volatility Analysis:
Volatility is measured based on the length of the period, which is set by the volLength parameter. The default length is 30 candles. The indicator calculates the difference between the highest and lowest value for the specified period and divides this difference by the lowest value, thus obtaining the volatility coefficient.
Based on this coefficient, four levels of volatility are distinguished.:
Extreme volatility: The coefficient is greater than or equal to 0.25.
High volatility: The coefficient ranges from 0.125 to 0.2499.
Normal volatility: The coefficient ranges from 0.05 to 0.1249.
Low volatility: The coefficient is less than 0.0499.
Each level of volatility has its own significance for making decisions about entering a position.
4. Calculation functions:
The indicator uses several functions to process the RSI and volatility data.:
rsi_function: This function applies to every type of RSI (bankers and hot money). It adjusts the RSI value according to the set sensitivity and baseline, limiting the range of values from 0 to 20.
Moving Averages: Simple moving averages (SMA), exponential moving averages (EMA), and weighted moving averages (RMA) are used to smooth fluctuations. They are applied to different time intervals to obtain the average values of the RSI.
Thus, the indicator creates a comprehensive picture of market behavior, taking into account both short-term and long-term dynamics.
5. Bearish signals:
Bearish signals are considered situations when the RSI crosses certain levels simultaneously with a drop in indicators for both types of market participants (bankers and hot money).:
The bankers' RSI crossing is below the level of 8.5.
The current hot money RSI is less than 18.
The moving averages for banks and hot money are below their signal lines.
The RSI values for bankers are less than 5.
These conditions indicate a possible beginning of a downtrend.
6. Signal generation:
Depending on the current level of volatility and the presence of bearish signals, the indicator generates three types of signals:
Orange circle: Extremely high volatility and the presence of a bearish signal.
Yellow circle: High volatility and the presence of a bearish signal.
Green circle: Low volatility and the presence of a bearish signal.
These visual markers help the trader to quickly understand what level of risk accompanies each specific signal.
7. Notifications:
The indicator supports the function of sending notifications when one of the three types of signals occurs. The notification contains a brief description of the conditions under which the signal was generated, which allows the trader to respond promptly to a change in the market situation.
Advantages of using the "Position Reset" indicator:
Multi-level analysis: The indicator combines technical analysis (RSI) and volatility assessment, providing a comprehensive view of the current market situation.
Flexibility of settings: The ability to adjust the sensitivity parameters and the RSI baselines allows you to adapt the indicator to any market conditions and personal preferences of the trader.
Clear visualization: The use of colored labels on the chart simplifies the perception of information and helps to quickly identify key points for entering a trade.
Notification support: The notification sending feature makes it much easier to monitor the market, allowing you to respond to important events in time.
✘ -Edward本脚本由Edward编写,实现VWAP + sessions + vp 功能。
主要功能
日度(Daily)
周度(Weekly)
月度(Monthly)
季度(Quarterly)
年度(Yearly)
支持日、周、月、季、年度VWAP分析
显示当前和历史时间周期VWAP
绘制VWAP上下波动带
自定义颜色和显示选项
pyVWAP:上一年度VWAP
yVWAP:当前年度VWAP
pqVWAP:上一季度VWAP
qVWAP:当前季度VWAP
pyVWAP:上一年度VWAP
yVWAP:当前年度VWAP
-1/+1:上下波动带
颜色编码区分不同时间周期
启用/禁用特定周期的VWAP和波动带。
自定义线条颜色和样式。

EMA Ribbon + Volume Profile (Combined Indicator)I combine the Volume Profile script from kv4coins () with EMA Ribbon (inspired by @mondays_range on X).
⚠️ Only enable the buy signal plot on the total market cap chart like TOTAL, TOTAL2, TOTAL3, or OTHERS. The bigger the tier, the better the signal. This is the first version, I will update this gradually when I have time.
Always DYOR. Don't trust, verify!

MOHAMMED ALSAAB - توصية تداول ثابتة داخل اليوم (5 دقائق)تداول داخل اليوم على أساس فترة زمنية قصيرة (5 دقائق). يعتمد المؤشر على:
المؤشرات الفنية:
المتوسط المتحرك البسيط (SMA): يستخدم لتحديد الاتجاه العام للسعر.
مؤشر القوة النسبية (RSI): يستخدم للكشف عن حالات التشبع في الشراء والبيع.
إشارات الدخول:
شراء (لونق): عندما يكون السعر فوق المتوسط المتحرك و RSI تحت مستوى التشبع في الشراء.
بيع (شورت): عندما يكون السعر تحت المتوسط المتحرك و RSI فوق مستوى التشبع في البيع.
وقف الخسارة والهدف:
يتم تحديد وقف الخسارة والهدف بناءً على حركة السعر القريبة (نسبة مئوية من السعر الحالي).
عرض التوصية:
يظهر الجدول بشكل دائم أو عند تفعيل إشارة الدخول، حيث يعرض نوع الصفقة، سعر الدخول، الهدف ووقف الخسارة.
الهدف هو مساعدة المتداولين على اتخاذ قرارات تداول مستندة إلى إشارات فنية واضحة ومدعومة بالبيانات المرئية في الوقت الفعلي.

End-of-Session ProbabilityThis indicator estimates the probability that the market will finish the session above a specified target price. It blends a statistical probability model with directional bias and optional morning momentum weighting to help traders gauge end-of-day market expectations.
Key Features:
• Statistical Probability Model:
Uses a normal distribution (with a custom normal CDF approximation) scaled by the square-root-of-time rule. The indicator dynamically adjusts the standard deviation for the remaining session time to compute a z‑score and ultimately the probability that the session close exceeds the target.
• Directional Bias via Daily HullMA (Exponential):
A daily Hull Moving Average (calculated using an exponential method) is used as a big-picture trend indicator. The model allows you to select your bias method—either by comparing the current price to the daily HullMA (Price method) or by using the HullMA’s slope (Slope method). A drift multiplier scales this bias, which then shifts the mean used in the probability calculations.
• Optional Morning Momentum Weight:
For traders who believe that early session moves provide useful clues about the day’s momentum, you can enable an optional weighting. The indicator captures the percentage change from the morning open (within a user-defined time window) and adjusts the expected move accordingly. A multiplier lets you control the strength of this adjustment.
• Visual Outputs:
The indicator plots quantile lines (approximately the 25%, 50%, and 75% levels) for the expected price distribution at session end. An abbreviated on-chart label displays key information:
• Target: The target price (current price plus a user-defined offset)
• Prob Above: The probability (in percentage) that the session close will exceed the target price
• Time: The time remaining in the session (in minutes)
How to Use:
1. Set Your Parameters:
• Expected Session Move: Input your estimated standard deviation for the full-session move in price units.
• Daily Hull MA Settings: Adjust the period for the daily HullMA and choose the bias method (Price or Slope). Modify the drift multiplier to tune the strength of the directional bias.
• Target Offset: Specify an offset from the current price to set your target level.
• Morning Momentum (Optional): Enable the morning momentum weight if you want the indicator to adjust the expected move based on early session price changes. Define the morning session window and set the momentum multiplier.
2. Interpret the Output:
• Quantile Lines: These represent the range of possible end-of-session prices based on your model.
• Abbreviated Label: Provides a quick snapshot of the target price, probability of finishing above that target, and time remaining in the session.
3. Trading Application:
Use the probability output as a guide to assess if the market is likely to continue in the current direction or reverse by session close. The indicator can help you decide on trade entries, exits, or adjustments based on your overall strategy and risk management approach.
This tool is designed to offer a dynamic, statistically driven snapshot of the market’s expected end-of-day behavior, combining both longer-term trend bias and short-term momentum cues.

RSI/MOM/MACD/Squezee/Donchian/HULL/SUPERTREND/Waddath Attar GAOOptimized Trading Strategy with RSI, MOM, MACD, Donchian, Squeeze, HULL, Supertrend & Waddah Attar
Our trading strategy combines multiple technical indicators to maximize trend identification, momentum confirmation, and trade execution precision.
📌 RSI (Relative Strength Index) – Measures overbought and oversold conditions, helping to spot potential reversals.
📌 MOM (Momentum Indicator) – Confirms price acceleration and strength, identifying possible breakouts or trend exhaustion.
📌 MACD (Moving Average Convergence Divergence) – A trend-following momentum indicator that highlights bullish or bearish crossovers.
📌 Donchian Channel – Defines support and resistance levels, signaling breakouts when price moves beyond its range.
📌 Squeeze (TTM Squeeze) – Detects periods of low volatility before explosive moves, ideal for breakout trading.
📌 HULL Moving Average – A fast and smooth moving average used to reduce lag and provide better trend direction.
📌 Supertrend – A dynamic trend indicator that adjusts based on volatility, providing clear buy and sell signals.
📌 Waddah Attar Explosion – Measures momentum and volatility, helping to confirm strong breakouts with volume-based signals.
By integrating these indicators on higher timeframes (such as 4H and Daily), traders can refine entry and exit points, minimize false signals, and maximize profits. 🚀📈

TBRSV - Trend Bias & Reversal Signals with Volatility SqueezesThe "TBRSV" indicator is designed to identify the prevailing trend direction, potential reversal points, and squeeze breakouts. It achieves this by combining several technical analysis tools:
EMA-Based Trend Bias: It uses a fast and slow Exponential Moving Average (EMA) to determine the overall trend direction. The directionalBias line visually represents this bias, with lime indicating an uptrend, red indicating a downtrend, and orange signalling a potential trend change.
Reversal Confirmation: The indicator identifies potential reversal points by looking for price action that breaks the recent trend. If the price makes a new low during an uptrend or a new high during a downtrend within a specified look back period, it considers this a reversal signal.
Reversal Signals: Confirmed reversals are marked with lime (bullish) or red (bearish) dots on the chart. These dots suggest potential entry or exit points.
Squeeze Detection: The indicator uses Bollinger Bands and Keltner Channels to identify periods of consolidation, or "squeezes," where volatility is low.
Squeeze Breakout Signals: It identifies high-volume breakouts from these squeezes. A white upward-pointing triangle signals a bullish breakout, while a white downward-pointing triangle signals a bearish breakout.
How to Best Use the Indicator
1. Determine the Trend Bias: Use the color of the directionalBias line to quickly assess the current trend.
2. Identify Potential Reversal Zones: Pay attention to the orange areas, which signal times of indecision and potential trend changes.
3. Confirmed Reversal Signals: Look for lime or red dots. These dots indicate high-probability reversal points and potential entry or exit points.
4. Squeeze Breakout Signals: Trade in the direction of the breakout.
5. Combine with Other Indicators: Enhance signals from the "Trend Bias & Reversal Signals" indicator with other tools, such as volume analysis, RSI, MACD, trend lines, or candlestick patterns.
6. Consider Trend Strength: Not all trends are equal. Adjust your trading strategy based on the strength of the trend.
7. Weighted Trade Signals: Consider using the indicator in conjunction with weighted trade signals, giving more weight to signals aligned with the trend bias.
By understanding the components of the "Trend Bias & Reversal Signals with Volume Squeezes" indicator and how they work together, you can use it to identify high-probability trading opportunities and improve your overall trading performance. Remember to adapt your approach to different market conditions and trading styles.

SimpleDTEA - INDEX, XAU, ETCA strategy that works with the 200 period moving average, only using the buy strategy, with TK and SL adjustable according to the ATR, with a 70% success rate for TK 1 SL 2. Works best on the 1 hour timeframe, works best for XAU, US100, US30 and US500. Totally free! Test it on a demo account before putting it into practice.

wdg3XYGEGDTMicorv03This is a simple indicator trying to catch quick momentum and price action movement and grab quick scalps trades. When several bars close above the EMA1 and when EMA1 > EMA2, we are looking to Enter Limit Long for a quick 5 to 10 point target. The opposite is true for Short Set ups. When several bars close below the EMA1 and when EMA1 < EMA2, we are looking to Enter Limit Short for a quick 5 to 10 point target. Our stop for longs is below the Low of Low or Low [2}. Stops for shorts are placed just above High or High . This is for educational purposes only.

ORB with 100 EMAThis was created to only take trades when ORB is above or below 100ema. If ORB is above 100ema and candle closes above opening range then we look for longs aiming for 1:1. If ORB is below 100ema and candle closes below opening range we look for shorts aiming for a 1:1.
This is the initial release to get feedback. I will be updating to signify the significant entry points.

Triple EMA Crossover v.13 EMA Crossover
This script, Triple EMA Crossover v.1, is a technical indicator designed for trading analysis. It calculates and plots three Exponential Moving Averages (EMAs) with customizable lengths and colors. The script highlights crossover events between the 13-period and 21-period EMAs, changing the EMA colors dynamically to green on a bullish crossover and red on a bearish crossover.
Key features include:
Crossover Signals: Identifies buy (bullish) and sell (bearish) signals when the 13 EMA crosses above or below the 21 EMA while the 8 EMA confirms the trend direction.
Dynamic Coloring & Glow Effect: EMAs change colors based on trend direction, with a shaded area between them for better visualization.
Arrow Markers: Displays arrows at crossover points, with an option to enable or disable them.
VWAP Integration: Option to display the Volume-Weighted Average Price (VWAP) for additional trend analysis.
Alerts: Generates alerts for bullish and bearish crossover signals.
This script helps traders visually identify trend shifts and potential trade opportunities efficiently.

ORB with 100 EMAORB Trading Strategy for FX Pairs on the 30-Minute Time Frame
Overview
This Opening Range Breakout (ORB) strategy is designed for trading FX pairs on the 30-minute time frame. The strategy is structured to take advantage of price momentum while aligning trades with the overall trend using the 100-period Exponential Moving Average (100EMA). The primary objective is to enter trades when price breaks and closes above or below the Opening Range (OR), with additional confirmation from a retest of the OR level if the initial entry is missed.
Strategy Rules
1. Defining the Opening Range (OR)
- The OR is determined by the high and low of the first 30-minute candle after market open.
- This range acts as the key level for breakout trading.
2. Trend Confirmation Using the 100EMA
- The 100EMA serves as a filter to determine trade direction:
- Buy Setup: Only take buy trades when the OR is above the 100EMA.
- Sell Setup: Only take sell trades when the OR is below the 100EMA.
3. Entry Criteria
- Buy Trade: Enter a long position when a candle breaks and closes above the OR high, confirming the breakout.
- Sell Trade: Enter a short position when a candle breaks and closes below the OR low, confirming the breakout.
- Retest Entry: If the initial entry is missed, wait for a price retest of the OR level for a secondary entry opportunity.
4. Risk-to-Reward Ratio (R2R)
- The goal is to target a 1:1 Risk-to-Reward (R2R) ratio.
- Stop-loss placement:
- Buy Trade: Place stop-loss just below the OR low.
- Sell Trade: Place stop-loss just above the OR high.
- Take profit at a distance equal to the stop-loss for a 1:1 R2R.
5. Risk Management
- Risk per trade should be based on personal risk tolerance.
- Adjust lot sizes accordingly to maintain a controlled risk percentage of account balance.
- Avoid over-leveraging, and consider moving stop-loss to breakeven if the price moves favourably.
Additional Considerations
- Avoid trading during major news events that may cause high volatility and unpredictable price movements.
- Monitor market conditions to ensure breakout confirmation with strong momentum rather than false breakouts.
- Use additional confluences such as candlestick patterns, support/resistance zones, or volume analysis for stronger trade validation.
This ORB strategy is designed to provide structured trade opportunities by combining breakout momentum with trend confirmation via the 100EMA. The strategy is straightforward, allowing traders to capitalise on clear breakout movements while implementing effective risk management practices. While the 1:1 R2R target provides a balanced approach, traders should always adapt their risk tolerance and market conditions to optimise trade performance.
By following these rules and maintaining discipline, traders can use this strategy effectively across various FX pairs on the 30-minute time frame.

SCAE MJ VolSpikeCustom indicator named "SCAE MJ VolSpike." It combines multiple technical analysis tools, including EMAs (Exponential Moving Averages), KDJ, MACD, and volume spike detection, to generate buy/sell signals and overbought/oversold alerts. Below is a breakdown of the script's functionality:
Key Components of the Script
1. Input Parameters:
- Users can customize the periods for KDJ, MACD, lookback, and volume spike thresholds.
- Parameters include:
- P1, P2, P3 for KDJ periods.
- SHORT, LONG, M for MACD periods.
- N for the lookback period.
- volume_spike_buy_multiplier, volume_spike_pullback_multiplier and volume_spike_sell_multiplier for volume spike thresholds.
- volume_ma_period for the volume moving average.
2. EMA Calculations:
- The script calculates EMAs for periods 5, 9, 21, 42, and 200.
- These EMAs are plotted on the chart with different colors for visualization.
3. KDJ Calculation:
- The KDJ indicator is calculated using the formula:
- RSV (Raw Stochastic Value) = (close - lowest(low, P1)) / (highest(high, P1) - lowest(low, P1)) * 100
- K = SMA of RSV over P2 periods.
- D = SMA of K over P3 periods.
- J = 3 * K - 2 * D.
4. MACD Calculation:
- The MACD is calculated as:
- DIF = EMA(close, SHORT) - EMA(close, LONG).
- DEA = EMA(DIF, M).
- MACD = (DIF - DEA) * 2.
5. Normalization and Scaling:
- The script normalizes the KDJ and MACD values to align them on a similar scale for comparison.
- This ensures that the indicators can be used together effectively.
6. Volume Spike Detection:
- A volume spike is detected when the current volume exceeds the moving average of volume (volume_ma) plus a multiple of the standard deviation (volume_std).
- Two thresholds are used:
- volume_spike_buy_threshold and volume_spike_sell_threshold for significant spikes.
- volume_spike_pullback_threshold for pullback conditions.
7. Buy/Sell Conditions:
- Buy Signal:
- Triggered when:
- DIF crosses above DEA.
- Volume exceeds the spike threshold.
- Price is above the 9 EMA and 200 EMA.
- Alternatively, a buy signal is triggered during a pullback if the price is above the 21 EMA but below the 200 EMA.
- Sell Signal:
- Triggered when:
- DIF crosses below DEA.
- Volume exceeds the spike threshold.
- Price is below the 9 EMA but above the 21 EMA.
- Overbought/Oversold Conditions:
- Overbought: J_new > 90.
- Oversold: J_new < -90.
8. Plotting and Alerts:
- Buy/sell signals are plotted as arrows on the chart.
- Alerts are set up for:
- Buy signals.
- Pullback signals.
- Sell signals.
- Overbought/oversold conditions.
How to Use the Indicator
1. Add the script to a TradingView chart.
2. Customize the input parameters as needed.
3. Look for buy/sell signals indicated by arrows on the chart.
4. Use the alerts to get notified of trading opportunities.
Example Use Case
- Buy Signal: When the MACD (DIF) crosses above the signal line (DEA) and volume spikes, a green "B" arrow appears below the price bar.
- Sell Signal: When the MACD crosses below the signal line and volume spikes, a red "S" arrow appears above the price bar.
- Overbought/Oversold: Yellow arrows indicate potential reversal points when the KDJ indicator is in overbought or oversold territory.
This script is a tool for traders who want to combine multiple indicators into a single, cohesive strategy. It can be further customized to suit specific trading styles or asset classes.

Ichimoku with 2 EMAsmain awal di m3, m5, m15, m30 baru ke selanjutnya ya
pastikan tenkan (orange), ema 11 (merah) dan ema 29 (putih) diatas kijun (biru), untuk posisi buy
sebaliknya untuk posisi sel
TP nya, ema 11(merah) silang dengan kijun (biru) di M3
dibantu konfirmasi dengan RSI 14 diatas 50 untuk buy, dibawah 50 untuk sell ya

Rajesh Raju nifty options SMA/RSIThis indicator is designed for Nifty Index Options trading on a 5-minute timeframe. It uses a combination of the Simple Moving Average (SMA) and Relative Strength Index (RSI) to identify potential buy and sell signals.
How It Works:
A BUY signal is triggered when the price crosses above the SMA and RSI is below the overbought level.
A SELL signal is generated when the price crosses below the SMA and RSI is above the oversold level.
The SMA line is displayed in pink (purple in Pine Script) to track trend direction.
Alerts are included to notify users of trade signals in real time.
This indicator helps traders make informed decisions by identifying trend reversals and momentum shifts

SMA D1 on M1Średnie SMA: jednodniowa, tygodniowa i miesięczna z wykresu D1 widoczna na mniejszych interwałach.

Moving average strategyHow It Works:
Weekly 50 VWMA Filter:
The strategy checks if the current price is above the weekly 50 VWMA.
If not, no trades or signals are generated.
Entry:
A long position is opened when:
The price is above the weekly 50 VWMA.
Two consecutive candles close above the 200 WVMA on the current timeframe.
The second candle's close is above the HLCC4 of the first candle.
Exit:
The long position is closed when:
The daily close price is below the daily 200 WVMA.
Next Entry:
After the position is closed, the strategy waits for the next valid buy signal (if the price remains above the weekly 50 VWMA).

Bollinger Bands + 50 EMA + 200 EMAThis is a script that works on Bollinger band length=53, 50EMA and 200 EMA

MTF Ichimoku Conversion Line SMA
Well, traders talk about the "trend" or trendlines.
We've got many theories defining "the trend" out there...
But which "trend" are they discussing?
"I've heard of Dow, Elliott, Parabolic SAR, etc..."
Let's put it. Just Use the Conversion Line of Ichimoku.
It indicates trend conversion.
Tired of following the step-like weird line?
Okay, Use SMA of it. Yes, you've got a very smooth line, above which the "trend" can be read as an uptrend, and below it is a downtrend.
A spacenoid, alien invader's definition of the "trend"?
Maybe so. But don't be afraid. Whatever it is, it must be your friend if it's a trend.
-Recommended Setting
Conversion Line Period: 9 or 12
SMA period: 14 or 10
SMA Mode: True

IBD Relative Strength with MAUnlike existing IBD Relative Strength indicators, this one has a moving average element to help track how the relative strength of your stock is performing longer term.
This indicator comes with two features:
1. The Relative Strength (RS) indicator
2. The moving average (MA) of the RS
In general, when the RS is moving up, the stock is out performing the index; and when down, it is underperforming. If flat, then the stock is moving inline with the index. The default index is SPY, but you can change that in the settings.
With the MA addition, you can quickly see how the RS is trending and tell if, on that day or week when the RS is moving down, is your stock still holding above the moving average trend--Is it still outperforming the market?
There are several features you can adjust in the settings:
1. You can set the RS to track against any stock or index
2. You can set the look back period for RS comparison (the default is 63 for a full quarter on the daily timeframe)
3. You can adjust the moving average time length (the default is 10 for two weeks on the daily timeframe)
4. You can determine if you want a simple or exponential moving average for your MA indicator
Hope you enjoy! Thanks for checking it out.
