Agent Nafri AlertsTitle: Agent Nafri Alerts
Category: Technical Analysis Indicator
Version: Pine Script v5
Author: Syed Irfan Baksh
Market: Works on all instruments & timeframes
Description:
The Agent Nafri Alerts indicator is a sophisticated and versatile trading tool designed for traders who rely on trend-based strategies. By combining Exponential Moving Averages (EMA), Relative Strength Index (RSI), and Stochastic Oscillator, this indicator provides high-probability buy and sell signals while minimizing false entries. Whether you're trading Forex, Stocks, Crypto, or Commodities, this indicator adapts seamlessly to all assets and timeframes, making it a must-have tool for traders of all levels.
💡 Key Features:
EMA Trend Confirmation
Uses a 9-period EMA and a 21-period EMA to confirm bullish or bearish trends.
A crossover of the 9 EMA above the 21 EMA signals a potential uptrend, while a crossover below indicates a potential downtrend.
RSI Strength Filter
Filters out weak signals by requiring the RSI to be above 55 for buy signals and below 45 for sell signals.
Ensures that trades are only taken when momentum is strong and aligned with the trend.
Stochastic Confirmation
Adds an additional layer of confirmation by requiring the Stochastic Oscillator (%K and %D) to be above 25 for buy signals and below 75 for sell signals.
Helps avoid false breakouts by ensuring overbought or oversold conditions are respected.
Clear Visual Alerts
Displays BUY and SELL signals directly on the chart with intuitive labels and colors for easy interpretation.
Alerts are accompanied by sound notifications, ensuring you never miss a trading opportunity.
Universal Compatibility
Works flawlessly across all markets, including Forex, Stocks, Crypto, and Commodities.
Adapts to all timeframes, from 1-minute charts to weekly charts, making it suitable for scalpers, day traders, and swing traders alike.
🛠 How to Use:
📈 Buy Signal Conditions:
The 9 EMA crosses above the 21 EMA, confirming a bullish trend.
The RSI is above 55, indicating strong bullish momentum.
The Stochastic Oscillator (%K and %D) is above 25, confirming upward movement.
When all three conditions are met, a BUY signal is generated, and a visual alert is displayed on the chart.
📉 Sell Signal Conditions:
The 9 EMA crosses below the 21 EMA, confirming a bearish trend.
The RSI is below 45, signaling bearish momentum.
The Stochastic Oscillator (%K and %D) is below 75, confirming downward pressure.
When all three conditions are met, a SELL signal is generated, and a visual alert is displayed on the chart.
🎨 Customization Options:
The Agent Nafri Alerts indicator is highly customizable to suit your trading style:
Adjust the EMA periods (9 and 21) to fit your preferred trend-following strategy.
Modify the RSI thresholds (55 for buys, 45 for sells) to fine-tune momentum filtering.
Customize the Stochastic levels (25 for buys, 75 for sells) to align with your risk tolerance.
Change the colors and styles of the signals and EMA lines for better visual clarity.
🔔 Alerts and Notifications:
The indicator includes built-in TradingView alerts that can be configured to notify you via:
Pop-up notifications on your desktop or mobile device.
Email alerts for long-term traders.
Sound alerts to ensure you never miss a signal.
📊 Why Choose Agent Nafri Alerts?
High Accuracy: By combining multiple technical indicators, the Agent Nafri Alerts system ensures that only high-probability signals are generated.
Reduced False Signals: The RSI and Stochastic filters eliminate weak or unreliable signals, saving you from unnecessary losses.
User-Friendly: Designed with simplicity in mind, the indicator is easy to understand and use, even for beginners.
Versatile: Suitable for all trading styles, including scalping, day trading, and swing trading.
🌟 Start Using Agent Nafri Alerts Today!
Enhance your trading strategy with the Agent Nafri Alerts indicator and take your trading to the next level. Whether you're a beginner or an experienced trader, this powerful tool will help you identify high-probability trading opportunities with confidence.
Happy Trading! 🚀
Multitimeframe

Bottom Fishing Indicator# Bottom Fishing Indicator Documentation
## 1. Overview
The **Bottom Fishing Indicator** is a tool based on **RSI**, **CCI**, and **MFI** oscillators to identify oversold conditions. It accumulates oversold values over time to detect potential reversal points. The indicator also supports multi-timeframe analysis to provide more comprehensive insights.
---
## 2. Features
1. **RSI / CCI / MFI Oversold Accumulation Detection**:
- **RSI**: Starts accumulating when RSI is below 30.
- **CCI**: Calculates the difference from -100 when CCI is below -100 and accumulates it.
- **MFI**: Begins accumulation when MFI is below 20.
2. **Threshold Trigger Monitoring**:
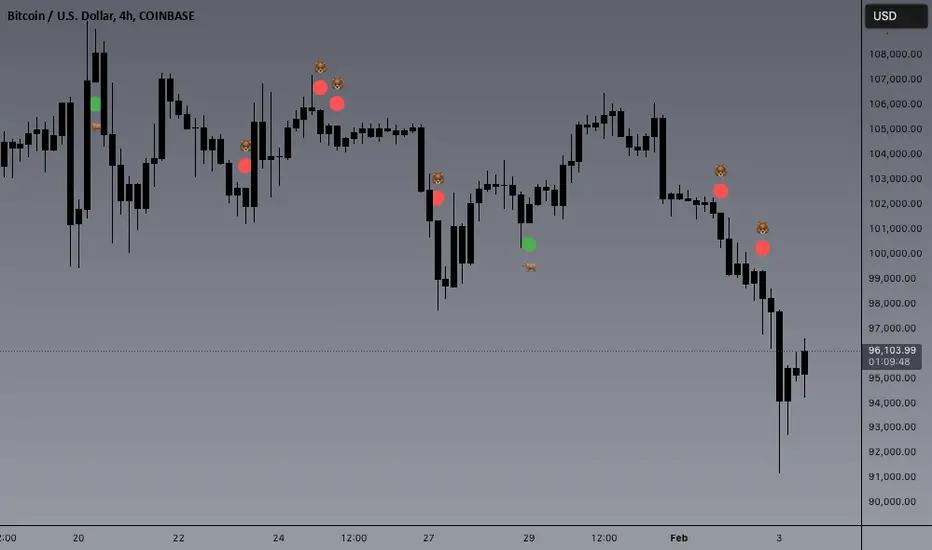
- When the accumulated value exceeds the predefined threshold (default 100), a "Goal" marker is displayed on the chart, indicating a potential bottom.
3. **Multi-Timeframe Analysis (MTF)**:
- Supports selecting different timeframes (such as daily, weekly) for indicator values and displays multi-timeframe accumulation curves on the main chart.
4. **Customizable and Dynamic Adjustment Options**:
- Allows customization of indicator lengths, accumulation thresholds, display colors, line thickness, and more, offering flexible settings.
---
## 3. Settings Explanation
1. **RSI Length**: Period for RSI calculation (default 14).
2. **CCI Length**: Period for CCI calculation (default 20).
3. **MFI Length**: Period for MFI calculation (default 14).
4. **Sum Threshold for Marker**: Accumulation value threshold to trigger markers (default 100).
5. **Indicator to Track**: Select the indicator to monitor (RSI / CCI / MFI).
6. **Multi-Timeframe Line Timeframe**: Timeframe for multi-timeframe analysis (default Daily).
7. **MTF Sum Threshold for Reset**: Accumulation threshold for multi-timeframe analysis, resets after exceeding (default 100).
8. **MTF Sum Line Color**: Color of the multi-timeframe accumulation line (default Orange).
9. **MTF Line Width**: Thickness of the multi-timeframe accumulation line (default 2).
---
## 4. Chart Explanation
1. **Value Sum Line**: Accumulation curve for oversold areas, showing the current progress of accumulation to monitor potential reversals.
2. **MTF Value Sum Line**: Multi-timeframe accumulation line, further verifying consistency between different timeframes.
3. **Goal Marker**: Displays a "Goal" marker on the chart when the accumulation value exceeds the predefined threshold, indicating a potential bottom area.
---
## 5. Usage Tips
1. **Select Indicators Based on Conditions**:
- For clear downtrends, RSI may provide better results.
- For highly volatile markets, CCI is more effective.
- To consider volume factors, choose the MFI indicator.
2. **Multi-Timeframe Analysis**:
- Use multi-timeframe accumulation curves to further confirm the consistency between larger and smaller timeframes.
3. **Continuous Monitoring and Adjusting Thresholds**:
- Adjust accumulation thresholds according to market volatility to select more suitable risk control methods.
---
## 6. Notes
1. **Oversold indicators alone cannot fully capture the market environment. Please combine them with other technical indicators and fundamental analysis.**
2. **The indicator does not guarantee market bottom reversals. Please use it rationally and avoid over-reliance.**
---
For any questions or feedback, please contact us.

SMC [GKLeo]Market Structure: Detects swing and internal highs/lows.
Order Blocks: Tracks and displays order blocks.
Fair Value Gaps: Detects and draws fair value gaps.
Equal Highs/Lows: Detects and displays equal highs/lows.
Premium/Discount Zones: Draws zones based on trailing swing points.
Multi-Timeframe Levels: Draws levels for daily, weekly, and monthly timeframes.

RSI Buy/Sell SignalBuy sell base on RSI 4
Buy when RSI close above 68
Sell when RSI of candle close below 32
Apply for XAUUSD

Bsk : Auto P.day High & Low - (22-1-2025)Historical day highs and lows, Bollinger bands ema 8, 15 and all in 1 indicator for the day traders.

E9 MM Nuke signalScript identifies wickless candles on a specified higher timeframe and plots them on a lower timeframe (If desired), such as 15 minutes. It includes options to adjust the margin for error (e.g. 5 tick wick), higher timeframe, and toggle the volume filter with period adjustment.
Wickless candles signal strong market sentiment shifts, indicating areas of significant buying or selling pressure. These areas can become key levels of support or resistance, making them crucial to monitor for potential price revisits.
Why Price Revisits Wickless Areas
Manipulators often create artificial wickless candles to deceive traders. However, genuine market movements can also produce wickless candles, indicating a strong consensus among market participants. In either case, the price is likely to revisit these areas as traders and investors react to the perceived market sentiment shift.
Key Features:
Margin Input:
Description: Allows users to specify the margin in 0.01 tick increments to account for small wicks due to spread issues.
Example: A margin of 0.05 ticks means the script will consider candles wickless if the high is within 0.05 ticks of the open and the low is within 0.05 ticks of the open.
Volume Filter:
Description: Users can enable or disable a volume filter to consider only candles with a volume greater than the average volume over a specified period.
Default: Enabled by default.
Volume Period Input: Users can specify the period for calculating the average volume (e.g., 9 periods).
Higher Timeframe Input:
Description: Allows users to select the higher timeframe on which to identify wickless candles.
Options: H4 ("240"), Daily ("D"), Weekly ("W"), Monthly ("M").
Plotting:
Bearish Wickless Candles: Plotted with a red circle and a "🐻" emoji above the bar.
Bullish Wickless Candles: Plotted with a green circle and a "🐂" emoji below the bar.
Multi-Timeframe Stoch RSI Alert (5M, 15M, 1H) with BandsJust like the 15m-1h-4h multi-timeframe stoch, but on lower time frames.

PSP / PSC NQWPlots Precision Candles / Precision Swing Points on your Chart, you can change color and transparency.
At the Moment it does not support DXY

Open/Close Candle MarkersHere’s a Pine Script code that will plot lines marking the opening and closing prices of each candle with different colors. This script will work on all timeframes and you can customize the colors as needed.

Hourly Candle Tracker (NY Time)This indicator creates a table to illustrate which hourly timeframes and their respective candlesticks have formed in the current hour as well as what new candlesticks will be opening in the subsequent hour.
The purpose of this indicator is useful for ICT concept's as well as my own methodologies using such concepts. The bodies of candles are paramount when using my concepts, as well as the fractal nature of them. This indicator makes it easier to know which candles have just opened in the current hour as well as which are opening in the next so I and any trader using my methodologies can refer quickly to them.
- R2F Trading

Candle Close TableChecks the previous closes of Daily H4 and H1 candles to give you an idea where the momentum should take us.

RSI Multi-Condition Alerts📌 RSI Multi-Condition Alerts (6, 12, 24) – Automated Trading Signals
This script provides real-time alerts when the RSI (6, 12, 24) crosses key levels, helping traders identify buy and sell opportunities with higher accuracy.
🔹 How It Works:
✅ Buy Signal → RSI (6) crosses above both RSI (12) & RSI (24) (Bullish Momentum)
✅ Sell Signal → RSI (6) crosses below both RSI (12) & RSI (24) (Bearish Momentum)
✅ Custom Alerts → Get notified instantly when conditions are met!
🔹 Ideal For:
✔ Swing Traders & Scalpers
✔ Gold (XAU/USD), Forex, Crypto & Stocks
✔ Trend Reversals & Momentum Trading
🔹 Why Use This?
🔸 Filters out false RSI signals
🔸 Ensures confirmation across multiple RSI levels
🔸 Helps avoid weak breakouts & improves accuracy
💡 Instructions:
1️⃣ Add this script to your TradingView chart
2️⃣ Go to Alerts → Select "RSI Multi-Condition Alerts"
3️⃣ Choose Buy Signal or Sell Signal
4️⃣ Get notified via Popup, Email, or SMS
📈 Boost your trading strategy today with RSI Multi-Condition Alerts! 🚀

Multiple Simple Moving Averages with Bollinger BandsThis is the study on 45 Min Time frame with all quarterly Moving Average

Quarter Theory Lines with Box Around Each Key LevelQuarter Level Theory with Box Around Each Key Level, Credit to MrPresident for the original idea, revamped with additional touches for maximum profits.

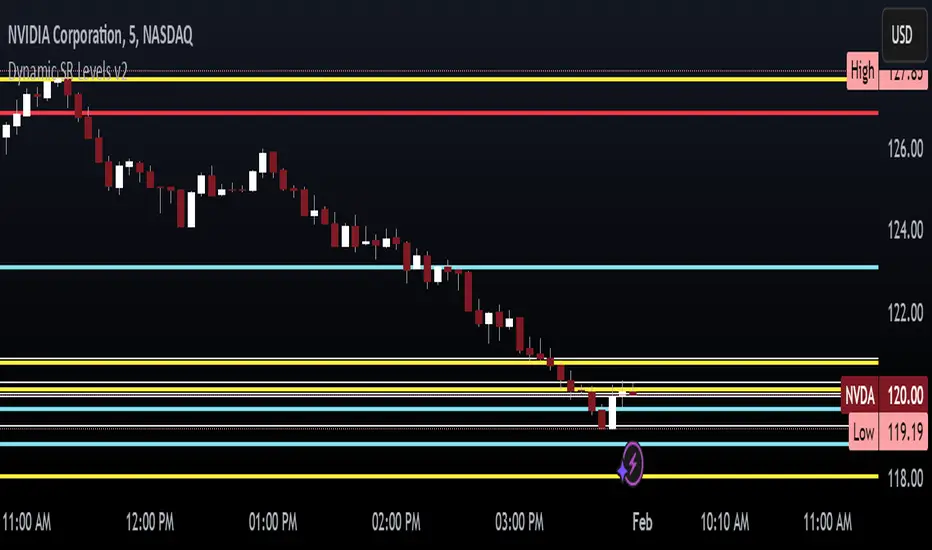
dynamic support and resistance v3**Automatic Multi-Timeframe & Dynamic Support/Resistance Indicator**
This indicator automatically identifies and plots key Support and Resistance levels across multiple timeframes (1H, 4H, Daily) and dynamically adapts to the chart's current timeframe. It provides a comprehensive view of potential price reversal zones, helping traders make more informed decisions.
**Key Features:**
* **Multi-Timeframe Analysis:** Automatically calculates and displays Support and Resistance levels derived from the 1-hour, 4-hour, and Daily timeframes. This allows you to see the bigger picture and anticipate potential price reactions at significant levels. Levels from higher timeframes are often stronger.
* **Dynamic Support & Resistance:** Beyond the fixed timeframe levels, the indicator also dynamically calculates and plots Support and Resistance based on the *currently visible* timeframe of your chart. This ensures you always have relevant levels, regardless of whether you're zoomed in on a 1-minute chart or looking at a weekly view. This dynamic calculation adapts to changing market conditions.
* **Combined View:** All identified Support and Resistance levels (from all timeframes) are plotted on the same chart. This gives you a clear and concise overview of potential areas of interest, simplifying your analysis. Different colors or styles can be used to distinguish between timeframes (e.g., Daily levels could be thicker lines, 4H thinner, and 1H dashed).
* **Customizable:** (Optional - Mention if you offer customization) The indicator may include customizable settings, such as:
* Lookback period for dynamic S/R calculation.
* Strength/sensitivity adjustments for identifying levels.
* Color and style customization for different timeframes.
* Option to toggle visibility of specific timeframe levels.
**Benefits:**
* **Saves Time:** No more manually drawing Support and Resistance lines. The indicator does the work for you.
* **Improved Accuracy:** The automated calculations can help identify key levels that might be missed by manual analysis.
* **Enhanced Visualization:** Seeing all relevant S/R levels on one chart provides a clearer picture of potential price action.
* **Adaptable to Any Timeframe:** Whether you're a scalper or a long-term investor, the dynamic S/R adapts to your trading style.
**How to Use:**
Simply add the indicator to your TradingView chart. The Support and Resistance levels will be automatically calculated and displayed. Use these levels to identify potential entry and exit points, stop-loss placements, and areas where price might encounter resistance or find support.
**Disclaimer:**
This indicator is for informational and educational purposes only. It should not be considered financial advice. Trading involves risk, and you should always do your own research before making any investment decisions. Past performance is not indicative of future results.
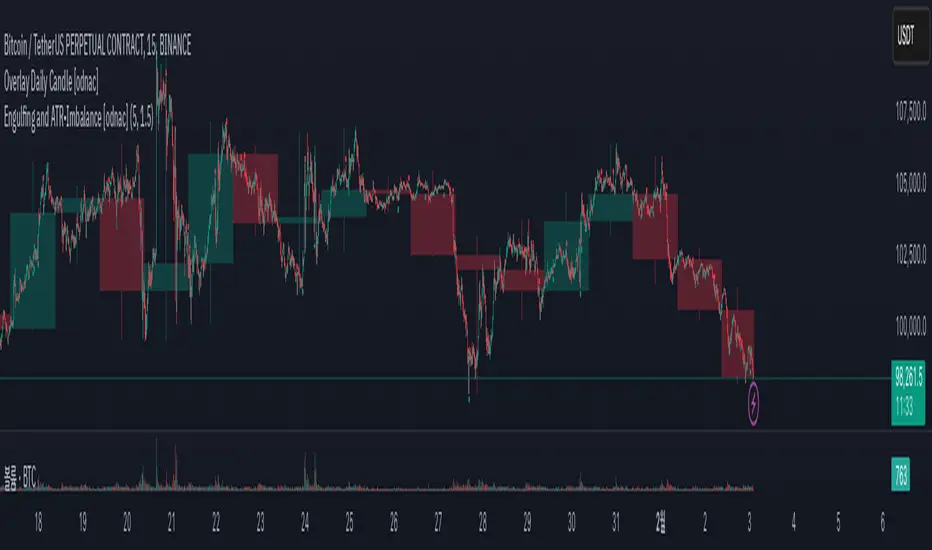
Overlay Daily Candle [odnac]This script is designed to visually overlay the daily candle on various timeframes, allowing traders to quickly assess the shape of the daily candle, its high and low points, and the relationship between the open and close prices.
Additionally, it helps to intuitively identify upward and downward movements by using color-coded bullish and bearish candles.
Key Features
Candle Color Indication: Bullish candles are shown in green, while bearish candles are shown in red.
Candle Body Box: The box represents the body of the daily candle, based on the open and close prices.
Candle Wick: The wicks of the daily candle are drawn to represent the high and low prices.
Date Change Detection: When a new date begins, the previous data is reset, and new boxes and lines are drawn according to the updated date.
How to Use
You can adjust the script’s options to customize the color of bullish and bearish candles, as well as the transparency of the boxes, to suit your personal style.
Talha's Pro Signal (Version 5)Talha's Pro Signal – Smart Trading Indicator
🔹 Talha's Pro Signal is a multi-indicator trading strategy that combines EMA, RSI, and MACD to generate reliable BUY & SELL signals for traders.
✅ Key Features:
. EMA (9 & 21): Identifies trend direction and potential entries.
. RSI (14): Analyzes market strength and overbought/oversold conditions.
. MACD (12, 26, 9): Confirms trend momentum and crossovers.
. ATR-Based SL & TP: Smart risk management with stop loss & take profit levels.
. Clear Entry & Exit Signals: Plots precise BUY & SELL labels and arrows on the chart.
🎯 This indicator is suitable for Forex, Stocks, Crypto, and other markets. Always follow your own analysis and risk management before taking a trade.
📌 Free to Use – Happy Trading! 🚀
Talha's Pro Signal – Smart Trading Indicator
🔹 Talha's Pro Signal হল একটি মাল্টি-ইন্ডিকেটর ট্রেডিং স্ট্র্যাটেজি, যা EMA, RSI ও MACD এর সমন্বয়ে নির্ভরযোগ্য BUY ও SELL সিগন্যাল প্রদান করে।
✅ Key Features:
. EMA (9 & 21): ট্রেন্ড ফলো করে সঠিক এন্ট্রি নির্ধারণ করে।
. RSI (14): মার্কেটের শক্তি ও ওভারবট/ওভারসোল্ড কন্ডিশন বিশ্লেষণ করে।
. MACD (12, 26, 9): ট্রেন্ড কনফার্মেশন ও মোমেন্টাম বিশ্লেষণ করে।
. ATR-Based SL & TP: স্মার্ট রিস্ক ম্যানেজমেন্ট।
. Clear Entry & Exit Signals: চার্টে স্পষ্ট BUY & SELL লেবেল ও অ্যারো প্লটিং।
🎯 এই ইন্ডিকেটরটি ফরেক্স, স্টক, ক্রিপ্টোসহ সব মার্কেটে ব্যবহারযোগ্য। ট্রেড নেওয়ার আগে অবশ্যই নিজের এনালাইসিস ও রিস্ক ম্যানেজমেন্ট অনুসরণ করুন।
📌 Free to Use – Happy Trading! 🚀

5SMA Trend filter w/optional 10,20,50,200 moving averagesTrend filter indicator to determine ideal price action for long or short trades.
Cloud attached between price and 5SMA.
Using the 5SMA direction and relativity to price, two signals to help filter out head fakes.
If price > 5SMA and SMA pointing up then green cloud.
If price < 5SMA and SMA point down then red cloud.
If price > 5SMA and SMA pointing down or price < 5SMA and 5SMA pointing up then
Optional 10,20,50,200 simple moving averages.
Compatible with multiple timeframes.

Smoothed Candle Averages- NovaTheMachineThis script utilizes a series of moving averages that the user is able to change as they see fit for their own use.
The averages plotted for the first 2 waves are the High-Low rays of the selected period of time with the chosen moving average style.
The Bias is the Heikin Ashi High-Low ray plotted over the chosen time period, while the Secondary Bias is a higher Timeframe Bias for the same period of time on a selected higher timeframe.
The visuals for each ray are able to be changed to either; lines, solid wave, or dynamic wave.
The Dynamic waves will change color according to the total dissection and utilize the Min-Max range selected as a weight for the strength of the trend. Thus providing an at-a-glance overview of the price relative to trend.
The key objective with this script is to gauge the longer term trend with the current price action, to establish patterns and determine strength of moves both away from and towards the moving average/bias.
When both waves are trending with the Bias, it can be reasoned that there is a strong trend established, when waves and Bias are mixed or trending sideways it can be reasoned there is a range forming or potential for a direction change. When price has broken the waves and biases we can reasonably assume that a new trend has been formed, using the waves and biases again to determine the strength and length of the trend.
The Table will display whether the current price is above or below each wave, and whether the price is continuing or retracing. The Signals plotted are used to help identify when price has broken a wave more swiftly.

PDC & EMATitle: Dynamic Price & EMA Table with Previous Day Close
Description: This script provides a dynamic table that displays key information about the current price relative to the previous day's close and the 8-period EMA. It helps traders quickly identify potential trading signals based on these conditions. The table adapts for both web and mobile views, ensuring a seamless experience across devices.
Features:
Previous Day Close (PDC): Indicates if the current price is above ("Y") or below ("N") the previous day's close.
8-Period EMA (8EMA): Shows if the current price is above ("Y") or below ("N") the 8-period EMA.
Action Signal: Displays "Calls" if both conditions are met, "Puts" if neither condition is met, and "Hold" if the conditions are mixed.
Customizable Colors: Allows users to set their preferred colors for up, down, and hold signals.
Responsive Design: Adjusts the table layout for optimal viewing on both web and mobile devices.
This script is ideal for traders looking for a quick visual reference to make informed trading decisions based on price and EMA conditions.

RangeLevelsA Range Calculator Indicator is a tool typically used in trading to determine the price range of an asset over a specified period. It calculates the difference between the highest and lowest prices within a set timeframe (e.g., daily, weekly, monthly). This indicator can help traders assess market volatility, identify potential support and resistance levels, and make more informed decisions about entry and exit points. By visualizing the range, traders can better understand price fluctuations and manage risk more effectively. The Range Calculator can be customized to different timeframes and asset types to suit specific trading strategies.

Simplified MA Crossover Strategy with toggle RSI/ATR options1. Strategy Overview
MA Crossover Logic: The strategy uses two simple moving averages (short and long) to generate buy/sell signals.
Buy Signal: When the short MA crosses above the long MA.
Sell Signal: When the short MA crosses below the long MA.
Filters: The strategy includes optional RSI and ATR filters to refine entry conditions.
Risk Management: Includes stop-loss, take-profit, and position sizing based on a percentage of equity.
2. Inputs
MA Lengths:
shortLength: Length of the short MA (default: 9).
longLength: Length of the long MA (default: 21).
RSI Filter:
enableRSI: Toggle to enable/disable the RSI filter.
rsiLength: RSI calculation period (default: 14).
rsiOverbought: Overbought threshold (default: 70).
rsiOversold: Oversold threshold (default: 30).
ATR Filter:
enableATR: Toggle to enable/disable the ATR filter.
atrLength: ATR calculation period (default: 14).
minATR: Minimum ATR threshold for trade entry (default: 0.005).
Risk Management:
stopLossPerc: Stop-loss percentage (default: 0.5%).
riskRewardRatio: Risk-reward ratio for take-profit calculation (default: 2).
riskPercentage: Percentage of equity to risk per trade (default: 2%).
3. Indicators
Moving Averages:
shortMA: Short-term simple moving average.
longMA: Long-term simple moving average.
RSI: Relative Strength Index for filtering overbought/oversold conditions.
ATR: Average True Range for volatility filtering.
4. Trade Conditions
Long Condition:
Short MA crosses above the long MA.
RSI is below the overbought level (if RSI filter is enabled).
ATR is above the minimum threshold (if ATR filter is enabled).
Short Condition:
Short MA crosses below the long MA.
RSI is above the oversold level (if RSI filter is enabled).
ATR is above the minimum threshold (if ATR filter is enabled).
5. Risk Management
Position Sizing:
positionSize: Calculated based on the percentage of equity to risk and the stop-loss level.
Take-Profit and Stop-Loss:
takeProfitLevel: Calculated using the risk-reward ratio.
stopLossLevel: Calculated using the stop-loss percentage.
6. Trade Execution
Long Entry:
Triggers when the long condition is met.
Sets a take-profit and stop-loss level.
Short Entry:
Triggers when the short condition is met.
Sets a take-profit and stop-loss level.
7. Plotting
Moving Averages:
Short MA (blue) and Long MA (red) are plotted on the chart.
RSI Levels:
Overbought (red) and oversold (green) levels are plotted as horizontal lines.
ATR:
ATR is plotted in orange.
Trade Signals:
Buy signals are marked with a green "BUY" label below the bar.
Sell signals are marked with a red "SELL" label above the bar.
8. Customization
You can adjust the input parameters (e.g., MA lengths, RSI/ATR settings, risk management values) to suit your trading preferences.
Disable/enable filters (RSI and ATR) using the enableRSI and enableATR inputs.
9. Notes
This strategy is designed for educational purposes and should be thoroughly tested before use in live trading.
Consider optimizing the parameters (e.g., MA lengths, RSI/ATR thresholds) for specific markets or timeframes.
Ensure proper backtesting and forward testing to evaluate performance under different market conditions.

Timeframe Levels for Price Action📖 Introduction
Timeframe Levels Indicator is a powerful tool for identifying key support and resistance zones based on historical price action. By plotting weekly, daily, and 4-hour closing levels, this indicator helps traders understand where price is likely to:
✅ Range & Consolidate – Identify congestion zones where price action stalls.
✅ Break & Expand – Spot areas where price can rapidly move to the next level.
✅ Form MMXM Structures – Find market maker expansion and distribution levels.
These levels are critical for traders looking to anticipate price action, identify high-probability trade setups, and manage risk effectively.
The indicator dynamically plots historical close price levels across three key timeframes:
✅ Weekly Close Levels – Identify key levels based on weekly closes.
✅ Daily Close Levels – Spot daily open/close levels for refined entries.
✅ 4-Hour Close Levels – Track intra-day significant price points.
⚙️ How It Works
This indicator retrieves and displays the past 10 close levels for each selected timeframe using request.security().
🔹 Lines are customizable – Adjust the number of lines per timeframe (0-10).
🔹 Dynamic styling – Choose colors and line styles (solid, dashed, or dotted).
🔹 Extend historical levels – Lines extend across the chart for easy visualization.
🎨 Customization Options
🔧 Timeframe Selection: Choose how many weekly, daily, and 4-hour levels to display.
🎨 Color Settings: Customize the colors for each timeframe.
📏 Line Styles: Select between solid, dashed, or dotted lines for better visibility.
📊 Why Use This Indicator?
✅ Identify Key Support & Resistance Zones – Track where price has historically reacted.
✅ Adapt to Any Trading Style – Works for scalping, swing trading, and long-term investing.
✅ Enhance Multi-Timeframe Analysis – Quickly compare price action across different timeframes.
📊 How This Helps You Trade
✔ Pinpoint Key Trading Levels – Use past close levels to identify major market turning points.
✔ Confirm Ranges & Expansions – Understand whether price is likely to consolidate or break into a new trend by evaluating the next level above or below.
✔ Optimize Entries & Exits – Avoid getting trapped in congestion zones and capitalize on breakout opportunities. The more overlapping lines, the more congestion.
✔ Backtest Historical Reactions – See how price has responded to these levels in the past to refine your strategy. As price breaks out, any daily or 4 hour level will slow down the continued momentum.
🛠 How to Use
1️⃣ Add the indicator to your TradingView chart.
2️⃣ Adjust the number of levels per timeframe (Weekly, Daily, 4-Hour).
3️⃣ Customize the line colors and styles to match your chart preferences.
4️⃣ Observe how price reacts to historical levels and plan your trades accordingly.
📜 Code Highlights : What Makes This Indicator Powerful?
This Multi-Timeframe Open/Close Levels Indicator is built with dynamic customization, efficiency, and structured market insights in mind. Here are some key highlights of the code:
The script fetches historical closing prices from three critical timeframes:
✅ Weekly Close Levels (W) – Major swing levels for long-term positioning.
✅ Daily Close Levels (D) – Useful for intraday and swing trading.
✅ 4-Hour Close Levels (240) – Ideal for short-term traders and scalpers.
Each timeframe’s close levels act as dynamic support and resistance zones, helping traders spot key areas for price reactions and liquidity grabs.
The indicator retrieves and stores up to 10 past close levels using request.security(), making it easy to track key price points without lagging the chart.
✅ Uses bar_index to extend levels both left and right.
✅ Ensures proper deletion and redrawing of lines to prevent clutter.
✅ Automatically updates levels as new bars print.
Instead of storing all lines at once, the script:
⚡ Deletes old lines before redrawing new ones.
⚡ Uses var line to ensure memory efficiency.
⚡ Prevents exceeding TradingView's 10,000-cell limit by limiting the number of stored lines.
This results in a smooth, non-laggy experience even with multiple timeframes displayed.
The levels plotted by this indicator help traders:
📊 Identify consolidation zones where price might range.
🚀 Spot breakout areas where price expands to the next key level.
📉 Recognize market maker structures (MMXM) to predict liquidity grabs.
These insights give traders a strategic edge in planning their entries, exits, and trade management.
Final Thoughts
This indicator is a powerful tool for traders looking to integrate historical price levels into their strategy.
Whether you’re a scalper, a day trader, or a swing trader, this indicator provides valuable insights into where price is likely to range, reverse, or break out.
Don’t trade blind—trade with structure. Use this tool to refine your entries, exits, and risk management, and start making more confident trading decisions today!
📌 Interested in accessing this indicator? 📩 Contact me for details!
