Rally Base Drop SND Pivots [LuxAlgo]The Rally Base Drop SND Pivots indicator uses "Rally", "Base", and "Drop" Candles to determine pivot points at which supply and demand (SND) levels are drawn.
🔶 USAGE
Rally, Base, and Drop (RBD) candles create a formula for seeing market structure through a fixed methodology. We are able to use this concept to point out pivot areas where Rallies and Drops directly meet.
The RBD SND Pivots are similar to traditionally identified "fractal" pivot points, with one key difference.
RBD SND Pivots detect a specific number of Rally and Drop candles directly back-to-back, requiring one side of the pivot to contain entirely green candles and the other to be entirely red candles or vice versa.
Since these pivot levels are based on Rally, Base, and Drop candles, the method directly implements rigid logic to further structure a trading system when utilizing these pivot levels with traditional SND concepts.
Furthermore, by implementing this logic when looking for pivots, a significant portion of potential noise is naturally filtered out.
🔶 DETAILS
In typical SND systems, the term "Base" is used for multiple meanings.
In this indicator, the base is a product of a pivot being formed. Once a Pivot is identified, the "Base" is marked as the first Rally or Drop of the second half of the pivot formation.
Once the pivot is identified, the high or low of the base candle is used to measure the pivot level.
🔶 SETTINGS
Length: Sets the number of Rally and Drop Candles that the script will require to identify pivots.
Ex. "3" = 3 Rally followed by 3 Drop
Historical Lookback: Hides historic levels based on a bar # Lookback from the current bar.
When set to 0, all Levels will display. (0 by default)
Pivot points and levels
SemiCircle Cycle Notation PivotsFor decades, traders have sought to decode the rhythm of the markets through cycle theory. From the groundbreaking work of HM Gartley in the 1930s to modern-day cycle trading tools on TradingView, the concept remains the same: markets move in repeating waves with larger cycles influencing smaller ones in a fractal-like structure, and understanding their timing gives traders an edge to better anticipate future price movements🔮.
Traditional cycle analysis has always been manual, requiring traders to painstakingly plot semicircles, diamonds, or sine waves to estimate pivot points and time reversals. Drawing tools like semicircle & sine wave projections exist on TradingView, but they lack automation—forcing traders to adjust cycle lengths by eye, often leading to inconsistencies.
This is where SemiCircle Cycle Notation Pivots indicator comes in. Semicircle cycle chart notation appears to have evolved as a practical visualization tool among cycle theorists rather than being pioneered by a single individual; some key influences include HM Gartley, WD Gann, JM Hurst, Walter Bressert, and RayTomes. Built upon LonesomeTheBlue's foundational ZigZag Waves indicator , this indicator takes cycle visualization to the next level by dynamically detecting price pivots and then automatically plotting semicircles based on real-time cycle length calculations & expected rhythm of price action over time.
Key Features:
Automated Cycle Detection: The indicator identifies pivot points based on your preference—highs, lows, or both—and plots semicircle waves that correspond to Hurst's cycle notation.
Customizable Cycle Lengths: Tailor the analysis to your trading strategy with adjustable cycle lengths, defaulting to 10, 20, and 40 bars, allowing for flexibility across various timeframes and assets.
Dynamic Wave Scaling: The semicircle waves adapt to different price structures, ensuring that the visualization remains proportional to the detected cycle lengths and aiding in the identification of potential reversal points.
Automated Cycle Detection: Dynamically identifies price pivot points and automatically adjusts offsets based on real-time cycle length calculations, ensuring precise semicircle wave alignment with market structure.
Color-Coded Cycle Tiers: Each cycle tier is distinctly color-coded, enabling quick differentiation and a clearer understanding of nested market cycles.

Rally Base Drop SND Pivots Strategy [LuxAlgo X PineIndicators]This strategy is based on the Rally Base Drop (RBD) SND Pivots indicator developed by LuxAlgo. Full credit for the concept and original indicator goes to LuxAlgo.
The Rally Base Drop SND Pivots Strategy is a non-repainting supply and demand trading system that detects pivot points based on Rally, Base, and Drop (RBD) candles. This strategy automatically identifies key market structure levels, allowing traders to:
Identify pivot-based supply and demand (SND) zones.
Use fixed criteria for trend continuation or reversals.
Filter out market noise by requiring structured price formations.
Enter trades based on breakouts of key SND pivot levels.
How the Rally Base Drop SND Pivots Strategy Works
1. Pivot Point Detection Using RBD Candles
The strategy follows a rigid market structure methodology, where pivots are detected only when:
A Rally (R) consists of multiple consecutive bullish candles.
A Drop (D) consists of multiple consecutive bearish candles.
A Base (B) is identified as a transition between Rallies and Drops, acting as a pivot point.
The pivot level is confirmed when the formation is complete.
Unlike traditional fractal-based pivots, RBD Pivots enforce stricter structural rules, ensuring that each pivot:
Has a well-defined bullish or bearish price movement.
Reduces false signals caused by single-bar fluctuations.
Provides clear supply and demand levels based on structured price movements.
These pivot levels are drawn on the chart using color-coded boxes:
Green zones represent bullish pivot levels (Rally Base formations).
Red zones represent bearish pivot levels (Drop Base formations).
Once a pivot is confirmed, the high or low of the base candle is used as the reference level for future trades.
2. Trade Entry Conditions
The strategy allows traders to select from three trading modes:
Long Only – Only takes long trades when bullish pivot breakouts occur.
Short Only – Only takes short trades when bearish pivot breakouts occur.
Long & Short – Trades in both directions based on pivot breakouts.
Trade entry signals are triggered when price breaks through a confirmed pivot level:
Long Entry:
A bullish pivot level is formed.
Price breaks above the bullish pivot level.
The strategy enters a long position.
Short Entry:
A bearish pivot level is formed.
Price breaks below the bearish pivot level.
The strategy enters a short position.
The strategy includes an optional mode to reverse long and short conditions, allowing traders to experiment with contrarian entries.
3. Exit Conditions Using ATR-Based Risk Management
This strategy uses the Average True Range (ATR) to calculate dynamic stop-loss and take-profit levels:
Stop-Loss (SL): Placed 1 ATR below entry for long trades and 1 ATR above entry for short trades.
Take-Profit (TP): Set using a Risk-Reward Ratio (RR) multiplier (default = 6x ATR).
When a trade is opened:
The entry price is recorded.
ATR is calculated at the time of entry to determine stop-loss and take-profit levels.
Trades exit automatically when either SL or TP is reached.
If reverse conditions mode is enabled, stop-loss and take-profit placements are flipped.
Visualization & Dynamic Support/Resistance Levels
1. Pivot Boxes for Market Structure
Each pivot is marked with a colored box:
Green boxes indicate bullish demand zones.
Red boxes indicate bearish supply zones.
These boxes remain on the chart to act as dynamic support and resistance levels, helping traders identify key price reaction zones.
2. Horizontal Entry, Stop-Loss, and Take-Profit Lines
When a trade is active, the strategy plots:
White line → Entry price.
Red line → Stop-loss level.
Green line → Take-profit level.
Labels display the exact entry, SL, and TP values, updating dynamically as price moves.
Customization Options
This strategy offers multiple adjustable settings to optimize performance for different market conditions:
Trade Mode Selection → Choose between Long Only, Short Only, or Long & Short.
Pivot Length → Defines the number of required Rally & Drop candles for a pivot.
ATR Exit Multiplier → Adjusts stop-loss distance based on ATR.
Risk-Reward Ratio (RR) → Modifies take-profit level relative to risk.
Historical Lookback → Limits how far back pivot zones are displayed.
Color Settings → Customize pivot box colors for bullish and bearish setups.
Considerations & Limitations
Pivot Breakouts Do Not Guarantee Reversals. Some pivot breaks may lead to continuation moves instead of trend reversals.
Not Optimized for Low Volatility Conditions. This strategy works best in trending markets with strong momentum.
ATR-Based Stop-Loss & Take-Profit May Require Optimization. Different assets may require different ATR multipliers and RR settings.
Market Noise May Still Influence Pivots. While this method filters some noise, fake breakouts can still occur.
Conclusion
The Rally Base Drop SND Pivots Strategy is a non-repainting supply and demand system that combines:
Pivot-based market structure analysis (using Rally, Base, and Drop candles).
Breakout-based trade entries at confirmed SND levels.
ATR-based dynamic risk management for stop-loss and take-profit calculation.
This strategy helps traders:
Identify high-probability supply and demand levels.
Trade based on structured market pivots.
Use a systematic approach to price action analysis.
Automatically manage risk with ATR-based exits.
The strict pivot detection rules and built-in breakout validation make this strategy ideal for traders looking to:
Trade based on market structure.
Use defined support & resistance levels.
Reduce noise compared to traditional fractals.
Implement a structured supply & demand trading model.
This strategy is fully customizable, allowing traders to adjust parameters to fit their market and trading style.
Full credit for the original concept and indicator goes to LuxAlgo.

Refined TPO with Precise Signals for 5-Min ChartAdvanced TPO trading confluence indicator to be used on 5min TF with TPO chart as additional confirmation

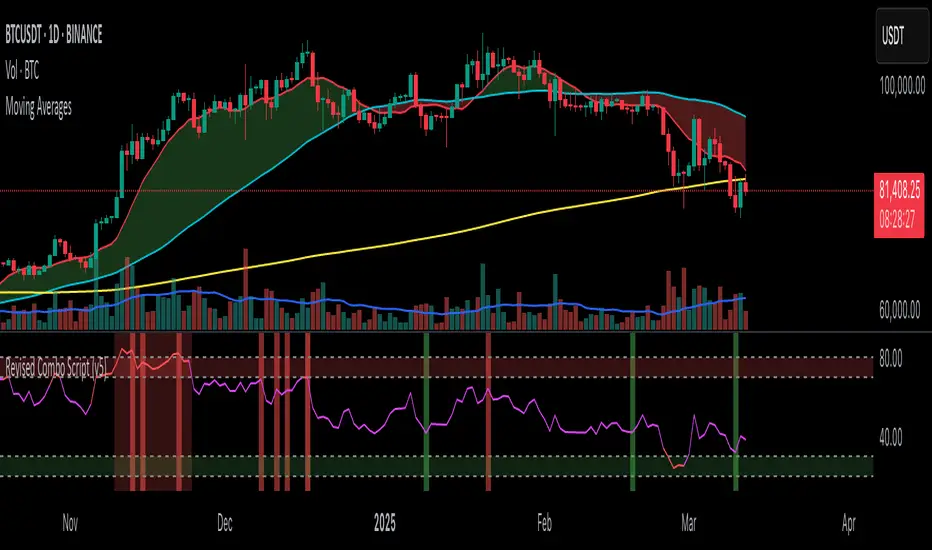
Revised Combo Script with DivergencesRevised Combo Script with Divergences (v5)
This comprehensive TradingView indicator combines multiple technical analysis tools to provide traders with a robust framework for identifying potential buy and sell signals. The script integrates several popular indicators and patterns, including RSI, Stochastic, EMA, Keltner Channels, and candlestick patterns, to enhance decision-making in trading.
Key Features:
RSI Analysis:
Configurable RSI length and overbought/oversold levels.
Visual bands for overbought and oversold conditions.
Divergence detection to identify potential trend reversals.
Stochastic Oscillator:
Customizable %K and %D periods with smoothing options.
Helps identify overbought and oversold conditions in the market.
Exponential Moving Averages (EMA):
Fast and slow EMAs to determine trend direction.
Configurable lengths and offsets for precise tuning.
Keltner Channels:
Dynamic volatility-based channels using true range or range options.
Helps identify potential breakout and reversal points.
Envelope Indicator:
Configurable length and percentage for upper and lower bands.
Option to use EMA or SMA for the basis calculation.
Candlestick Patterns:
Detection of key patterns such as Engulfing, Hammer, Shooting Star, and Doji.
Visual markers for easy identification on the chart.
Trade Signals:
Generates buy and sell signals based on a combination of indicator conditions.
Background color changes to indicate bullish or bearish signals.
Alerts:
Configurable alerts for buy and sell signals, as well as bullish and bearish divergences.
This script is designed for traders who want a comprehensive tool to analyze market conditions and make informed trading decisions. By combining multiple indicators and patterns, it provides a holistic view of the market, helping traders identify potential entry and exit points with greater confidence.
Note: This script is intended for educational purposes and should be used in conjunction with other analysis methods. Always perform your own research and consider risk management strategies before making trading decisions.
EBP WITH SMCEngulfing bar pattern designed to handle liquidity markers and potential trend reversal.
Arrow below candles appear for potential reversal, the most potential are formed at support and resistance

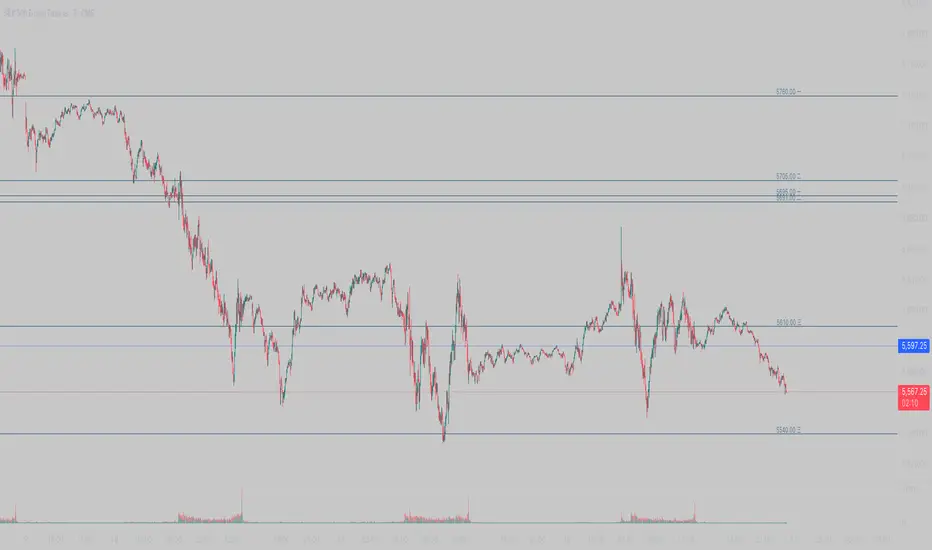
Mancini LevelsOverview
This script draws levels at comma-separated groups of numbers. The settings panel has 3 groups of numbers: 一, 二, 三.
Example
Adding 5900, 5955 in the 二 group will add a horizontal line at 5900 and 5955 with labels 5900 二 and 5955 二.
Purpose
To quickly add Mancini levels (obtained from his newsletter).
Use
1. Get support and resistance levels from Mancini's newsletter. E.g.:
5950 (major), 5938-40 (major), 5924...6096-98 (major), 6104 (major), 6112, 6116 (major)
2. Enter levels here to parse. (Trading View prevents external links, so unfortunately I had to remove the link to my parsing tool. This script can still be used by manually entering Mancini's levels into the corresponding fields in settings.)
3. Copy parsed levels into the corresponding fields in settings.
Notes
1. There's a limit to the number of entries the script will draw correctly. Consider removing regular levels that are far from current price action.
2. Crucial levels are up to the user. Mancini defines regular and major levels in his newsletter; sometimes he emphasizes particular levels, which I place in the crucial category. Easily toggle levels from regular or major to crucial using the parsing tool in step 2 above.
Financial Frontline - 2 [drshah93]Financial Frontline - 2: A Comprehensive Technical Indicator by drshah93
The Financial Frontline - 2 indicator is a robust and multi-faceted tool designed to help traders analyze price action from multiple perspectives by combining several well-known technical analysis concepts into a unified interface. This script is a mashup of four distinct tools, each focused on different aspects of price behavior. By integrating Central Pivot Range (CPR), Opening Range Breakout (ORB), Daily/Weekly High & Low levels, and the Wave Trend Oscillator (WT), the indicator provides traders with a powerful suite of market insights on a single chart.
________________________________________
Key Components of the Script
1. Central Pivot Range (CPR):
o Concept: The Central Pivot Range (CPR) is a technical analysis tool that helps traders determine support and resistance levels, market trends, and possible breakout points for the day. It is built on the idea that the market tends to stay within certain ranges for most of the trading day, and it gives an idea of where the price is likely to move next based on previous prices.
o How it works: The CPR is calculated using the Pivot Point (average of the high, low, and close prices), Top Central (TC), and Bottom Central (BC) values. Along with the CPR, the script also plots resistance (R1, R2, R3, R4) and support (S1, S2, S3, S4) levels. These levels are based on the previous day's price action and can help identify potential breakout and breakdown points.
o Usage: Traders can use the CPR and the plotted resistance and support levels to identify potential reversal zones or breakout points. A move above the pivot point may signal bullish momentum, while a drop below the pivot may indicate bearishness. The levels can also be used as targets for profit-taking.
o Timeframe Flexibility: By using a daily resolution (with an option to choose “Daily” or “Tomorrow”), the script retrieves and then plots these CPR levels on intraday charts. This offers a macro view that traders can use to align short-term trades with broader support/resistance zones.
2. Opening Range Breakout (ORB):
o Concept: The Opening Range Breakout strategy relies on the idea that price action during the initial minutes of trading can reveal the direction of the market for the rest of the trading session. It identifies the high and low range of price movements during a user-defined opening period (typically 30 minutes to 1 hour) and uses this range as a potential breakout point.
o How it works: The script allows the trader to define the length of the opening range, which will be used to plot two key levels: the Opening Range High and Opening Range Low. These levels act as dynamic support and resistance levels, where a breakout beyond either level is seen as a signal for the continuation of the trend.
o Usage: If price breaks above the opening range high, it may indicate a bullish trend, while a break below the opening range low could indicate a bearish trend. Traders can enter positions based on breakouts from these key levels, with targets aligned with key support/resistance levels from CPR or other price zones.
3. Daily/Weekly High & Low:
o Concept: Understanding where the price has recently reached extremes on higher timeframes (daily or weekly) is a critical part of identifying potential turning points, support/resistance zones, or breakouts. The Daily High/Low and Weekly High/Low are essential for gauging the broader trend and locating price areas that have significant importance.
o How it works: The script plots the Daily High and Low, Weekly High and Low, and the Previous Day's High and Low as important reference points on the chart. These levels represent the most recent price extremes and are crucial for identifying key support and resistance zones.
o Usage: Traders can use the daily and weekly highs/lows to identify zones of price rejection or breakouts. A price that tests the Daily High but fails to break through could indicate a potential reversal, while a break of the Weekly High could suggest an uptrend continuation.
4. Wave Trend Oscillator (WT):
o Concept: The Wave Trend Oscillator (WT) is a momentum-based indicator designed to identify overbought and oversold conditions, helping traders identify potential trend reversals. It uses the concept of Exponential Moving Averages (EMA) and Smoothed Price Channels to measure the rate of change in price momentum.
o How it works: The WT is calculated by first smoothing the price using an EMA and then using this smoothed value to calculate the oscillator. The script plots the WT1 (main oscillator) and WT2 (signal line) along with overbought/oversold levels, which indicate when the market is potentially overheated or oversold.
o Usage: The WT is useful for detecting changes in momentum. A crossover of the WT1 and WT2 lines can signal potential trend reversals. When the WT crosses above the overbought level, it may signal a potential market top, while crossing below the oversold level suggests a potential market bottom.
________________________________________
How the Components Work Together
The combination of these indicators allows traders to gain a comprehensive view of the market. Each component of this tool serves a specific purpose, and together they provide a multi-faceted approach to market analysis:
• CPR provides a solid understanding of support and resistance levels, offering reference points for breakout or breakdown opportunities.
• ORB highlights key intraday price action during the opening period, offering insights into market momentum and breakout levels.
• Daily/Weekly High & Low levels offer context for longer-term market structure and can help traders anticipate where price might face resistance or support.
• WT gives traders an oscillator to measure momentum, which helps in identifying overbought/oversold conditions, aiding in trend reversal signals.
When used together, these tools give a holistic picture of the market, combining price levels, momentum analysis, and breakout strategies into a single, easy-to-read chart.
________________________________________
How to Use the Script
1. Enable the Tools:
o The script allows you to enable or disable each component via the settings (CPR, Opening Range Breakout, Daily/Weekly High/Low, and Wave Trend Oscillator). You can customize these to suit your trading style.
2. Interpret the Plot:
o The CPR levels (pivot point, resistance, and support) help guide your trading decisions based on price action.
o The Opening Range provides an intraday breakout strategy. Watch for price to move beyond the opening range to confirm trend direction.
o The Daily and Weekly High/Low offer larger time-frame context, which can guide you in setting profit targets and stop-loss levels.
o The Wave Trend Oscillator provides momentum signals, with overbought and oversold levels acting as potential turning points.
3. Integrate with Your Strategy:
o This script is ideal for day traders and swing traders. Use it to identify key levels for entries and exits, or to manage risk by placing stop-loss orders around the critical levels identified by CPR and Opening Range.
o Momentum-based traders can rely on the Wave Trend Oscillator to time their entries and exits, taking advantage of potential market reversals.
________________________________________
Practical Usage Tips
• Entry & Exit Points: Use the CPR and daily/weekly levels as zones where price is likely to react. Combine these with signals from the wave trend oscillator (such as a crossover or extreme reading) to time entries or exits.
• Breakout Confirmation: Monitor the opening range breakout levels. A clear move above the opening high (or below the opening low) that aligns with momentum from the oscillator might confirm a new trend direction.
• Risk Management: The multiple support/resistance layers help in setting stop-loss levels. For instance, if the price is trading near S1, a break below it might justify a tighter stop or a position adjustment.
• Adjustable Parameters: Experiment with the input parameters (like the channel and average lengths in the oscillator or the duration of the opening range) to match the behavior of the asset you are trading.
________________________________________
Final Thoughts
The Financial Frontline - 2 script is a versatile and powerful tool for traders looking for an all-in-one solution to monitor price action, breakout points, momentum, and key levels in the market. By combining popular indicators and methodologies like Central Pivot Range, Opening Range Breakout, High/Low levels, and the Wave Trend Oscillator, this script offers a unique and original approach to technical analysis. Whether you're an intraday trader or a swing trader, this tool can help enhance your decision-making and improve your market analysis.

Next Day Camarilla Pivot PointsIf you trade Camarillo Pivot Points, it can be useful to know a few hours before the end of the day where support and resistance will be located the following day. The following script can help you do that.

Auto Draw ToolAuto Draw Tool for TradingView – Trend, Support/Resistance & Fibonacci Indicator ( HIMANSHU AGNIHOTRY)
The Auto Draw Tool is a powerful TradingView indicator that automatically detects trend lines, support & resistance levels, and Fibonacci retracement zones. It helps traders identify key price levels and market trends without manual effort.
🔹 Features
✔ Automatic Support & Resistance Detection – Finds the strongest price levels based on past highs and lows
✔ Trend Line Auto-Plotting – Detects market trends using swing highs and lows
✔ Fibonacci Retracement Levels – Highlights key retracement points for potential reversals
✔ Candlestick Pattern Detection – Identifies bullish and bearish engulfing patterns
✔ Background Alerts for Patterns – Highlights candlestick patterns with color-coded backgrounds
✔ Works on Any Timeframe – Suitable for scalping, swing trading, and long-term investing
🛠 How It Works?
Support & Resistance Levels: The script calculates the highest and lowest price levels within a given lookback period.
Trend Line Identification: It detects swing highs and swing lows to draw automatic trend lines.
Fibonacci Retracement: The script marks important Fibonacci levels (0%, 23.6%, 38.2%, 50%, 61.8%, 78.6%, 100%) for potential entry and exit points.
Engulfing Candlestick Patterns: It recognizes bullish engulfing and bearish engulfing patterns, which indicate strong buying or selling pressure.
Alerts & Background Highlighting: When an engulfing pattern is detected, the background color changes (green for bullish, red for bearish).
🔔 Alerts & Signals
🚀 Bullish Engulfing Detected: Green background & buy signal alert
🚀 Bearish Engulfing Detected: Red background & sell signal alert
🎯 Who Can Use It?
✅ Day Traders & Scalpers – Quickly identify key price action levels
✅ Swing Traders – Find strong support/resistance and Fibonacci retracement areas
✅ Trend Followers – Confirm trend direction with auto-drawn trend lines
✅ Price Action Traders – Get real-time candlestick pattern alerts

Custom Support & Resistance with 3 LevelsThis Pine Script indicator calculates and displays three levels of support and resistance based on the opening price of the first bar of the day.
Here's how it works:
Identifies the Day's Open: The indicator first determines the opening price of the trading day. It does this by checking if the current bar's day is different from the previous bar's day. If it is, it stores the current bar's opening price as the day's opening price.
Calculates Support and Resistance: The user provides six input values: three for calculating resistance levels and three for calculating support levels. These values are added to or subtracted from the day's opening price to determine the three support and resistance levels.
Plots the Levels: The indicator then plots these six levels on the chart as horizontal lines. Resistance levels are typically plotted in shades of red, orange, and yellow, while support levels are plotted in shades of green, blue, and purple.
Key Features:
Day-Based Calculation: The support and resistance levels are anchored to the opening price of the day, providing a consistent reference point regardless of intraday price fluctuations.
Multiple Levels: The indicator provides three levels each for support and resistance, giving traders a broader perspective on potential price turning points.
Customizable: Traders can adjust the values used to calculate the support and resistance levels, allowing for flexibility and adaptation to different trading styles and markets.
Potential Use Cases:
Identifying Entry and Exit Points: Traders can use the support and resistance levels to identify potential entry points for long trades (near support) and short trades (near resistance), as well as exit points for existing positions.
Setting Stop-Loss Orders: The support and resistance levels can be used to set stop-loss orders to limit potential losses.
Gauging Trend Strength: A strong break above a resistance level can indicate bullish momentum, while a break below a support level can suggest bearish pressure.
This indicator can be a valuable tool for traders seeking to incorporate support and resistance levels into their technical analysis. However, it's important to remember that these levels are not absolute guarantees of price reversals and should be used in conjunction with other technical indicators and risk management strategies.

52W CP/H & H/L with percentage % differences52 Week High/Low Indicator with percentage difference between High/Low & High/Current Price
A simple indicator that can be used on any timeframe to display the 52 week High/Low values along with percentage differences (rounded) between High/Low & High/Current Price to get an idea of the strength in the instruments current price to it's 52 week journey.
Features
* Works on any timeframe.
* Simple horizontal lines showing only the current 52 week values.
* Allows the user to select whether to calculate the 52-week values from candle close values or the respective highs/lows.
* Allows users to toggle percentages label on/off
This script is open source for users to refine as per their needs. Additionally I would appreciate any constructive feedback. Thank you

Trade & Run PP SuperTrendPP SuperTrend – Pivot-Based Trend Detection
This is the second element of the Trade & Run Dashboard , designed to be used in confluence with the other indicators to assist in both immediate trade execution and future trade planning.
PP SuperTrend enhances trend detection by integrating Pivot Points with an ATR-based trailing stop, dynamically adapting to price action to highlight potential trend shifts.
✔ Detects trend shifts with clear BEAR and BULL signals.
✔ Works across multiple timeframes.
✔ Designed to be used alongside other Trade & Run indicators for strategic decision-making.
Each component of the Trade & Run Dashboard is structured to maintain both strategic and visual coherence, ensuring clarity in decision-making.
Assume that every market movement has a specific timeframe. However, it always originates from the smallest timeframe before expanding to higher ones.
Full Dashboard works only on specific TF :
Trade & Run WaveTrend HTF
Trade & Run MTF BB Average Price Zone
Trade & Run MTF RSI Average
M1
M5
M15
H1
H4

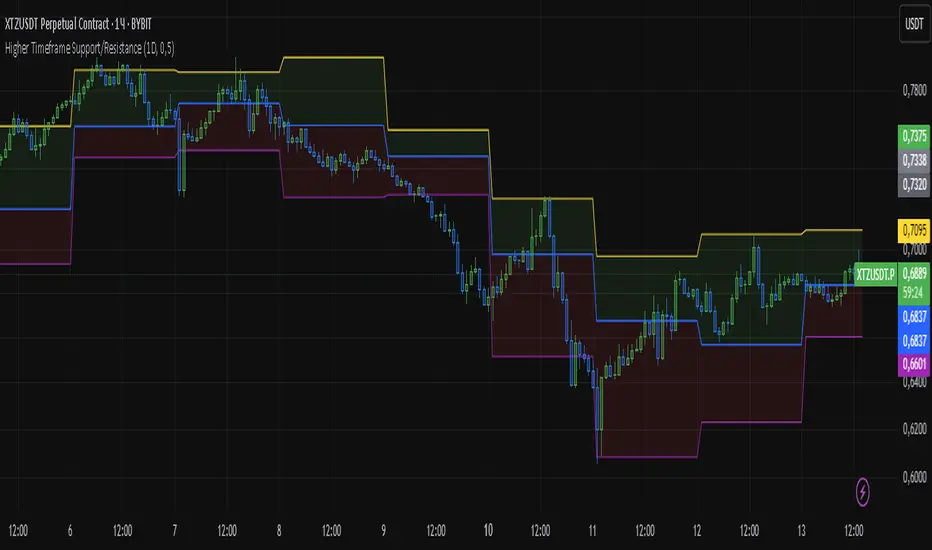
Higher Timeframe Support/ResistanceMulti-Timeframe Support/Resistance Indicator
This TradingView indicator helps you monitor important support and resistance levels based on the previous candle’s high, low, and close from a higher timeframe. By default, it uses a daily timeframe, but you can adjust this to any timeframe you want.
Key Features:
- Previous Candle High (PCH) and Previous Candle Low (PCL):
These levels are plotted on your chart (if enabled) and can act as potential support and
resistance zones. You can toggle the visibility of these levels.
- Pivot, Resistance (R1), and Support (S1):
The script calculates Pivot, R1 (Resistance), and S1 (Support) levels based on the previous
candle's price action from the selected higher timeframe.
These levels are displayed on your chart and can be used to identify potential breakout or
reversal points.
- Alert Feature:
Alerts are triggered when the price approaches any of these key levels (PCH, PCL, Pivot, R1,
or S1) within a specified threshold (e.g., 0.5%).
This helps traders react quickly to potential price movements near critical levels.
- Visual Representation:
The script visually fills the areas between Pivot and R1 (Resistance-Pivot Zone) and Pivot and
S1 (Support-Pivot Zone) with color for easy identification of key price zones.
Smart MA CrossoverSmart MA Crossover Indicator
This custom indicator helps traders identify key buy and sell signals based on the crossover of price and a customizable moving average (MA). It combines trend direction, momentum, and volume to provide accurate entry signals with dynamic visual cues.
Features:
- Customizable Moving Average (MA): Choose from various MA types such as SMA, EMA, HMA, and more.
- Buy & Sell Signals: Signals are generated based on strong trend momentum and volume, with the addition of crossovers from a moving average.
- Background Coloring: The chart background turns green when in an uptrend and red during a downtrend, offering a quick visual guide to market conditions.
- Volume Confirmation: Signals are validated with volume filters to ensure strong market participation.
- Alerts: Set alerts for buy and sell signals to receive real-time notifications.
How It Works:
Buy Signal: Triggered when the price is above the selected MA, with bullish momentum (closing more than 0.5% higher than the open), and accompanied by a volume spike.
Sell Signal: Triggered when the price is below the selected MA, with bearish momentum (closing more than 0.5% lower than the open), and a corresponding volume surge.

Flat Tenkan-sen MarkerThis Pine Script indicator identifies and marks periods where the Tenkan-sen line of the Ichimoku system becomes flat, signaling potential consolidation phases. Users can specify the minimum number of consecutive flat candles required to trigger these markers, aiding in the detection of ranging markets and potential support or resistance zones

Key Levels by MoneyTribe21This script provides dynamic tracking of the following:
ATH - tracks the all time high price
PDH - tracks the previous day high price
PDL - tracks the previous day low price
RESISTANCE - based on the current day high
SUPPORT - based on the current day low
DAILY OPEN - tracks the market open price at the start of the day
This script is provided by www.moneytribe21.com
all rights reserved © Justin Harrison

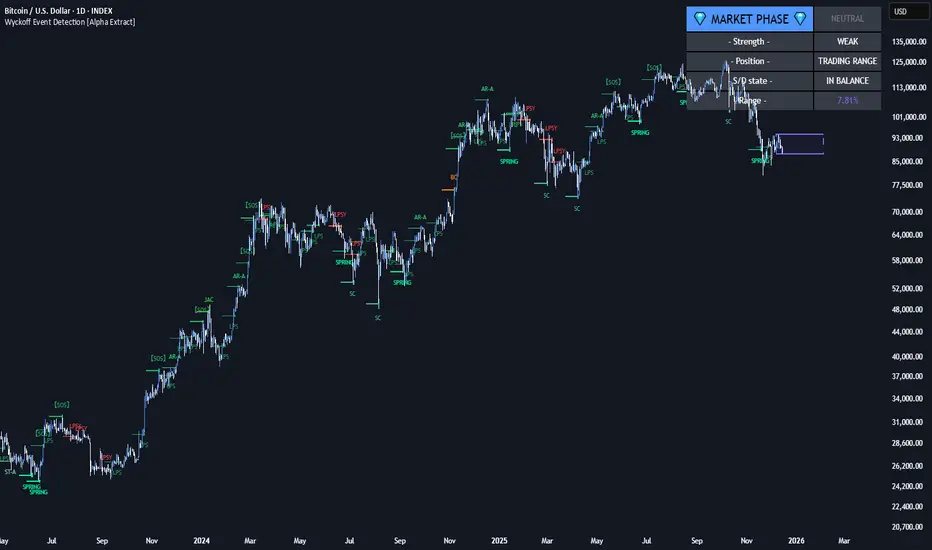
Wyckoff Event Detection [Alpha Extract]Wyckoff Event Detection
A powerful and intelligent indicator designed to detect key Wyckoff events in real time, helping traders analyze market structure and anticipate potential trend shifts. Using volume and price action, this script automatically identifies distribution and accumulation phases, providing traders with valuable insights into market behavior.
🔶 Phase-Based Detection
Utilizes a phase detection algorithm that evaluates price and volume conditions to identify accumulation (bullish) and distribution (bearish) events. This method ensures the script effectively captures major market turning points and avoids noise.
🔶 Multi-Factor Event Recognition
Incorporates multiple event conditions, including upthrusts, selling climaxes, and springs, to detect high-probability entry and exit points. Each event is filtered through customizable sensitivity settings, ensuring precise detection aligned with different trading styles.
🔶 Customizable Parameters
Fine-tune event detection with adjustable thresholds for volume, price movement, trend strength, and event spacing. These inputs allow traders to personalize the script to match their strategy and risk tolerance.
// === USER INPUTS ===
i_volLen = input.int(20, "Volume MA Length", minval=1)
i_priceLookback = input.int(20, "Price Pattern Lookback", minval=5)
i_lineLength = input.int(15, "Line Length", minval=5)
i_labelSpacing = input.int(5, "Minimum Label Spacing (bars)", minval=1, maxval=20)
❓How It Works
🔶 Event Identification
The script scans for key Wyckoff events by analyzing volume spikes, price deviations, and trend shifts within a user-defined lookback period. It categorizes events into bullish (accumulation) or bearish (distribution) structures and plots them directly on the chart.
// === EVENT DETECTION ===
volMA = ta.sma(volume, i_volLen)
highestHigh = ta.highest(high, i_priceLookback)
lowestLow = ta.lowest(low, i_priceLookback)
🔶 Automatic Filtering & Cleanup
Unconfirmed or weak signals are filtered out using customizable strength multipliers and volume thresholds. Events that do not meet the minimum conditions are discarded to keep the chart clean and informative.
🔶 Phase Strength Analysis
The script continuously tracks bullish and bearish event counts to determine whether the market is currently in an accumulation, distribution, or neutral phase. This allows traders to align their strategies accordingly.
🔶 Visual Alerts & Labels
Detects and labels key Wyckoff events directly on the chart, providing immediate insights into market conditions:
- PSY (Preliminary Supply) and UT (Upthrust) for distribution phases.
- PS (Preliminary Support) and SC (Selling Climax) for accumulation phases.
- Labels adjust dynamically to avoid chart clutter and improve readability.
🔶 Entry & Exit Optimization
By highlighting supply and demand imbalances, the script assists traders in identifying optimal entry and exit points. Wyckoff concepts such as springs and upthrusts provide clear trade signals based on market structure.
🔶 Trend Confirmation & Risk Management
Observing how price reacts to detected events helps confirm trend direction and potential reversals. Traders can place stop-loss and take-profit levels based on Wyckoff phase analysis, ensuring strategic trade execution.
🔶 Table-Based Market Analysis (Table)
A built-in table summarizes:
- Market Phase: Accumulation, Distribution, or Neutral.
- Strength of Phase: Weak, Moderate, or Strong.
- Price Positioning: Whether price is near support, resistance, or in a trading range.
- Supply/Demand State: Identifies whether the market is supply or demand dominant.
🔶 Why Choose Wyckoff Market Phases - Alpha Extract?
This indicator offers a systematic approach to understanding market mechanics through the lens of Wyckoff's time-tested principles. By providing clear and actionable insights into market phases, it empowers traders to make informed decisions, enhancing both confidence and performance in various trading environments.
[COW] Day Percent LevelsThis indicator plots on your chart 2 levels, the daily percentage changes required to know by most prop firms and other exchanges. 5% is often a cutoff point for prop firm day traders and can get you banned if you trade past these levels. This indicator allows you to adjust the percentage as well as the lines and labels to your liking.
This is key when using prop firms as it is a level you must be aware of when trading. This can help you avoid being banned, your account being closed, or other disciplinary action based on trading past these levels.
Enjoy!

Pivot Points [FSL]Pivot Points Indicator Description
This indicator provides a comprehensive suite of pivot point calculations and moving average overlays, designed to assist traders in identifying potential support and resistance levels.
Key Features:
Pivot Point Calculations:
Offers six pivot point calculation methods: Traditional, Fibonacci, Woodie, Classic, DM, and Camarilla.
Allows flexible pivot timeframe selection, including Auto (adapts to chart timeframe), Daily, Weekly, Monthly, Quarterly, Yearly, Biyearly, Triyearly, Quinquennially, and Decennially.
Provides the option to use daily-based values for pivot calculations, even on intraday charts.
Displays a user-defined number of historical pivot point levels.
Allows customization of the colors and display of each pivot level (P, S1-S5, R1-R5).
Allows to show labels and prices of each pivot level, and to change the labels position (Left or Right).
Allow
s to change the line width of the pivot levels.
Moving Average Overlays:
In
cludes Exponential Moving Averages (EMA) for 25, 50, and 100 periods.
Displays Volume Weighted Average Price (VWAP).
Allows individual toggling of each EMA and VWAP display.
Allows to ch
ange the line width of the moving averages.
Customization:
Extensi
ve input options for tailoring the indicator to individual trading preferences.
Clear and organized settings groups for easy adjustment.
Error management, that shows clear messages when there is not enough data to calculate the pivot poin
ts.
How to Use:
Select Pivot Type: Choose the desired pivot point calculation method.
Set P
ivot Timeframe: Select the timeframe for pivot calculations. Auto mode dynamically adjusts to the chart.
Adjust Historical Pivots: Specify the number of historical pivot levels to display.
Configure Moving Averages: Toggle and customize the EMA and VWAP overlays.
Customize Pivot Levels: Adjust colors, visibility, and labels for each pivot level.
Analyze and Trade: Use the displayed pivot levels and moving averages to identify potential support, re
sistance, and trend direction.
Benefits:
Provides a versatile tool for identifying potential trading opportunities.
Offers a wide range of customization options to suit various trading styles.
Combines pivot points and moving averages for enhanced analysis.
Helps traders to have a clear view of the support and resistance levels, and the trend direction.
Helps to avoid errors by showing clear messages.

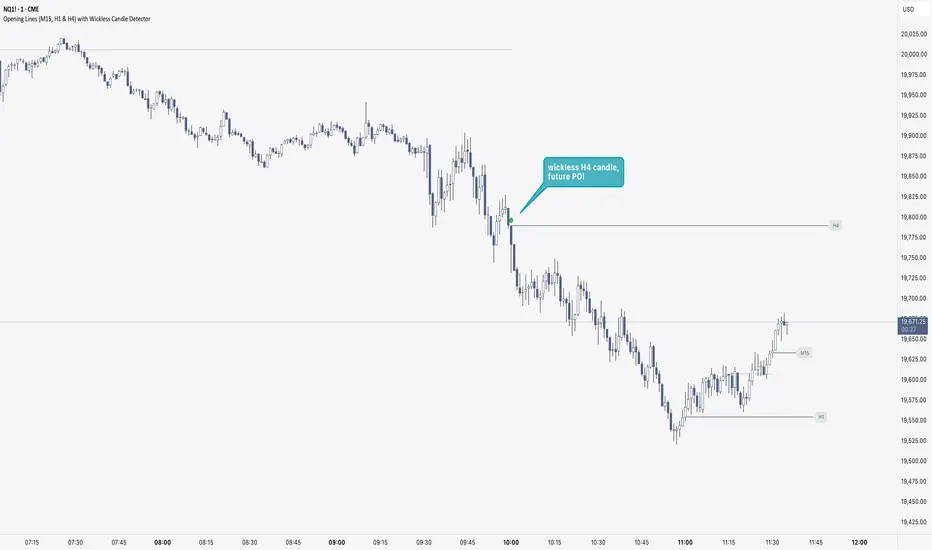
Opening Lines (M15, H1 & H4) with Wickless Candle DetectorTailored for day traders, this technical analysis indicator serves as a multi-timeframe opening price visualization tool, displaying real-time and historical opening price levels across three distinct time intervals to enhance pattern identification and strategic decision-making. Additionally, the tool incorporates a ‘Wickless Candle Detector’ feature, which annotates candles that open without upper or lower wicks. Empirical observations suggest these wickless candles often act as future price magnets, particularly in index futures such as the Nasdaq and S&P500, making them critical reference points for market analysis.
Key Features:
1) Multi-Timeframe Opening Price Visualization:
◦ Plots horizontal reference lines for opening prices across:
✓ 15-minute (M15)
✓ 1-hour (H1)
✓ 4-hour (H4) timeframes
◦ Lines dynamically extend throughout their respective periods or can be configured to a fixed bar offset
2) Wickless Candle Detection:
◦ Automatically marks wickless candles with a discrete symbol at their opening price level
◦ Symbols are removed upon either:
✓ Price breaching the opening level by ≥1 tick
✓ A 24-hour expiration period (whichever occurs first)
3) Customization and Flexibility:
◦ Toggle visibility for individual timeframes, historical opening lines, and the Wickless Candle Detector
◦ Full customization of visual elements (colors, line styles, symbols) to align with user preferences or trading platform themes
Opening Lines (M15, H1 & H4) with Wickless Candle DetectorTailored for day traders, this technical analysis indicator serves as a multi-timeframe opening price visualization tool, displaying real-time and historical opening price levels across three distinct time intervals to enhance pattern identification and strategic decision-making. Additionally, the tool incorporates a ‘Wickless Candle Detector’ feature, which annotates candles that open without upper or lower wicks. Empirical observations suggest these wickless candles often act as future price magnets, particularly in index futures such as the Nasdaq and S&P500, making them critical reference points for market analysis.
Key Features:
1) Multi-Timeframe Opening Price Visualization:
◦ Plots horizontal reference lines for opening prices across:
▪ 15-minute (M15)
▪ 1-hour (H1)
▪ 4-hour (H4) timeframes
◦ Lines dynamically extend throughout their respective periods or can be configured to a fixed bar offset
2) Wickless Candle Detection System:
◦ Automatically marks wickless candles with a discrete symbol at their opening price level
◦ Symbols are removed upon either:
▪ Price breaching the opening level by ≥1 tick
▪ A 24-hour expiration period (whichever occurs first)
3) Customization and Flexibility:
◦ Toggle visibility for individual timeframes, historical opening lines, and the Wickless Candle Detector
◦ Full customization of visual elements (colors, line styles, symbols) to align with user preferences or trading platform themes

ORB MOTORB MOT - Opening Range Breakout Indicator (Educational purpos only)
The ORB MOT (Opening Range Breakout Multi-Option Tool) is a powerful TradingView indicator designed to help traders identify and capitalize on market breakouts based on the opening range. This tool provides extensive customization options, allowing traders to fine-tune their breakout strategies according to different timeframes and trading sessions.
Key Features:
Configurable Opening Range: Traders can define the opening range period (1, 2, 3, 5, 15, or 30 minutes) to suit their trading strategy.
Session-Based Analysis: The indicator automatically adjusts for market session times and provides an optional international override for different time zones.
Visual Representation: ORB levels are displayed with clear labels, shaded regions, and customizable colors for easy identification.
Breakout and Retest Detection: Identifies breakout points and potential retests, helping traders make informed decisions.
Multiple Price Targets: Calculates and plots key levels such as 50%, 100%, 150%, and 200% price targets for potential trade exits.
Fibonacci Extensions: Optional Fibonacci targets (21.2%, 61.8%) can be displayed for additional market confluence.
Alerts and Notifications: Provides alerts for breakout conditions, ensuring traders don’t miss critical movements.
How It Works:
The indicator calculates the high and low of the selected opening range.
Breakout points are identified when price crosses above or below the range.
The indicator plots multiple price targets based on the range's size.
Traders can visualize past ORB levels and retests for better trend analysis.
Alerts notify users of significant breakout events.
Who Can Use This Indicator?
Scalpers & Day Traders: Perfect for identifying quick breakout opportunities.
Swing Traders: Helps determine key levels for potential reversals or trend continuations.
Institutional & Retail Traders: Useful for analyzing market structure and setting price targets.
The ORB MOT indicator is a must-have tool for traders looking to refine their breakout strategy with precision and ease. Whether you're a beginner or an experienced trader, this indicator provides valuable insights into market movements and trading opportunities.
