LeaderTitle: Leader
Category: Technical Analysis Indicator
Version: Pine Script v5
Author: Syed Irfan Baksh
Market: Works on all instruments & timeframes
Description:
The Leader indicator is a powerful trading tool designed for trend-based traders. It identifies high-probability buy and sell signals using a combination of Exponential Moving Averages (EMA), Relative Strength Index (RSI), and Stochastic Oscillator to minimize false entries.
💡 Key Features:
✅ EMA Trend Confirmation – Uses 9-period and 21-period EMAs to confirm bullish/bearish trends.
✅ RSI Strength Filter – Prevents weak signals by requiring RSI above 55 for buys and below 45 for sells.
✅ Stochastic Confirmation – Ensures oversold/overbought conditions are accounted for, reducing false breakouts.
✅ Clear Visual Alerts – Displays BUY and SELL signals directly on the chart for easy interpretation.
✅ Universal Compatibility – Works on all assets (Forex, Stocks, Crypto, Commodities) and all timeframes.
How to Use:
📈 Buy Signal:
The 9 EMA crosses above the 21 EMA.
RSI is above 55, indicating strong bullish momentum.
Stochastic (%K and %D) is above 25, confirming upward movement.
📉 Sell Signal:
The 9 EMA crosses below the 21 EMA.
RSI is below 45, signaling bearish momentum.
Stochastic (%K and %D) is below 75, confirming downward pressure.
Sentiment

Agent Nafri AlertsTitle: Agent Nafri Alerts
Category: Technical Analysis Indicator
Version: Pine Script v5
Author: Syed Irfan Baksh
Market: Works on all instruments & timeframes
Description:
The Agent Nafri Alerts indicator is a sophisticated and versatile trading tool designed for traders who rely on trend-based strategies. By combining Exponential Moving Averages (EMA), Relative Strength Index (RSI), and Stochastic Oscillator, this indicator provides high-probability buy and sell signals while minimizing false entries. Whether you're trading Forex, Stocks, Crypto, or Commodities, this indicator adapts seamlessly to all assets and timeframes, making it a must-have tool for traders of all levels.
💡 Key Features:
EMA Trend Confirmation
Uses a 9-period EMA and a 21-period EMA to confirm bullish or bearish trends.
A crossover of the 9 EMA above the 21 EMA signals a potential uptrend, while a crossover below indicates a potential downtrend.
RSI Strength Filter
Filters out weak signals by requiring the RSI to be above 55 for buy signals and below 45 for sell signals.
Ensures that trades are only taken when momentum is strong and aligned with the trend.
Stochastic Confirmation
Adds an additional layer of confirmation by requiring the Stochastic Oscillator (%K and %D) to be above 25 for buy signals and below 75 for sell signals.
Helps avoid false breakouts by ensuring overbought or oversold conditions are respected.
Clear Visual Alerts
Displays BUY and SELL signals directly on the chart with intuitive labels and colors for easy interpretation.
Alerts are accompanied by sound notifications, ensuring you never miss a trading opportunity.
Universal Compatibility
Works flawlessly across all markets, including Forex, Stocks, Crypto, and Commodities.
Adapts to all timeframes, from 1-minute charts to weekly charts, making it suitable for scalpers, day traders, and swing traders alike.
🛠 How to Use:
📈 Buy Signal Conditions:
The 9 EMA crosses above the 21 EMA, confirming a bullish trend.
The RSI is above 55, indicating strong bullish momentum.
The Stochastic Oscillator (%K and %D) is above 25, confirming upward movement.
When all three conditions are met, a BUY signal is generated, and a visual alert is displayed on the chart.
📉 Sell Signal Conditions:
The 9 EMA crosses below the 21 EMA, confirming a bearish trend.
The RSI is below 45, signaling bearish momentum.
The Stochastic Oscillator (%K and %D) is below 75, confirming downward pressure.
When all three conditions are met, a SELL signal is generated, and a visual alert is displayed on the chart.
🎨 Customization Options:
The Agent Nafri Alerts indicator is highly customizable to suit your trading style:
Adjust the EMA periods (9 and 21) to fit your preferred trend-following strategy.
Modify the RSI thresholds (55 for buys, 45 for sells) to fine-tune momentum filtering.
Customize the Stochastic levels (25 for buys, 75 for sells) to align with your risk tolerance.
Change the colors and styles of the signals and EMA lines for better visual clarity.
🔔 Alerts and Notifications:
The indicator includes built-in TradingView alerts that can be configured to notify you via:
Pop-up notifications on your desktop or mobile device.
Email alerts for long-term traders.
Sound alerts to ensure you never miss a signal.
📊 Why Choose Agent Nafri Alerts?
High Accuracy: By combining multiple technical indicators, the Agent Nafri Alerts system ensures that only high-probability signals are generated.
Reduced False Signals: The RSI and Stochastic filters eliminate weak or unreliable signals, saving you from unnecessary losses.
User-Friendly: Designed with simplicity in mind, the indicator is easy to understand and use, even for beginners.
Versatile: Suitable for all trading styles, including scalping, day trading, and swing trading.
🌟 Start Using Agent Nafri Alerts Today!
Enhance your trading strategy with the Agent Nafri Alerts indicator and take your trading to the next level. Whether you're a beginner or an experienced trader, this powerful tool will help you identify high-probability trading opportunities with confidence.
Happy Trading! 🚀

Market Trend Scanner [Afnan]This Market Strength Scanner indicator is designed to provide traders with a clear and concise overview of market trends using a single table. It helps you quickly determine which sectors and indices are strong, weak, or choppy, allowing you to make informed trading decisions with ease.
How This Indicator Helps You:
✅ Identify Strong Sectors & Indices
🔹By analyzing this table, you can instantly see which sectors and indices are performing well.
🔹Focus on stocks within strong sectors to find high-probability buying opportunities.
✅ Avoid Weak or Choppy Markets
🔹The indicator highlights bearish or consolidating sectors, helping you avoid poor trading conditions.
🔹Stay away from sectors that are weak or moving sideways to reduce unnecessary risks.
✅ Understand Market Sentiment in Seconds
🔹If most sectors are bullish, the market is in an uptrend—giving you confidence to take long positions.
🔹If the majority are bearish, the market is weak, signaling caution.
🔹A mix of bullish and bearish sectors indicates a choppy market, warning you to avoid trading or adjust your strategy.
✅ Powered by 4 Customizable EMAs
🔹The indicator uses 4 Exponential Moving Averages (EMAs) to determine trends for each sector and index.
🔹These EMAs are fully modifiable, allowing you to adjust them based on your preferred strategy.
✅ Covers 25 Major Indices (Fully Customizable)
🔹By default, the indicator tracks 25 key indices, giving you a broad market perspective.
🔹You can customize the list to focus on the indices that matter most to you.
Why Use This Indicator?
🔹 Saves Time – No need to analyze multiple charts manually. The table gives you everything at a glance.
🔹 Improves Trade Selection – Focus only on strong sectors for better trade accuracy.
🔹 Works in All Market Conditions – Whether the market is trending or consolidating, this tool keeps you informed.
🔹 Fully Customizable – Adjust the EMAs and indices according to your trading preferences.
With just this one powerful indicator, you get a complete market overview, helping you align your trades with the current trend effortlessly! 🚀

Stock Sector ETF with IndicatorsThe Stock Sector ETF with Indicators is a versatile tool designed to track the performance of sector-specific ETFs relative to the current asset. It automatically identifies the sector of the underlying symbol and displays the corresponding ETF’s price action alongside key technical indicators. This helps traders analyze sector trends and correlations in real time.
---
Key Features
Automatic Sector Detection:
Fetches the sector of the current asset (e.g., "Technology" for AAPL).
Maps the sector to a user-defined ETF (default: SPDR sector ETFs) .
Technical Indicators:
Simple Moving Average (SMA): Tracks the ETF’s trend.
Bollinger Bands: Highlights volatility and potential reversals.
Donchian High (52-Week High): Identifies long-term resistance levels.
Customizable Inputs:
Adjust indicator parameters (length, visibility).
Override default ETFs for specific sectors.
Informative Table:
Displays the current sector and ETF symbol in the bottom-right corner.
---
Input Settings
SMA Settings
SMA Length: Period for calculating the Simple Moving Average (default: 200).
Show SMA: Toggle visibility of the SMA line.
Bollinger Bands Settings
BB Length: Period for Bollinger Bands calculation (default: 20).
BB Multiplier: Standard deviation multiplier (default: 2.0).
Show Bollinger Bands: Toggle visibility of the bands.
Donchian High (52-Week High)
Daily High Length: Days used to calculate the high (default: 252, approx. 1 year).
Show High: Toggle visibility of the 52-week high line.
Sector Selections
Customize ETFs for each sector (e.g., replace XLU with another utilities ETF).
---
Example Use Cases
Trend Analysis: Compare a stock’s price action to its sector ETF’s SMA for trend confirmation.
Volatility Signals: Use Bollinger Bands to spot ETF price squeezes or breakouts.
Sector Strength: Monitor if the ETF is approaching its 52-week high to gauge sector momentum.
Enjoy tracking sector trends with ease! 🚀

RSI Bullish Divergence ScannerRSI Bullish Divergence
When there is bullish divergence in chart and RSI then the indicator will give alert in green

Mark Lowest Low with 2-Candle Cooldown - Saurabh PantMark Lowest Low with 2-Candle Cooldown - Check on every weekend and if you see an arrow mark, punch the orders on Monday
Good for long term investments, avoids the averaging


Mark Lowest Low with 2-Candle CooldownFor long term investment purpose.
Check every weekend and if you see an arrow, punch the order on Monday

Pearson Correlation CoefficientDescription: The Pearson Correlation Coefficient measures the strength and direction of the linear relationship between two data series. Its value ranges from -1 to +1, where:
+1 indicates a perfect positive linear correlation: as one asset increases, the other asset increases proportionally.
0 indicates no linear correlation: variations in one asset have no relation to variations in the other asset.
-1 indicates a perfect negative linear correlation: as one asset increases, the other asset decreases proportionally.
This measure is widely used in technical analysis to assess the degree of correlation between two financial assets. The "Pearson Correlation (Manual Compare)" indicator allows users to manually select two assets and visually display their correlation relationship on a chart.
Features:
Correlation Period: The time period used for calculating the correlation can be adjusted (default: 50).
Comparison Asset: Users can select a secondary asset for comparison.
Visual Plots: The chart includes reference lines for perfect correlations (+1 and -1) and strong correlations (+0.7 and -0.7).
Alerts: Set alerts for when the correlation exceeds certain threshold values (e.g., +0.7 for strong positive correlation).
How to Select the Second Asset:
Primary Asset Selection: The primary asset is the one you select for viewing on the chart. This can be done by simply opening the chart for the desired asset.
Secondary Asset Selection: To select the secondary asset for comparison, use the input field labeled "Comparison Asset" in the script settings. You can manually enter the ticker symbol of the secondary asset you want to compare with the primary asset.
This indicator is ideal for traders looking to identify relationships and correlations between different financial assets to make informed trading decisions.

Flat Candle IdentifierCredit "https://www.tradingview.com/script/qE9ma259-Flat-Open-sniper/"
Updated the indicator to allow the user to change the color of the candle.
This allows the user to spot flat candles easier than by using icons.

Volume Pressure TrackerThis is just like the top 6 trend indictor (NASDAQ 100 Top 6 Trend Indicator) but instead of calculating price action this indicator averages the volume of your ticker symbols. You can also just use 1 ticker symbol. If you're trading an Index fund like NASDAQ or RUSSELL you should use all 6 ticker inputs. If you are trading BTCUSDT for example just use that one ticker input.
Not sure how well this works.
Let me know in the comments
Lemon Squeazy out!!!

Percentage Retracement from ATH█ OVERVIEW
The Percentage Retracement from ATH indicator is a dynamic trading utility designed to help traders gauge market pullbacks from the peak price. By calculating key retracement levels based on the All-Time High (ATH) and user‑defined percentage inputs, it offers clear visual cues to assist in identifying potential support and resistance zones.
█ KEY FEATURES
Custom Date — Use a custom start date so the indicator only considers specified price action.
Retracement Calculation — Determines ATH and calculates levels based on user‑defined percentages (0% to –100%).
Visual Customisation — Plots configurable horizontal lines and labels showing retracement percentages and prices.
Time Filtering — Uses time filtering to base levels on the desired data period.
█ PURPOSE
Assist traders in visualising the depth of price retracements from recent or historical peaks.
Identify critical zones where the market may find support or resistance after reaching an ATH.
Facilitate more informed entry and exit decisions by clearly demarcating retracement levels on the chart.
█ IDEAL USERS
Swing Traders — Looking to exploit pullbacks following strong upward moves.
Technical Analysts — Interested in pinpointing key retracement levels as potential reversal or continuation points.
Price Action Traders — Focused on the nuances of market peaks and subsequent corrections.
Strategy Developers — Keen to backtest and refine approaches centred on retracement dynamics.

NASDAQ 100 Top 6 Average TrendTakes the average of the top 6 Nasdaq 100, AAPL, MSFT, GOOGL, AMZN, NVDA, META.. If the average is moving down the red indicator will show its a downward sellers market. If the average is moving up is an upward buyers market. Use the higher moving average to work with smaller time frames.

Intraday ORB Breakout IndicatorThis is an intraday indicator works in a 15-minute timeframe.
Timeframe - 15 min
IB Range - 1-hour range after the market opens in India (i.e. 9.15 to 10.15 AM range)
If the price shows a breakout of IB High or a breakdown of IB low and the breakout/breakdown candle has less than 20% of the wick (selling wick in breakout and buying wick in breakdown) in a 15-minute chart, then it will set a flag or alert mechanism on the chart with 'Long' or 'Short' terms. It also marks the IB range (9.15 to 10.15 AM range) with two simple lines.
Traders should wait for the break of the high of the breakout candle or the low of the breakdown candle to take their trades. Besides, one should follow proper risk management rules when making trades.
// Disclaimer: This indicator is for educational purposes only.
// I am not responsible for any financial losses incurred from its use.

Intraday ORB Breakout IndicatorThis is only applicable to intraday trading in 15 minutes timeframe.
It highlights the 1-hour range in Indian markets i.e. 9.15 AM to 10.15 AM.
If the price shows a breakout of a 1-hour High or a breakdown of a 1-hour low and the breakout/breakdown candle has less than 20% of the wick (selling wick in breakout and buying wick in breakdown) in the 15-minute chart, then it will set an alert 'Long' or 'Short' on the chart.
However, to take a trade, one must wait for the break of the high of the breakout candle for a long trade or a break of the low of the breakdown candle for a short trade. Besides, one should follow proper risk management rules to manage their trades.

Percent Change HistogramThis indicator shows you percent changes in a super visual way using a color-coded histogram.
Here's how the colors work:
🟩 Dark green = percent change is growing stronger
🟢 Light green = still positive but losing steam
🟥 Dark red = getting more negative
🔴 Light red = negative but improving
The cool part? You can set any lookback period you want. For example:
24 periods on 1H chart = last 24 hours
30 periods on daily = last month
7 periods on daily = last week
Pro tip: You're not locked to your chart's timeframe! Want to see monthly changes while trading on 5min?
No problem.
You can even stack multiple indicators to watch different intervals simultaneously (daily, weekly, monthly) - super helpful for multi-timeframe analysis.
Perfect for spotting momentum shifts across different timeframes without switching between charts.

VIX Differential(Melon)Simple indy that measures the difference between VIX9D and VIX to try assessing short-term market sentiment. I've liked this recently as a big clue for market bottom reversals.

Auto-Adjusting Kalman Filter by TenozenNew year, new indicator! Auto-Adjusting Kalman Filter is an indicator designed to provide an adaptive approach to trend analysis. Using the Kalman Filter (a recursive algorithm used in signal processing), this algo dynamically adjusts to market conditions, offering traders a reliable way to identify trends and manage risk! In other words, it's a remaster of my previous indicator, Kalman Filter by Tenozen.
What's the difference with the previous indicator (Kalman Filter by Tenozen)?
The indicator adjusts its parameters (Q and R) in real-time using the Average True Range (ATR) as a measure of market volatility. This ensures the filter remains responsive during high-volatility periods and smooth during low-volatility conditions, optimizing its performance across different market environments.
The filter resets on a user-defined timeframe, aligning its calculations with dominant trends and reducing sensitivity to short-term noise. This helps maintain consistency with the broader market structure.
A confidence metric, derived from the deviation of price from the Kalman filter line (measured in ATR multiples), is visualized as a heatmap:
Green : Bullish confidence (higher values indicate stronger trends).
Red : Bearish confidence (higher values indicate stronger trends).
Gray : Neutral zone (low confidence, suggesting caution).
This provides a clear, objective measure of trend strength.
How it works?
The Kalman Filter estimates the "true" price by filtering out market noise. It operates in two steps, that is, prediction and update. Prediction is about projection the current state (price) forward. Update is about adjusting the prediction based on the latest price data. The filter's parameters (Q and R) are scaled using normalized ATR, ensuring adaptibility to changing market conditions. So it means that, Q (Process Noise) increases during high volatility, making the filter more responsive to price changes and R (Measurement Noise) increases during low volatility, smoothing out the filter to avoid overreacting to minor fluctuations. Also, the trend confidence is calculated based on the deviation of price from the Kalman filter line, measured in ATR multiples, this provides a quantifiable measure of trend strength, helping traders assess market conditions objectively.
How to use?
Use the Kalman Filter line to identify the prevailing trend direction. Trade in alignment with the filter's slope for higher-probability setups.
Look for pullbacks toward the Kalman Filter line during strong trends (high confidence zones)
Utilize the dynamic stop-loss and take-profit levels to manage risk and lock in profits
Confidence Heatmap provides an objective measure of market sentiment, helping traders avoid low-confidence (neutral) zones and focus on high-probability opportunities
Guess that's it! I hope this indicator helps! Let me know if you guys got some feedback! Ciao!

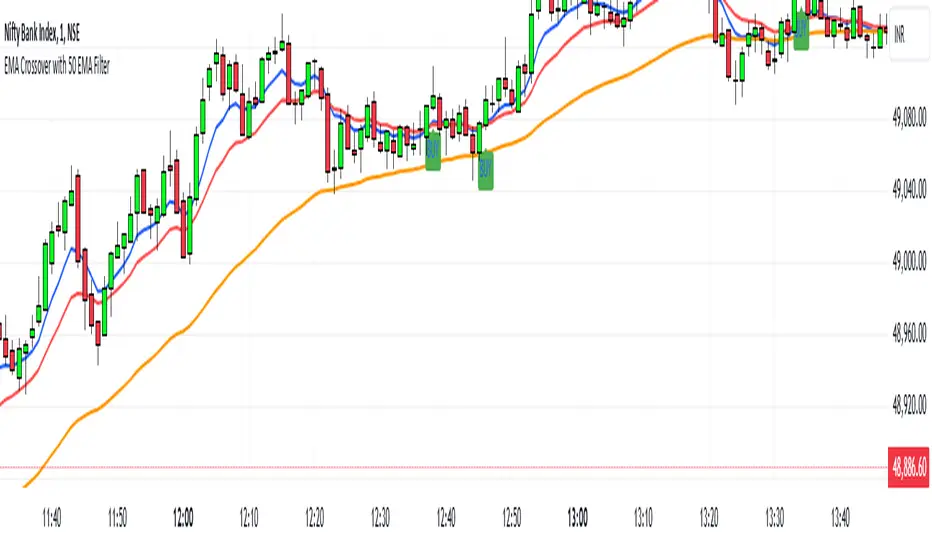
EMA Crossover with 50 EMA Filter50-period EMA: We added the 50-period EMA as the filterEMA variable.
Buy and Sell Conditions: The buy signal is generated only if the 8-period and 16-period EMAs both cross above each other and are above the 50-period EMA. Similarly, the sell signal is generated when the 8-period and 16-period EMAs cross below each other and are below the 50-period EMA.
Plotting: The 50-period EMA is also plotted on the chart (in orange).
This strategy will ensure that the buy signals are only triggered when the trend is considered "bullish" (both EMAs above the 50 EMA) and sell signals when the trend is "bearish" (both EMAs below the 50 EMA).
You can set up alerts for both buy and sell conditions using the alertcondition() function.
Let me know if you need further adjustments!
NOTE :- Applicable only for banknifty
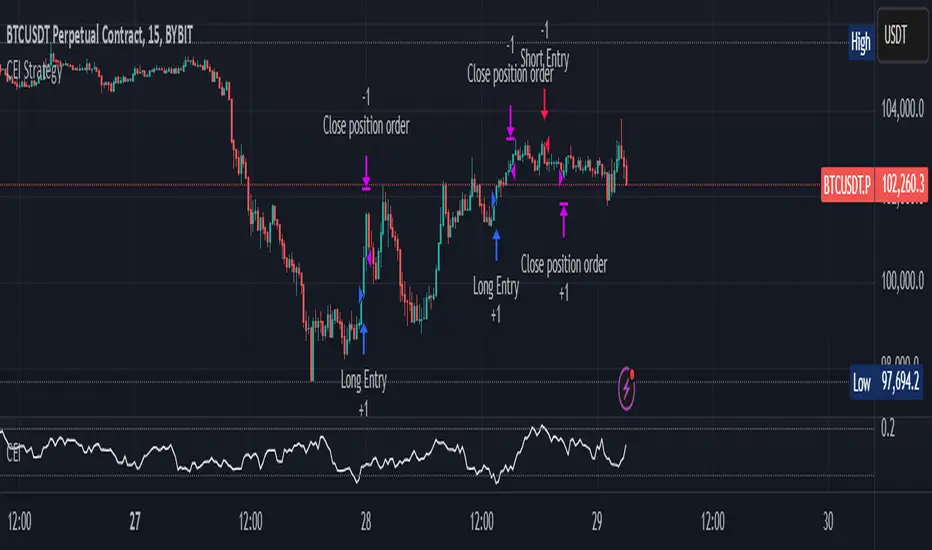
Candle Emotion Index (CEI) StrategyThe Candle Emotion Index (CEI) Strategy is an innovative sentiment-based trading approach designed to help traders identify and capitalize on market psychology. By analyzing candlestick patterns and combining them into a unified metric, the CEI Strategy provides clear entry and exit signals while dynamically managing risk. This strategy is ideal for traders looking to leverage market sentiment to identify high-probability trading opportunities.
How It Works
The CEI Strategy is built around three core oscillators that reflect key emotional states in the market:
Indecision Oscillator . Measures market uncertainty using patterns like Doji and Spinning Tops. High values indicate hesitation, signaling potential turning points.
Fear Oscillator . Tracks bearish sentiment through patterns like Shooting Star, Hanging Man, and Bearish Engulfing. Helps identify moments of intense selling pressure.
Greed Oscillator . Detects bullish sentiment using patterns like Marubozu, Hammer, Bullish Engulfing, and Three White Soldiers. Highlights periods of strong buying interest.
These oscillators are averaged into the Candle Emotion Index (CEI):
CEI = (Indecision + Fear + Greed) / 3
This single value quantifies overall market sentiment and drives the strategy’s trading decisions.
Key Features
Sentiment-Based Trading Signals . Long Entry: Triggered when the CEI crosses above a lower threshold (e.g., 0.1), indicating increasing bullish sentiment. Short Entry: Triggered when the CEI crosses above a higher threshold (e.g., 0.2), signaling rising bearish sentiment.
Volume Confirmation . Trades are validated only if volume exceeds a user-defined multiplier of the average volume over the lookback period. This ensures entries are backed by significant market activity.
Break-Even Recovery Mechanism . If a trade moves into a loss, the strategy attempts to recover to break-even instead of immediately exiting at a loss. This feature provides flexibility, allowing the market to recover while maintaining disciplined risk management.
Dynamic Risk Management . Maximum Holding Period: Trades are closed after a user-defined number of candles to avoid overexposure to prolonged uncertainty. Profit-Taking Conditions: Positions are exited when favorable price moves are confirmed by increased volume, locking in gains. Loss Threshold: Trades are exited early if the price moves unfavorably beyond a set percentage of the entry price, limiting potential losses.
Cooldown Period . After a trade is closed, a cooldown period prevents immediate re-entry, reducing overtrading and improving signal quality.
Why Use This Strategy?
The CEI Strategy combines advanced sentiment analysis with robust trade management, making it a powerful tool for traders seeking to understand market psychology and identify high-probability setups. Its unique features, such as the break-even recovery mechanism and volume confirmation, add an extra layer of discipline and reliability to trading decisions.
Best Practices
Combine with Other Indicators . Use trend-following tools (e.g., moving averages, ADX) and momentum oscillators (e.g., RSI, MACD) to confirm signals.
Align with Key Levels . Incorporate support and resistance levels for refined entries and exits.
Multi-Market Compatibility . Apply this strategy to forex, crypto, stocks, or any asset class with strong volume and price action.
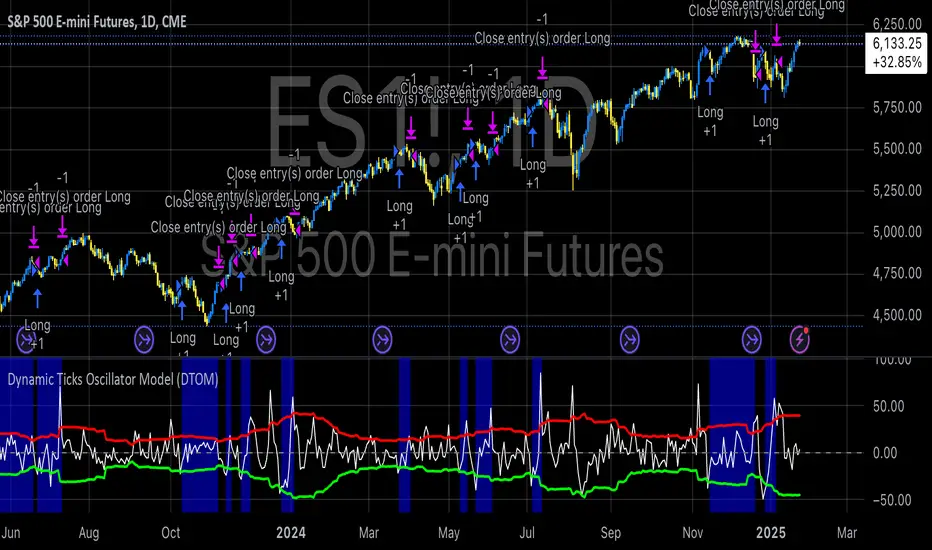
Dynamic Ticks Oscillator Model (DTOM)The Dynamic Ticks Oscillator Model (DTOM) is a systematic trading approach grounded in momentum and volatility analysis, designed to exploit behavioral inefficiencies in the equity markets. It focuses on the NYSE Down Ticks, a metric reflecting the cumulative number of stocks trading at a lower price than their previous trade. As a proxy for market sentiment and selling pressure, this indicator is particularly useful in identifying shifts in investor behavior during periods of heightened uncertainty or volatility (Jegadeesh & Titman, 1993).
Theoretical Basis
The DTOM builds on established principles of momentum and mean reversion in financial markets. Momentum strategies, which seek to capitalize on the persistence of price trends, have been shown to deliver significant returns in various asset classes (Carhart, 1997). However, these strategies are also susceptible to periods of drawdown due to sudden reversals. By incorporating volatility as a dynamic component, DTOM adapts to changing market conditions, addressing one of the primary challenges of traditional momentum models (Barroso & Santa-Clara, 2015).
Sentiment and Volatility as Core Drivers
The NYSE Down Ticks serve as a proxy for short-term negative sentiment. Sudden increases in Down Ticks often signal panic-driven selling, creating potential opportunities for mean reversion. Behavioral finance studies suggest that investor overreaction to negative news can lead to temporary mispricings, which systematic strategies can exploit (De Bondt & Thaler, 1985). By incorporating a rate-of-change (ROC) oscillator into the model, DTOM tracks the momentum of Down Ticks over a specified lookback period, identifying periods of extreme sentiment.
In addition, the strategy dynamically adjusts entry and exit thresholds based on recent volatility. Research indicates that incorporating volatility into momentum strategies can enhance risk-adjusted returns by improving adaptability to market conditions (Moskowitz, Ooi, & Pedersen, 2012). DTOM uses standard deviations of the ROC as a measure of volatility, allowing thresholds to contract during calm markets and expand during turbulent ones. This approach helps mitigate false signals and aligns with findings that volatility scaling can improve strategy robustness (Barroso & Santa-Clara, 2015).
Practical Implications
The DTOM framework is particularly well-suited for systematic traders seeking to exploit behavioral inefficiencies while maintaining adaptability to varying market environments. By leveraging sentiment metrics such as the NYSE Down Ticks and combining them with a volatility-adjusted momentum oscillator, the strategy addresses key limitations of traditional trend-following models, such as their lagging nature and susceptibility to reversals in volatile conditions.
References
• Barroso, P., & Santa-Clara, P. (2015). Momentum Has Its Moments. Journal of Financial Economics, 116(1), 111–120.
• Carhart, M. M. (1997). On Persistence in Mutual Fund Performance. The Journal of Finance, 52(1), 57–82.
• De Bondt, W. F., & Thaler, R. (1985). Does the Stock Market Overreact? The Journal of Finance, 40(3), 793–805.
• Jegadeesh, N., & Titman, S. (1993). Returns to Buying Winners and Selling Losers: Implications for Stock Market Efficiency. The Journal of Finance, 48(1), 65–91.
• Moskowitz, T. J., Ooi, Y. H., & Pedersen, L. H. (2012). Time Series Momentum. Journal of Financial Economics, 104(2), 228–250.
Global Relevant Events MarkerThe Global Relevant Events Marker script is designed to mark significant global events on a chart, such as economic crises or major geopolitical events. It uses vertical lines to indicate the exact dates of these events and places labels (optional) near the lines to provide a description of the event.

Trend with ADX/EMA - Buy & Sell SignalsThis script is designed to help traders make buy and sell decisions based on trend analysis using two key methods: ADX (Average Directional Index) and EMA (Exponential Moving Averages). Here's a breakdown in simple terms:
What Does It Do?
Identifies the Trend's Strength and Direction:
Uses the ADX indicator to determine how strong the trend is.
Compares two lines (DI+ and DI−) to identify whether the trend is moving up or down.
Generates Buy and Sell Signals:
Uses two EMAs (a fast one and a slow one) to check when the price crosses key levels, signaling a possible buy or sell opportunity.
Plots visual indicators (arrows and labels) for easy interpretation.
Color-Codes the Chart:
Highlights the background in green when the trend is bullish (uptrend).
Highlights the background in red when the trend is bearish (downtrend).
Alerts the User:
Creates alerts when specific conditions for buying or selling are met.
Key Components:
1. ADX (Trend Strength & Direction)
What is ADX?
ADX measures how strong the trend is (not the direction). Higher ADX means a stronger trend.
It also calculates two lines:
DI+: Measures upward movement strength.
DI−: Measures downward movement strength.
How It Works in the Script:
If DI+ is greater than DI−, it’s a bullish trend (upward).
If DI− is greater than DI+, it’s a bearish trend (downward).
The background turns green for an uptrend and red for a downtrend.
2. EMA (Buy and Sell Decisions)
What is EMA?
EMA is a moving average that gives more weight to recent prices. It’s used to smooth out price fluctuations.
How It Works in the Script:
The script calculates two EMAs:
Fast EMA (short-term average): Reacts quickly to price changes.
Slow EMA (long-term average): Reacts slower and shows overall trends.
When the Fast EMA crosses above the Slow EMA, it’s a signal to Buy.
When the Fast EMA crosses below the Slow EMA, it’s a signal to Sell.
These signals are marked on the chart as "Buy" and "Sell" labels.
3. Buy and Sell Alerts
The script sets up alerts for the user:
Buy Alert: When a crossover indicates a bullish signal.
Sell Alert: When a crossunder indicates a bearish signal.
Visual Elements on the Chart:
Background Colors:
Green: When the DI+ line indicates an uptrend.
Red: When the DI− line indicates a downtrend.
EMA Lines:
Green Line: Fast EMA.
Red Line: Slow EMA.
Buy/Sell Labels:
"Buy" label: Shown when the Fast EMA crosses above the Slow EMA.
"Sell" label: Shown when the Fast EMA crosses below the Slow EMA.
Why Use This Script?
Trend Analysis: Helps you quickly identify the strength and direction of the market trend.
Buy/Sell Signals: Gives clear signals to enter or exit trades based on trend and EMA crossovers.
Custom Alerts: Ensures you never miss a trading opportunity by notifying you when conditions are met.
Visual Simplicity: Makes it easy to interpret trading signals with color-coded backgrounds and labeled arrows.