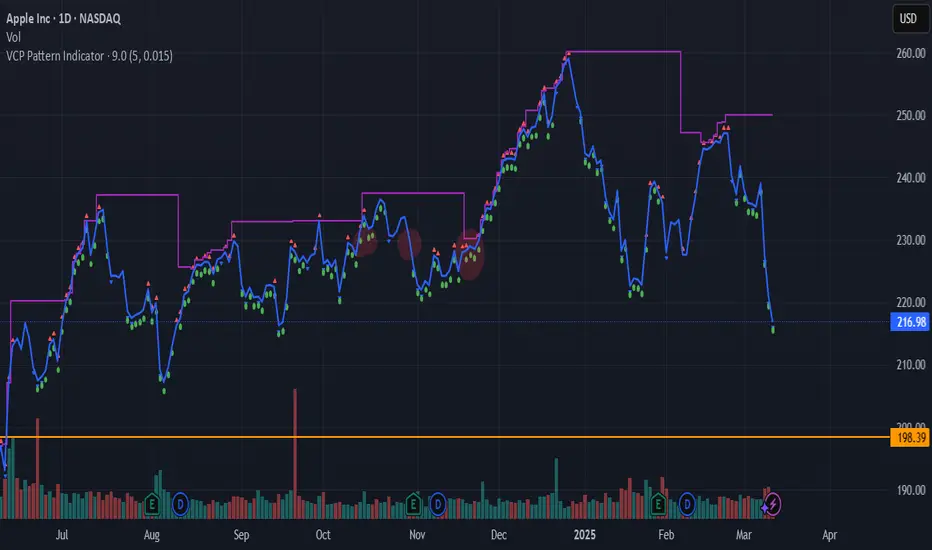
VCP Pattern IndicatorThe Volatility Contraction Pattern (VCP) Indicator is designed to identify tight price consolidations before a potential breakout. This pattern, made famous by Mark Minervini, occurs when price volatility contracts over time, forming higher lows while resistance remains relatively stable.
This indicator automatically detects peaks & troughs, checks for volatility contraction, and highlights potential breakout levels, making it a valuable tool for traders looking for explosive moves after consolidation.
Statistics
Multi-Timeframe ATR MonitorShows multiple time frame ATR's. Specifically the 1,3,5,15,60 and daily ATR's of the security you are looking at. Works best on indexes and stocks or anything that trades out 2 decimals.

ATR Percentages BoxThis custom indicator provides a quick visual reference for volatility-based price ranges, directly on your TradingView charts. It calculates and displays three ranges derived from the Daily Average True Range (ATR) with a standard 14-period setting:
5 Min (3% ATR): Ideal for very short-term scalping and quick intraday moves.
1 Hour (5% ATR): Useful for hourly setups, short-term trades, and intraday volatility assessment.
Day (10% ATR): Perfect for daily volatility context, swing trades, or placing stops and targets.
The ranges are clearly shown in a compact box at the top-right corner, providing traders immediate insights into realistic price movements, helping to optimise entries, stops, and profit targets efficiently.

Vortex Candle MarkerVortex Candle Marker
The Vortex Candle Marker is a specialized TradingView indicator designed to identify and highlight **Vortex Candles**—candles that momentarily form without wicks on either the high or low. This unique price behavior can signal potential price retracements or reversals, aligning with the **Power of Three (PO3)** concept in price action theory.
Indicator Logic:
A candle is classified as a **Vortex Candle** if either of these conditions is met during its formation:
1. **Vortex Top:** The **high** equals either the **open** or **close**, indicating no upper wick.
2. **Vortex Bottom:** The **low** equals either the **open** or **close**, indicating no lower wick.
When a Vortex Candle is detected, the indicator changes the **candle border color** to **aqua**, making it easy to identify these significant price moments.
Market Insight & PO3 Interpretation:
In typical price behavior, most candles exhibit both upper and lower wicks, representing price exploration before settling at a closing value. A candle forming without a wick suggests **strong directional intent** at that moment. However, by the **Power of Three (PO3)** concept—Accumulation, Manipulation, and Distribution—such wickless formations often imply:
- **Price Reversion Likelihood:** When a candle temporarily forms without a wick, it suggests the market may **revisit the opening price** to establish a wick before the candle closes.
- **Liquidity Manipulation:** The absence of a wick may indicate a **stop-hunt** or liquidity grab, where the price manipulates one side before reversing.
- **Entry Triggers:** Identifying these moments can help traders anticipate potential **retracements** or **continuations** within the PO3 framework.
Practical Application
- **Early Reversal Detection:** Spot potential price reversals by observing wickless candles forming at key levels.
- **Breakout Validation:** Use Vortex Candles to confirm **true breakouts** or **false moves** before the price returns.
- **Liquidity Zones:** Identify areas where the market is likely to revisit to create a wick, signaling entry/exit points.
This indicator is a powerful tool for traders applying **Po3** methodologies and seeking to capture price manipulation patterns.
ATR Stop BufferThis plots out the daily ATR in ticks along with 2% of the Daily ATR & 10% rounded up in ticks to help you place your stop loss outside of your zone.

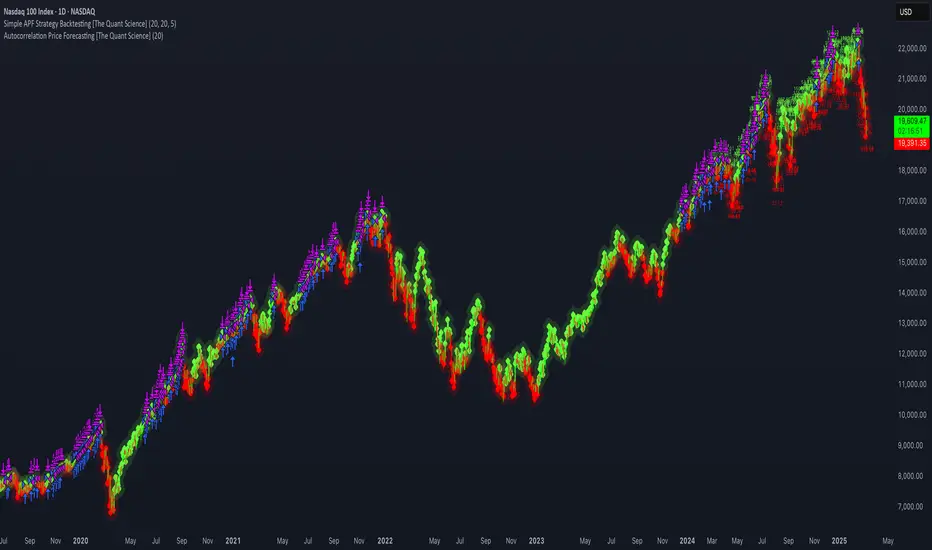
Simple APF Strategy Backtesting [The Quant Science]Simple backtesting strategy for the quantitative indicator Autocorrelation Price Forecasting. This is a Buy & Sell strategy that operates exclusively with long orders. It opens long positions and generates profit based on the future price forecast provided by the indicator. It's particularly suitable for trend-following trading strategies or directional markets with an established trend.
Main functions
1. Cycle Detection: Utilize autocorrelation to identify repetitive market behaviors and cycles.
2. Forecasting for Backtesting: Simulate trades and assess the profitability of various strategies based on future price predictions.
Logic
The strategy works as follow:
Entry Condition: Go long if the hypothetical gain exceeds the threshold gain (configurable by user interface).
Position Management: Sets a take-profit level based on the future price.
Position Sizing: Automatically calculates the order size as a percentage of the equity.
No Stop-Loss: this strategy doesn't includes any stop loss.
Example Use Case
A trader analyzes a dayli period using 7 historical bars for autocorrelation.
Sets a threshold gain of 20 points using a 5% of the equity for each trade.
Evaluates the effectiveness of a long-only strategy in this period to assess its profitability and risk-adjusted performance.
User Interface
Length: Set the length of the data used in the autocorrelation price forecasting model.
Thresold Gain: Minimum value to be considered for opening trades based on future price forecast.
Order Size: percentage size of the equity used for each single trade.
Strategy Limit
This strategy does not use a stop loss. If the price continues to drop and the future price forecast is incorrect, the trader may incur a loss or have their capital locked in the losing trade.
Disclaimer!
This is a simple template. Use the code as a starting point rather than a finished solution. The script does not include important parameters, so use it solely for educational purposes or as a boilerplate.
Yearly Performance TableThis indicator shows the yearly performance of any financial instrument for the current year and the previous five years. It also displays the combined performance for the past 3 and 5 years.

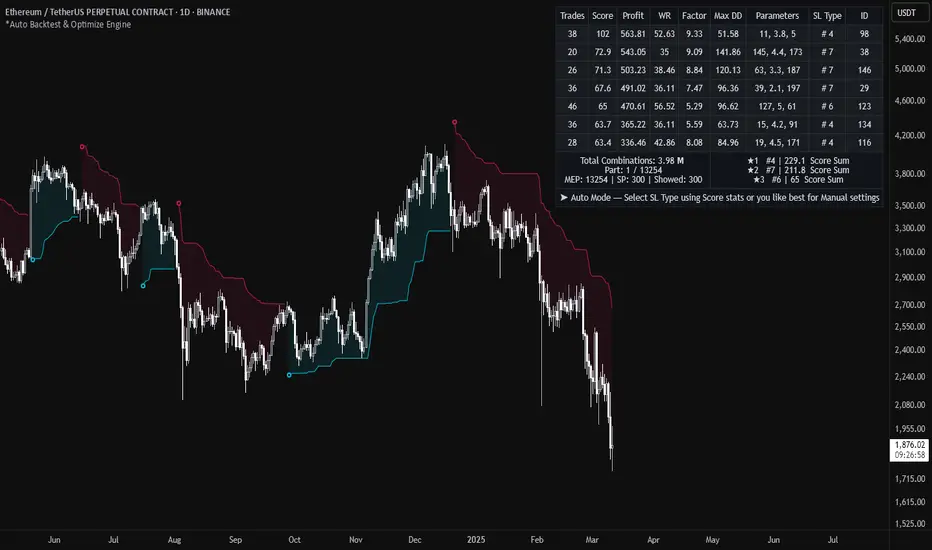
*Auto Backtest & Optimize EngineFull-featured Engine for Automatic Backtesting and parameter optimization. Allows you to test millions of different combinations of stop-loss and take profit parameters, including on any connected indicators.
⭕️ Key Futures
Quickly identify the optimal parameters for your strategy.
Automatically generate and test thousands of parameter combinations.
A simple Genetic Algorithm for result selection.
Saves time on manual testing of multiple parameters.
Detailed analysis, sorting, filtering and statistics of results.
Detailed control panel with many tooltips.
Display of key metrics: Profit, Win Rate, etc..
Comprehensive Strategy Score calculation.
In-depth analysis of the performance of different types of stop-losses.
Possibility to use to calculate the best Stop-Take parameters for your position.
Ability to test your own functions and signals.
Customizable visualization of results.
Flexible Stop-Loss Settings:
• Auto ━ Allows you to test all types of Stop Losses at once(listed below).
• S.VOLATY ━ Static stop based on volatility (Fixed, ATR, STDEV).
• Trailing ━ Classic trailing stop following the price.
• Fast Trail ━ Accelerated trailing stop that reacts faster to price movements.
• Volatility ━ Dynamic stop based on volatility indicators.
• Chandelier ━ Stop based on price extremes.
• Activator ━ Dynamic stop based on SAR.
• MA ━ Stop based on moving averages (9 different types).
• SAR ━ Parabolic SAR (Stop and Reverse).
Advanced Take-Profit Options:
• R:R: Risk/Reward ━ sets TP based on SL size.
• T.VOLATY ━ Calculation based on volatility indicators (Fixed, ATR, STDEV).
Testing Modes:
• Stops ━ Cyclical stop-loss testing
• Pivot Point Example ━ Example of using pivot points
• External Example ━ Built-in example how test functions with different parameters
• External Signal ━ Using external signals
⭕️ Usage
━ First Steps:
When opening, select any point on the chart. It will not affect anything until you turn on Manual Start mode (more on this below).
The chart will immediately show the best results of the default Auto mode. You can switch Part's to try to find even better results in the table.
Now you can display any result from the table on the chart by entering its ID in the settings.
Repeat steps 3-4 until you determine which type of Stop Loss you like best. Then set it in the settings instead of Auto mode.
* Example: I flipped through 14 parts before I liked the first result and entered its ID so I could visually evaluate it on the chart.
Then select the stop loss type, choose it in place of Auto mode and repeat steps 3-4 or immediately follow the recommendations of the algorithm.
Now the Genetic Algorithm at the bottom right will prompt you to enter the Parameters you need to search for and select even better results.
Parameters must be entered All at once before they are updated. Enter recommendations strictly in fields with the same names.
Repeat steps 5-6 until there are approximately 10 Part's left or as you like. And after that, easily pour through the remaining Parts and select the best parameters.
━ Example of the finished result.
━ Example of use with Takes
You can also test at the same time along with Take Profit. In this example, I simply enabled Risk/Reward mode and immediately specified in the TP field Maximum RR, Minimum RR and Step. So in this example I can test (3-1) / 0.1 = 20 Takes of different sizes. There are additional tips in the settings.
━
* Soon you will start to understand how the system works and things will become much easier.
* If something doesn't work, just reset the engine settings and start over again.
* Use the tips I have left in the settings and on the Panel.
━ Details:
Sort ━ Sorting results by Score, Profit, Trades, etc..
Filter ━ Filtring results by Score, Profit, Trades, etc..
Trade Type ━ Ability to disable Long\Short but only from statistics.
BackWin ━ Backtest Window Number of Candle the script can test.
Manual Start ━ Enabling it will allow you to call a Stop from a selected point. which you selected when you started the engine.
* If you have a real open position then this mode can help to save good Stop\Take for it.
1 - 9 Сheckboxs ━ Allow you to disable any stop from Auto mode.
Ex Source - Allow you to test Stops/Takes from connected indicators.
Connection guide:
//@version=6
indicator("My script")
rsi = ta.rsi(close, 14)
buy = not na(rsi) and ta.crossover (rsi, 40) // OS = 40
sell = not na(rsi) and ta.crossunder(rsi, 60) // OB = 60
Signal = buy ? +1 : sell ? -1 : 0
plot(Signal, "🔌Connector🔌", display = display.none)
* Format the signal for your indicator in a similar style and then select it in Ex Source.
⭕️ How it Works
Hypothesis of Uniform Distribution of Rare Elements After Mixing.
'This hypothesis states that if an array of N elements contains K valid elements, then after mixing, these valid elements will be approximately uniformly distributed.'
'This means that in a random sample of k elements, the proportion of valid elements should closely match their proportion in the original array, with some random variation.'
'According to the central limit theorem, repeated sampling will result in an average count of valid elements following a normal distribution.'
'This supports the assumption that the valid elements are evenly spread across the array.'
'To test this hypothesis, we can conduct an experiment:'
'Create an array of 1,000,000 elements.'
'Select 1,000 random elements (1%) for validation.'
'Shuffle the array and divide it into groups of 1,000 elements.'
'If the hypothesis holds, each group should contain, on average, 1~ valid element, with minor variations.'
* I'd like to attach more details to My hypothesis but it won't be very relevant here. Since this is a whole separate topic, I will leave the minimum part for understanding the engine.
Practical Application
To apply this hypothesis, I needed a way to generate and thoroughly mix numerous possible combinations. Within Pine, generating over 100,000 combinations presents significant challenges, and storing millions of combinations requires excessive resources.
I developed an efficient mechanism that generates combinations in random order to address these limitations. While conventional methods often produce duplicates or require generating a complete list first, my approach guarantees that the first 10% of possible combinations are both unique and well-distributed. Based on my hypothesis, this sampling is sufficient to determine optimal testing parameters.
Most generators and randomizers fail to accommodate both my hypothesis and Pine's constraints. My solution utilizes a simple Linear Congruential Generator (LCG) for pseudo-randomization, enhanced with prime numbers to increase entropy during generation. I pre-generate the entire parameter range and then apply systematic mixing. This approach, combined with a hybrid combinatorial array-filling technique with linear distribution, delivers excellent generation quality.
My engine can efficiently generate and verify 300 unique combinations per batch. Based on the above, to determine optimal values, only 10-20 Parts need to be manually scrolled through to find the appropriate value or range, eliminating the need for exhaustive testing of millions of parameter combinations.
For the Score statistic I applied all the same, generated a range of Weights, distributed them randomly for each type of statistic to avoid manual distribution.
Score ━ based on Trade, Profit, WinRate, Profit Factor, Drawdown, Sharpe & Sortino & Omega & Calmar Ratio.
⭕️ Notes
For attentive users, a little tricks :)
To save time, switch parts every 3 seconds without waiting for it to load. After 10-20 parts, stop and wait for loading. If the pause is correct, you can switch between the rest of the parts without loading, as they will be cached. This used to work without having to wait for a pause, but now it does slower. This will save a lot of time if you are going to do a deeper backtest.
Sometimes you'll get the error “The scripts take too long to execute.”
For a quick fix you just need to switch the TF or Ticker back and forth and most likely everything will load.
The error appears because of problems on the side of the site because the engine is very heavy. It can also appear if you set too long a period for testing in BackWin or use a heavy indicator for testing.
Manual Start - Allow you to Start you Result from any point. Which in turn can help you choose a good stop-stick for your real position.
* It took me half a year from idea to current realization. This seems to be one of the few ways to build something automatic in backtest format and in this particular Pine environment. There are already better projects in other languages, and they are created much easier and faster because there are no limitations except for personal PC. If you see solutions to improve this system I would be glad if you share the code. At the moment I am tired and will continue him not soon.
Also You can use my previosly big Backtest project with more manual settings(updated soon)
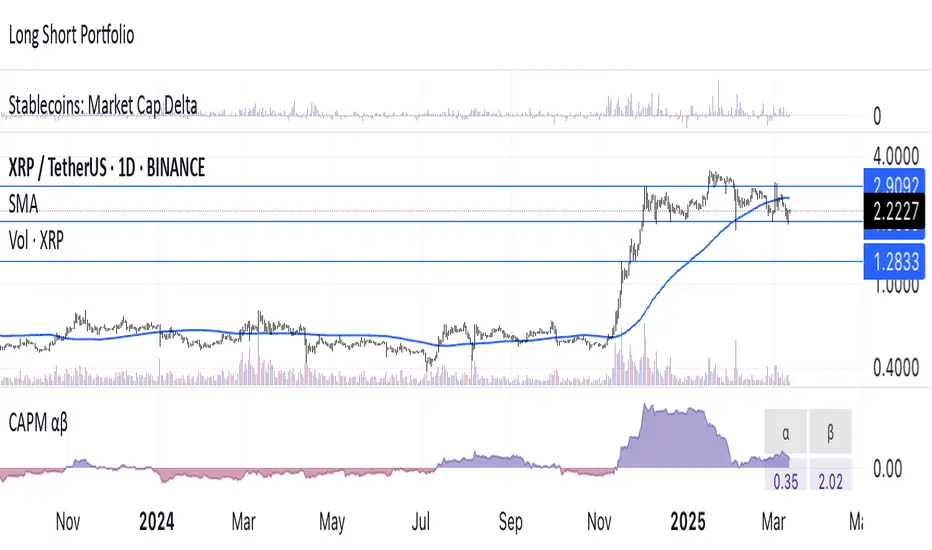
CAPM Alpha & BetaThe CAPM Alpha & Beta indicator is a crucial tool in finance and investment analysis derived from the Capital Asset Pricing Model (CAPM) . It provides insights into an asset's risk-adjusted performance (Alpha) and its relationship to broader market movements (Beta). Here’s a breakdown:
1. How Does It Work?
Alpha:
Definition: Alpha measures the portion of an investment's return that is not explained by market movements, i.e., the excess return over and above what the market is expected to deliver.
Purpose: It represents the value a fund manager or strategy adds (or subtracts) from an investment’s performance, adjusting for market risk.
Calculation:
Alpha is derived from comparing actual returns to expected returns predicted by CAPM:
Alpha = Actual Return − (Risk-Free Rate + β × (Market Return − Risk-Free Rate))
Alpha = Actual Return − (Risk-Free Rate + β × (Market Return − Risk-Free Rate))
Interpretation:
Positive Alpha: The investment outperformed its CAPM prediction (good performance for additional value/risk).
Negative Alpha: The investment underperformed its CAPM prediction.
Beta:
Definition: Beta measures the sensitivity of an asset's returns relative to the overall market's returns. It quantifies systematic risk.
Purpose: Indicates how volatile or correlated an investment is relative to the market benchmark (e.g., S&P 500).
Calculation:
Beta is computed as the ratio of the covariance of the asset and market returns to the variance of the market returns:
β = Covariance (Asset Return, Market Return) / Variance (Market Return)
β = Variance (Market Return) Covariance (Asset Return, Market Return)
Interpretation:
Beta = 1: The asset’s price moves in line with the market.
Beta > 1: The asset is more volatile than the market (higher risk/higher potential reward).
Beta < 1: The asset is less volatile than the market (lower risk/lower reward).
Beta < 0: The asset moves inversely to the market.
2. How to Use It?
Using Alpha:
Portfolio Evaluation: Investors use Alpha to gauge whether a portfolio manager or a strategy has successfully outperformed the market on a risk-adjusted basis.
If Alpha is consistently positive, the portfolio may deliver higher-than-expected returns for the given level of risk.
Stock/Asset Selection: Compare Alpha across multiple securities. Positive Alpha signals that the asset may be a good addition to your portfolio for excess returns.
Adjusting Investment Strategy: If Alpha is negative, reassess the asset's role in the portfolio and refine strategies.
Using Beta:
Risk Management:
A high Beta (e.g., 1.5) indicates higher sensitivity to market movements. Use such assets if you want to take on more risk during bullish market phases or expect higher returns.
A low Beta (e.g., 0.7) indicates stability and is useful in diversifying risk in volatile or bearish markets.
Portfolio Diversification: Combine assets with varying Betas to achieve the desired level of market responsiveness and smooth out portfolio volatility.
Monitoring Systematic Risk: Beta helps identify whether an investment aligns with your risk tolerance. For example, high-Beta stocks may not be suitable for conservative investors.
Practical Application:
Use both Alpha and Beta together:
Assess performance with Alpha (excess returns).
Assess risk exposure with Beta (market sensitivity).
Example: A stock with a Beta of 1.2 and a highly positive Alpha might suggest a solid performer that is slightly more volatile than the market, making it a suitable pick for risk-tolerant, return-maximizing investors.
In conclusion, the CAPM Alpha & Beta indicator gives a comprehensive view of an asset's performance and risk. Alpha enables performance evaluation on a risk-adjusted basis, while Beta reveals the level of market risk. Together, they help investors make informed decisions, build optimal portfolios, and align investments with their risk-return preferences.
Enhanced Trade Calculator**Enhanced Trade Calculator for TradingView**
### Description
The Enhanced Trade Calculator is designed to simplify your trade management by calculating optimal position sizes, stop loss levels, and target prices directly on your TradingView chart. This indicator helps traders control risk efficiently and adhere to proper money management principles.
### Key Features
- **Shares to Buy**: Calculates the number of shares to purchase based on your account size and desired allocation percentage.
- **Stop Loss Price**: Automatically determines the ideal stop loss level based on either a fixed percentage risk or an ATR-based calculation for dynamic volatility management.
- **Target Price (2:1 RRR)**: Suggests a target price to achieve a 2:1 risk-to-reward ratio.
- **Customizable Inputs**: Easily adjust your account size, risk percentage, and allocation percentage to fit your trading strategy.
### How to Use
1. **Configure Your Settings**
- Enter your **Account Size**.
- Set your **Risk %** (e.g., 1% or 2%).
- Define your **Allocation %** (e.g., 10% of your account per trade).
- Choose whether to use **ATR for Stop Loss** for dynamic risk management or a fixed percentage-based stop loss.
3. **Interpreting the Table**
- **Current Price**: Displays the latest price of the selected asset.
- **Shares to Buy**: Shows the calculated number of shares to purchase.
- **Stop Loss Price**: Indicates where your stop loss should be placed to limit potential losses.
- **Target Price**: Suggests a 2:1 risk-to-reward target for taking profit.
### Recommended Usage
- Ideal for swing traders, position traders, and investors who want a clear, calculated approach to trade entry and risk management.
### Notes
- The indicator does not execute trades but is designed to provide precise calculations to assist in your decision-making.
- For optimal results, combine this indicator with your preferred technical analysis strategy.

Drawdown from All-Time High (Histogram)Shows the drawdown in percentage terms from the all time high using the intraday low

Volume Profilei added color choosing function for Volume Profile indicator, the code is based on kv4coins.
You can choose the color for different region of the volume distribution for better visualization!!

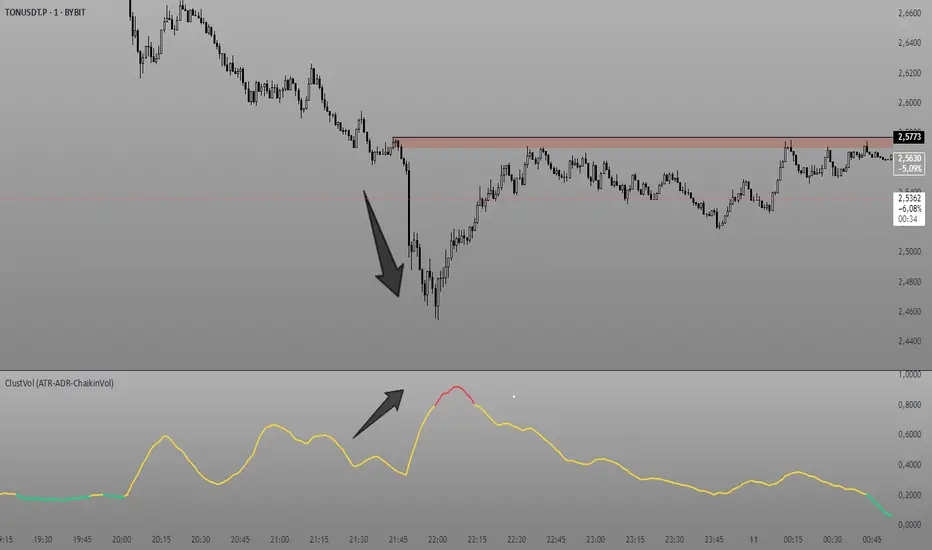
Clustering Volatility (ATR-ADR-ChaikinVol) [Sam SDF-Solutions]The Clustering Volatility indicator is designed to evaluate market volatility by combining three widely used measures: Average True Range (ATR), Average Daily Range (ADR), and the Chaikin Oscillator.
Each indicator is normalized using one of the available methods (MinMax, Rank, or Z-score) to create a unified metric called the Score. This Score is further smoothed with an Exponential Moving Average (EMA) to reduce noise and provide a clearer view of market conditions.
Key Features:
Multi-Indicator Integration: Combines ATR, ADR, and the Chaikin Oscillator into a single Score that reflects overall market volatility.
Flexible Normalization: (Supports three normalization methods)
MinMax: Scales values between the observed minimum and maximum.
Rank: Normalizes based on the relative rank within a moving window.
Z-score: Standardizes values using mean and standard deviation.
Dynamic Window Selection: Offers an automatic window selection option based on a specified lookback period, or a fixed window size can be used.
Customizable Weights: Allows the user to assign individual weights to ATR, ADR, and the Chaikin Oscillator. Optionally, weights can be normalized to sum to 1.
Score Smoothing: Applies an EMA to the computed Score to smooth out short-term fluctuations and reduce market noise.
Cluster Visualization: Divides the smoothed Score into a number of clusters, each represented by a distinct color. These colors can be applied to the price bars (if enabled) for an immediate visual indication of the current volatility regime.
How It Works:
Input & Window Setup: Users set parameters for indicator periods, normalization methods, weights, and window size. The indicator can automatically determine the analysis window based on the number of lookback days.
Calculation of Metrics: The indicator computes the ATR, ADR (as the average of bar ranges), and the Chaikin Oscillator (based on the difference between short and long EMAs of the Accumulation/Distribution line).
Normalization & Scoring: Each indicator’s value is normalized and then weighted to form a raw Score. This raw Score is scaled to a range using statistics from the chosen window.
Smoothing & Clustering: The raw Score is smoothed using an EMA. The resulting smoothed Score is then multiplied by the number of clusters to assign a cluster index, which is used to choose a color for visual signals.
Visualization: The smoothed Score is plotted on the chart with a color that changes based on its value (e.g., lime for low, red for high, yellow for intermediate values). Optionally, the price bars are colored according to the assigned cluster.
_____________
This indicator is ideal for traders seeking a quick and clear assessment of market volatility. By integrating multiple volatility measures into one comprehensive Score, it simplifies analysis and aids in making more informed trading decisions.
For more detailed instructions, please refer to the guide here:
AZZAM KHALID 1H Comprehensive Trading StrategyEMA (Exponential Moving Average) for trend detection.
RSI (Relative Strength Index) to identify overbought and oversold areas.
ATR (Average True Range) to calculate dynamic stop loss and take profit. Reversal candlestick patterns such as:
Hammer and Hanging Man
Morning & Evening Star
Shooting Star Clear buy and sell orders with:
Clear entry and exit signals
Dynamic stop loss and take profit by ATR Works on all timeframes.

Spot - Fut spread v2"Spot - Fut Spread v2"
indicator is designed to track the difference between spot and futures prices on various exchanges. It automatically identifies the corresponding instrument (spot or futures) based on the current symbol and calculates the spread between the prices. This tool is useful for analyzing the delta between spot and futures markets, helping traders assess arbitrage opportunities and market sentiment.
Key Features:
- Automatic detection of spot and futures assets based on the current chart symbol.
- Supports multiple exchanges, including Binance, Bybit, OKX, MEXC, BingX, Bitget, BitMEX, Deribit, Whitebit, Gate.io, and HTX.
- Flexible asset selection: the ability to manually choose the second asset if automatic selection is disabled.
- Spread calculation between futures and spot prices.
- Moving average of the spread for smoothing data and trend analysis.
Flexible visualization:
- Color indication of positive and negative spread.
- Adjustable background transparency.
- Text label displaying the current spread and moving average values.
- Error alerts in case of invalid data.
How the Indicator Works:
- Determines whether the current symbol is a futures contract.
- Based on this, selects the corresponding spot or futures symbol.
- Retrieves price data and calculates the spread between them.
- Displays the spread value and its moving average.
- The chart background color changes based on the spread value (positive or negative).
- In case of an error, the indicator provides an alert with an explanation.
Customization Parameters:
-Exchange selection: the ability to specify a particular exchange from the list.
- Automatic pair selection: enable or disable automatic selection of the second asset.
- Moving average period: user-defined.
- Colors for positive and negative spread values.
- Moving average color.
- Background transparency.
- Background coloring source (based on spread or its moving average).
Application:
The indicator is suitable for traders who analyze the difference between spot and futures prices, look for arbitrage opportunities, and assess the premium or discount of futures relative to the spot market.
----------------------------------------------------------------------------------------------------
**"Spot - Fut Spread v2"** предназначен для отслеживания разницы между ценами на спотовом и фьючерсном рынках на различных биржах. Он автоматически определяет соответствующий инструмент (спот или фьючерс) на основе текущего символа и рассчитывает спред между ценами. Этот инструмент полезен для анализа дельты между спотовым и фьючерсным рынками, помогая трейдерам оценивать арбитражные возможности и рыночные настроения.
### **Основные функции:**
- Автоматическое определение спотовых и фьючерсных активов на основе текущего символа графика.
- Поддержка нескольких бирж, включая **Binance, Bybit, OKX, MEXC, BingX, Bitget, BitMEX, Deribit, Whitebit, Gate.io и HTX**.
- Гибкий выбор активов: возможность вручную выбрать второй актив, если автоматический выбор отключен.
- Расчет спреда между фьючерсными и спотовыми ценами.
- Скользящая средняя спреда для сглаживания данных и анализа трендов.
### **Гибкая визуализация:**
- Цветовая индикация положительного и отрицательного спреда.
- Регулируемая прозрачность фона.
- Текстовая метка с отображением текущего значения спреда и его скользящей средней.
- Оповещения об ошибках при наличии некорректных данных.
### **Как работает индикатор:**
1. Определяет, является ли текущий символ фьючерсным контрактом.
2. На основе этого выбирает соответствующий спотовый или фьючерсный актив.
3. Получает ценовые данные и рассчитывает разницу между ними.
4. Отображает значение спреда и его скользящую среднюю.
5. Фон графика меняет цвет в зависимости от значения спреда (положительный или отрицательный).
6. В случае ошибки индикатор выдает предупреждение с объяснением.
### **Настройки:**
- Выбор биржи: возможность указать конкретную биржу из списка.
- Автоматический выбор пары: включение или отключение автоматического выбора второго актива.
- Период скользящей средней: задается пользователем.
- Цвета для положительных и отрицательных значений спреда.
- Цвет скользящей средней.
- Прозрачность фона.
- Источник окраски фона (на основе спреда или его скользящей средней).
### **Применение:**
Этот индикатор подходит для трейдеров, анализирующих разницу между спотовыми и фьючерсными ценами, ищущих арбитражные возможности, а также оценивающих премию или дисконт фьючерсов относительно спотового рынка.

Broad Market MOEX### **Broad Market for Russia**
The **Broad Market for Russia** indicator provides a comparative analysis of the price deviation of major Russian stocks relative to their average closing price over a customizable lookback period. This tool helps traders identify market trends and detect relative strength or weakness among different assets.
### **How It Works:**
- The indicator calculates the **percentage deviation** of each stock’s current price from its **simple moving average (SMA)** over the defined **lookback period (in hours).**
- The **default lookback period is 24 hours**, but it can be adjusted based on the trader’s needs.
- It tracks major Russian assets, including **Gazprom, Sberbank, Lukoil, Rosneft, Norilsk Nickel, Yandex, and others**, alongside the currently selected instrument.
- Each stock’s deviation is plotted on a separate panel, allowing for quick visual comparison.
- **Positive deviation** indicates that the price is trading above its average, signaling potential **bullish momentum**.
- **Negative deviation** suggests the price is below its average, possibly indicating **bearish conditions**.
This indicator is particularly useful for traders in the Russian stock market who want to gauge broader market strength and detect divergence patterns across multiple assets.
---
### **Broad Market for Russia**
Индикатор **Broad Market for Russia** предоставляет сравнительный анализ отклонения цены крупнейших российских акций относительно их среднего значения за настраиваемый период. Этот инструмент помогает трейдерам выявлять рыночные тренды и определять относительную силу или слабость активов.
### **Как это работает:**
- Индикатор рассчитывает **процентное отклонение** текущей цены каждой акции от её **простого скользящего среднего (SMA)** за заданный **период анализа (в часах).**
- **Период анализа по умолчанию — 24 часа**, но его можно изменять в зависимости от предпочтений трейдера.
- В индикаторе отслеживаются **крупнейшие российские активы**, такие как **Газпром, Сбербанк, Лукойл, Роснефть, Норникель, Яндекс и другие**, а также текущий выбранный инструмент.
- Отклонение каждой акции отображается на отдельной панели, что позволяет быстро проводить визуальное сравнение.
- **Положительное отклонение** означает, что цена торгуется выше своего среднего значения, что может сигнализировать о **бычьем тренде**.
- **Отрицательное отклонение** указывает, что цена ниже своего среднего значения, что может свидетельствовать о **медвежьей тенденции**.
Этот индикатор особенно полезен для трейдеров российского фондового рынка, которые хотят оценить силу всего рынка и выявлять расхождения между различными активами.

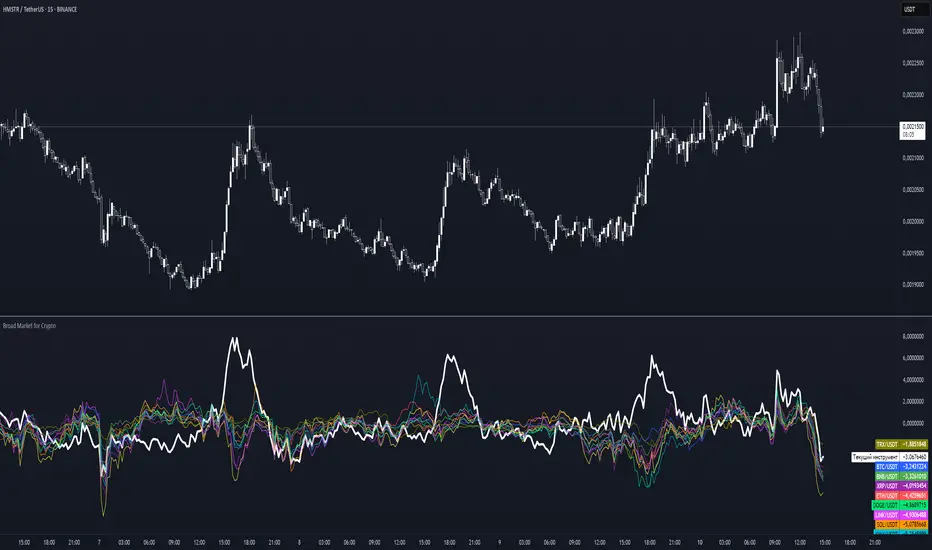
Broad Market for Crypto**Broad Market for Crypto** indicator provides a comparative analysis of the price deviation of multiple major cryptocurrencies relative to their average closing price over a customizable lookback period. This tool helps traders identify market trends and spot relative strength or weakness among different assets.
### **How It Works:**
- The indicator calculates the percentage deviation of each cryptocurrency’s current price from its simple moving average (SMA) over the defined **lookback period (in hours).**
- The **default lookback period is 24 hours**, but it can be adjusted according to the trader's preference.
- It tracks major crypto assets, including **BTC, ETH, BNB, SOL, XRP, ADA, AVAX, LINK, DOGE, and TRX**, alongside the currently selected instrument.
- Each cryptocurrency’s deviation is plotted on a separate panel, allowing for quick visual comparison.
- Positive deviation indicates that the price is trading above its average, signaling potential bullish momentum.
- Negative deviation suggests the price is below its average, possibly indicating bearish conditions.
This indicator is particularly useful for crypto traders who want to gauge the broader market’s strength and detect divergence patterns across multiple assets.
---------------------------------------------------------------------------------
**Broad Market for Crypto - Описание индикатора**
Индикатор **Broad Market for Crypto** предоставляет сравнительный анализ отклонения цены различных крупных криптовалют относительно их среднего значения за настраиваемый период. Этот инструмент помогает трейдерам выявлять рыночные тренды и определять относительную силу или слабость активов.
### **Как это работает:**
- Индикатор рассчитывает **процентное отклонение** текущей цены каждой криптовалюты от её **простого скользящего среднего (SMA)** за заданный **период анализа (в часах)**.
- **Период анализа по умолчанию — 24 часа**, но его можно изменять в зависимости от предпочтений трейдера.
- В индикаторе отслеживаются основные криптоактивы: **BTC, ETH, BNB, SOL, XRP, ADA, AVAX, LINK, DOGE и TRX**, а также текущий выбранный инструмент.
- Отклонение каждой криптовалюты отображается на отдельной панели, что позволяет быстро проводить визуальное сравнение.
- **Положительное отклонение** означает, что цена торгуется выше своего среднего значения, что может сигнализировать о **бычьем тренде**.
- **Отрицательное отклонение** указывает, что цена ниже своего среднего значения, что может свидетельствовать о **медвежьей тенденции**.
Этот индикатор особенно полезен для криптотрейдеров, желающих оценить силу всего рынка и выявлять расхождения между различными активами.
Swing Data - SETindexSET RS
What is CANSLIM?
Understanding Each Step of CANSLIM
C – Current Quarterly Earnings
A – Annual Earnings Growth
N – New Products, Services, or Management
S – Supply and Demand
L – Leader or Laggard
I – Institutional Sponsorship
M – Market Direction
The best CANSLIM screener
Advantages of CANSLIM
Disadvantages of CANSLIM
Putting it all together
Frequently asked questions

Fibonacci-Only Strategy V2Fibonacci-Only Strategy V2
This strategy combines Fibonacci retracement levels with pattern recognition and statistical confirmation to identify high-probability trading opportunities across multiple timeframes.
Core Strategy Components:
Fibonacci Levels: Uses key Fibonacci retracement levels (19% and 82.56%) to identify potential reversal zones
Pattern Recognition: Analyzes recent price patterns to find similar historical formations
Statistical Confirmation: Incorporates statistical analysis to validate entry signals
Risk Management: Includes customizable stop loss (fixed or ATR-based) and trailing stop features
Entry Signals:
Long entries occur when price touches or breaks the 19% Fibonacci level with bullish confirmation
Short entries require Fibonacci level interaction, bearish confirmation, and statistical validation
All signals are visually displayed with color-coded markers and dashboard
Trading Method:
When a triangle signal appears, open a position on the next candle
Alternatively, after seeing a signal on a higher timeframe, you can switch to a lower timeframe to find a more precise entry point
Entry signals are clearly marked with visual indicators for easy identification
Risk Management Features:
Adjustable stop loss (percentage-based or ATR-based)
Optional trailing stops for protecting profits
Multiple take-profit levels for strategic position exit
Customization Options:
Timeframe selection (1m to Daily)
Pattern length and similarity threshold adjustment
Statistical period and weight configuration
Risk parameters including stop loss and trailing stop settings
This strategy is particularly well-suited for cryptocurrency markets due to their tendency to respect Fibonacci levels and technical patterns. Crypto's volatility is effectively managed through the customizable stop-loss and trailing-stop mechanisms, making it an ideal tool for traders in digital asset markets.
For optimal performance, this strategy works best on higher timeframes (30m, 1h and above) and is not recommended for low timeframe scalping. The Fibonacci pattern recognition requires sufficient price movement to generate reliable signals, which is more consistently available in medium to higher timeframes.
Users should avoid trading during sideways market conditions, as the strategy performs best during trending markets with clear directional movement. The statistical confirmation component helps filter out some sideways market signals, but it's recommended to manually avoid ranging markets for best results.
Round NumbersTries to only show major round numbers regardless of whether you're looking at something priced in the thousands or under a dollar.

Crypto Fear/Greed IndexBINANCE:BTCUSDT BITSTAMP:BTCUSD # Crypto Fear/Greed Index
## English Description
This indicator measures market sentiment in the cryptocurrency market, specifically designed to gauge whether the market is in a state of fear or greed. By analyzing multiple factors across Bitcoin and the broader crypto ecosystem, it provides traders with a comprehensive view of market psychology.
### Key Features:
- Analyzes Bitcoin's relationship with key moving averages (200, 100, 50, and 20-day)
- Incorporates Bitcoin and Ethereum RSI values across different timeframes
- Considers Bitcoin market dominance to evaluate altcoin cycles
- Monitors stablecoin market cap changes as a risk indicator
- Tracks overall crypto market health through total market capitalization
- Factors in Bitcoin volatility and perpetual futures funding rates
- Provides clear visual buy (🔵) and sell (🔴) signals at extreme readings
- Includes customizable lookback period and smoothing parameters
### How to Use:
- Values range from 0 (Extreme Fear) to 100 (Extreme Greed)
- Buy signals (🔵) appear when the index crosses below 20, indicating potential oversold conditions
- Sell signals (🔴) appear when the index crosses above 80, indicating potential overbought conditions
- Utilize the indicator as part of a comprehensive trading strategy, not as a standalone tool
This indicator helps traders identify potential market turning points by measuring when the market sentiment reaches extremes. Remember Warren Buffett's advice: "Be fearful when others are greedy, and greedy when others are fearful."
## 日本語の説明
このインジケーターは、暗号通貨市場の感情を測定し、市場が恐怖状態にあるか強欲状態にあるかを判断するために特別に設計されています。ビットコインと広範な暗号通貨エコシステムにわたる複数の要因を分析することで、トレーダーに市場心理の包括的な見方を提供します。
### 主な特徴:
- ビットコインと主要な移動平均線(200日、100日、50日、20日)の関係を分析
- 異なる時間枠でビットコインとイーサリアムのRSI値を組み込み
- アルトコインのサイクルを評価するためにビットコインの市場支配率を考慮
- リスク指標としてステーブルコインの時価総額の変化を監視
- 総時価総額を通じて暗号通貨市場全体の健全性を追跡
- ビットコインのボラティリティと無期限先物の資金調達率を考慮
- 極端な値における明確な買い(🔵)と売り(🔴)のシグナルを提供
- カスタマイズ可能な振り返り期間と平滑化パラメータを含む
### 使用方法:
- 値は0(極度の恐怖)から100(極度の強欲)の範囲
- インデックスが20を下回ると買いシグナル(🔵)が表示され、潜在的な売られ過ぎの状態を示します
- インデックスが80を上回ると売りシグナル(🔴)が表示され、潜在的な買われ過ぎの状態を示します
- 単独のツールとしてではなく、包括的な取引戦略の一部としてこのインジケーターを活用してください
このインジケーターは、市場感情が極端に達したときに潜在的な市場の転換点を識別するのに役立ちます。ウォーレン・バフェットの助言を覚えておいてください
「他人が強欲なときに恐れ、他人が恐れているときに強欲になれ」

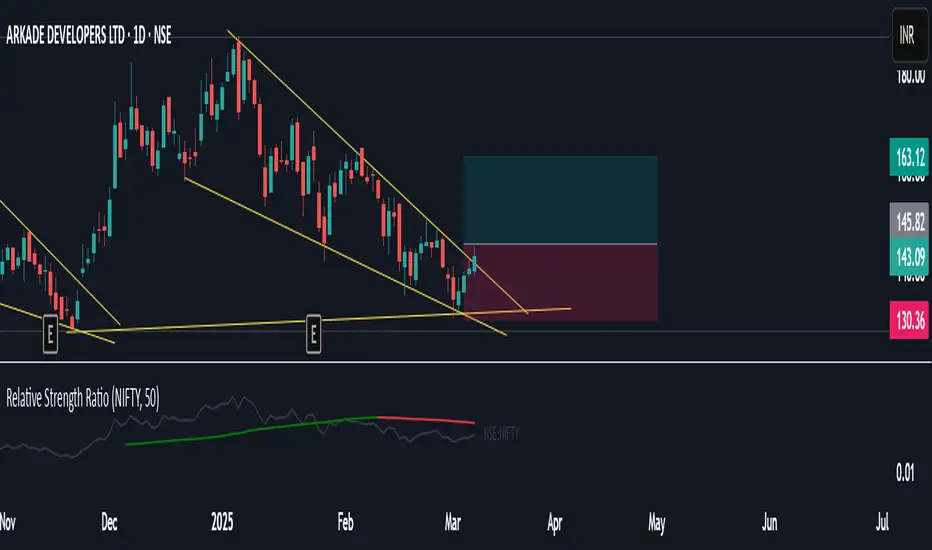
Relative Strength RatioWhen comparing a stock’s strength against NIFTY 50, the Relative Strength (RS) is calculated to measure how the stock is performing relative to the index. This is different from the RSI but is often used alongside it.
How It Works:
Relative Strength (RS) Calculation:
𝑅
𝑆
=
Stock Price
NIFTY 50 Price
RS=
NIFTY 50 Price
Stock Price
This shows how a stock is performing relative to the NIFTY 50 index.
Relative Strength Ratio Over Time:
If the RS value is increasing, the stock is outperforming NIFTY 50.
If the RS value is decreasing, the stock is underperforming NIFTY 50.
Finotive MinSLThis is not an INDICATOR.
This is specifically designed to display minimum stop loss for a specific prop firm.
This should not be used by any other users.
