Advanced Momentum Scanner [QuantAlgo]Introducing the Advanced Momentum Scanner by QuantAlgo , a sophisticated technical indicator that leverages multiple EMA combinations, momentum metrics, and adaptive visualization techniques to provide deep insights into market trends and momentum shifts. It is particularly valuable for those looking to identify high-probability trading and investing opportunities based on trend changes and momentum shifts across any market and timeframe.
🟢 Technical Foundation
The Advanced Momentum Scanner utilizes sophisticated trend analysis techniques to identify market momentum and trend direction. The core strategy employs a multi-layered approach with four different EMA periods:
Ultra-Fast EMA for quick trend changes detection
Fast EMA for short-term trend analysis
Mid EMA for intermediate confirmation
Slow EMA for long-term trend identification
For momentum detection, the indicator implements a Rate of Change (RoC) calculation to measure price momentum over a specified period. It further enhances analysis by incorporating RSI readings, volatility measurements through ATR, and optional volume confirmation. When these elements align, the indicator generates various trading signals based on the selected sensitivity mode.
🟢 Key Features & Signals
1. Multi-Period Trend Identification
The indicator combines multiple EMAs of different lengths to provide comprehensive trend analysis within the same timeframe, displaying the information through color-coded visual elements on the chart.
When an uptrend is detected, chart elements are colored with the bullish theme color (default: green/teal).
Similarly, when a downtrend is detected, chart elements are colored with the bearish theme color (default: red).
During neutral or indecisive periods, chart elements are colored with a neutral gray color, providing clear visual distinction between trending and non-trending market conditions.
This visualization provides immediate insights into underlying trend direction without requiring separate indicators, helping traders and investors quickly identify the market's current state.
2. Trend Strength Information Panel
The trend panel operates in three different sensitivity modes (Conservative, Aggressive, and Balanced), each affecting how the indicator processes and displays market information.
The Conservative mode prioritizes signal reliability over frequency, showing only strong trend movements with high conviction levels.
The Aggressive mode detects early trend changes, providing more frequent signals but potentially more false positives.
The Balanced mode offers a middle ground with moderate signal frequency and reliability.
Regardless of the selected mode, the panel displays:
Current trend direction (UPTREND, DOWNTREND, or NEUTRAL)
Trend strength percentage (0-100%)
Early detection signals when applicable
The active sensitivity mode
This comprehensive approach helps traders and investors:
→ Assess the strength and reliability of current market trends
→ Identify early potential trend changes before full confirmation
→ Make more informed trading and investing decisions based on trend context
3. Customizable Visualization Settings
This indicator offers extensive visual customization options to suit different trading/investing styles and preferences:
Display options:
→ Fully customizable uptrend, downtrend, and neutral colors
→ Color-coded price bars showing trend direction
→ Dynamic gradient bands visualizing potential trend channels
→ Optional background coloring based on trend intensity
→ Adjustable transparency levels for all visual elements
These visualization settings can be fine-tuned through the indicator's interface, allowing traders and investors to create a personalized chart environment that emphasizes the most relevant information for their strategy.
The indicator also features a comprehensive alert system with notifications for:
New trend formations (uptrend, downtrend, neutral)
Early trend change signals
Momentum threshold crossovers
Other significant market conditions
Alerts can be delivered through TradingView's notification system, making it easy to stay informed of important market developments even when you are away from the charts.
🟢 Practical Usage Tips
→ Trend Analysis and Interpretation: The indicator visualizes trend direction and strength directly on the chart through color-coding and the information panel, allowing traders and investors to immediately identify the current market context. This information helps in assessing the potential for continuation or reversal.
→ Signal Generation Strategies: The indicator generates potential trading signals based on trend direction, momentum confirmation, and selected sensitivity mode. Users can choose between Conservative (fewer but more reliable signals), Balanced (moderate approach), or Aggressive (more frequent but potentially less reliable signals).
→ Multi-Period Trend Assessment: Through its layered EMA approach, the indicator enables users to understand trend conditions across different lookback periods within the same timeframe. This helps in identifying the dominant trend and potential turning points.
🟢 Pro Tips
Adjust EMA periods based on your timeframe:
→ Lower values for shorter timeframes and more frequent signals
→ Higher values for higher timeframes and more reliable signals
Fine-tune sensitivity mode based on your trading style:
→ "Conservative" for position trading/long-term investing and fewer false signals
→ "Balanced" for swing trading/medium-term investing with moderate signal frequency
→ "Aggressive" for scalping/day trading and catching early trend changes
Look for confluence between components:
→ Strong trend strength percentage and direction in the information panel
→ Overall market context aligning with the expected direction
Use for multiple trading approaches:
→ Trend following during strong momentum periods
→ Counter-trend trading at band extremes during overextension
→ Early trend change detection with sensitivity adjustments
→ Stop loss placement using dynamic bands
Combine with:
→ Volume indicators like the Volume Delta & Order Block Suite for additional confirmation
→ Support/resistance analysis for strategic entry/exit points
→ Multiple timeframe analysis for broader market context
Strategy

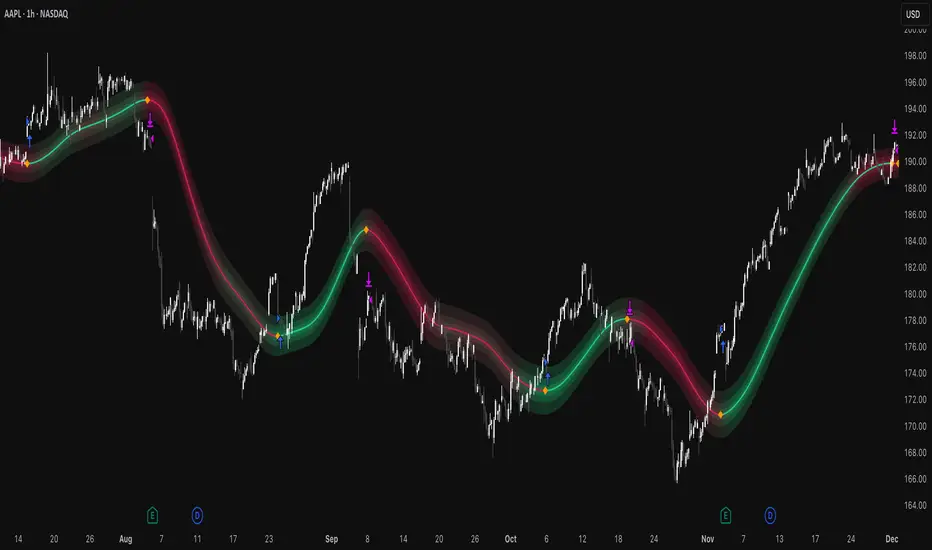
Gradient Trend Filter STRATEGY [ChartPrime/PineIndicators]This strategy is based on the Gradient Trend Filter indicator developed by ChartPrime. Full credit for the concept and indicator goes to ChartPrime.
The Gradient Trend Filter Strategy is designed to execute trades based on the trend analysis and filtering system provided by the Gradient Trend Filter indicator. It integrates a noise-filtered trend detection system with a color-gradient visualization, helping traders identify trend strength, momentum shifts, and potential reversals.
How the Gradient Trend Filter Strategy Works
1. Noise Filtering for Smoother Trends
To reduce false signals caused by market noise, the strategy applies a three-stage smoothing function to the source price. This function ensures that trend shifts are detected more accurately, minimizing unnecessary trade entries and exits.
The filter is based on an Exponential Moving Average (EMA)-style smoothing technique.
It processes price data in three successive passes, refining the trend signal before generating trade entries.
This filtering technique helps eliminate minor fluctuations and highlights the true underlying trend.
2. Multi-Layered Trend Bands & Color-Based Trend Visualization
The Gradient Trend Filter constructs multiple trend bands around the filtered trend line, acting as dynamic support and resistance zones.
The mid-line changes color based on the trend direction:
Green for uptrends
Red for downtrends
A gradient cloud is formed around the trend line, dynamically shifting colors to provide early warning signals of trend reversals.
The outer bands function as potential support and resistance, helping traders determine stop-loss and take-profit zones.
Visualization elements used in this strategy:
Trend Filter Line → Changes color between green (bullish) and red (bearish).
Trend Cloud → Dynamically adjusts color based on trend strength.
Orange Markers → Appear when a trend shift is confirmed.
Trade Entry & Exit Conditions
This strategy automatically enters trades based on confirmed trend shifts detected by the Gradient Trend Filter.
1. Trade Entry Rules
Long Entry:
A bullish trend shift is detected (trend direction changes to green).
The filtered trend value crosses above zero, confirming upward momentum.
The strategy enters a long position.
Short Entry:
A bearish trend shift is detected (trend direction changes to red).
The filtered trend value crosses below zero, confirming downward momentum.
The strategy enters a short position.
2. Trade Exit Rules
Closing a Long Position:
If a bearish trend shift occurs, the strategy closes the long position.
Closing a Short Position:
If a bullish trend shift occurs, the strategy closes the short position.
The trend shift markers (orange diamonds) act as a confirmation signal, reinforcing the validity of trade entries and exits.
Customization Options
This strategy allows traders to adjust key parameters for flexibility in different market conditions:
Trade Direction: Choose between Long Only, Short Only, or Long & Short .
Trend Length: Modify the length of the smoothing function to adapt to different timeframes.
Line Width & Colors: Customize the visual appearance of trend lines and cloud colors.
Performance Table: Enable or disable the equity performance table that tracks historical trade results.
Performance Tracking & Reporting
A built-in performance table is included to monitor monthly and yearly trading performance.
The table calculates monthly percentage returns, displaying them in a structured format.
Color-coded values highlight profitable months (blue) and losing months (red).
Tracks yearly cumulative performance to assess long-term strategy effectiveness.
Traders can use this feature to evaluate historical performance trends and optimize their strategy settings accordingly.
How to Use This Strategy
Identify Trend Strength & Reversals:
Use the trend line and cloud color changes to assess trend strength and detect potential reversals.
Monitor Momentum Shifts:
Pay attention to gradient cloud color shifts, as they often appear before the trend line changes color.
This can indicate early momentum weakening or strengthening.
Act on Trend Shift Markers:
Use orange diamonds as confirmation signals for trend shifts and trade entry/exit points.
Utilize Cloud Bands as Support/Resistance:
The outer bands of the cloud serve as dynamic support and resistance, helping with stop-loss and take-profit placement.
Considerations & Limitations
Trend Lag: Since the strategy applies a smoothing function, entries may be slightly delayed compared to raw price action.
Volatile Market Conditions: In high-volatility markets, trend shifts may occur more frequently, leading to higher trade frequency.
Optimized for Trend Trading: This strategy is best suited for trending markets and may produce false signals in sideways (ranging) conditions.
Conclusion
The Gradient Trend Filter Strategy is a trend-following system based on the Gradient Trend Filter indicator by ChartPrime. It integrates noise filtering, trend visualization, and gradient-based color shifts to help traders identify strong market trends and potential reversals.
By combining trend filtering with a multi-layered cloud system, the strategy provides clear trade signals while minimizing noise. Traders can use this strategy for long-term trend trading, momentum shifts, and support/resistance-based decision-making.
This strategy is a fully automated system that allows traders to execute long, short, or both directions, with customizable settings to adapt to different market conditions.
Credit for the original concept and indicator goes to ChartPrime.
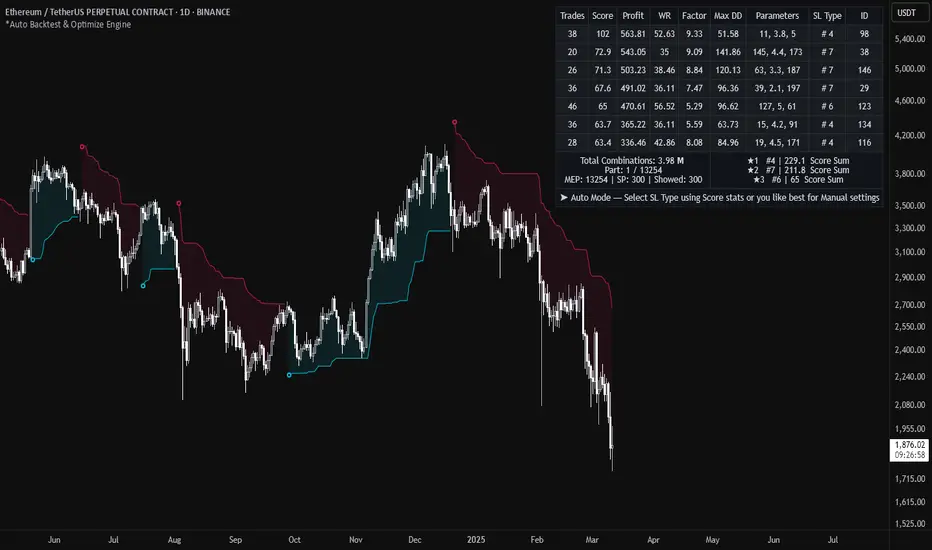
*Auto Backtest & Optimize EngineFull-featured Engine for Automatic Backtesting and parameter optimization. Allows you to test millions of different combinations of stop-loss and take profit parameters, including on any connected indicators.
⭕️ Key Futures
Quickly identify the optimal parameters for your strategy.
Automatically generate and test thousands of parameter combinations.
A simple Genetic Algorithm for result selection.
Saves time on manual testing of multiple parameters.
Detailed analysis, sorting, filtering and statistics of results.
Detailed control panel with many tooltips.
Display of key metrics: Profit, Win Rate, etc..
Comprehensive Strategy Score calculation.
In-depth analysis of the performance of different types of stop-losses.
Possibility to use to calculate the best Stop-Take parameters for your position.
Ability to test your own functions and signals.
Customizable visualization of results.
Flexible Stop-Loss Settings:
• Auto ━ Allows you to test all types of Stop Losses at once(listed below).
• S.VOLATY ━ Static stop based on volatility (Fixed, ATR, STDEV).
• Trailing ━ Classic trailing stop following the price.
• Fast Trail ━ Accelerated trailing stop that reacts faster to price movements.
• Volatility ━ Dynamic stop based on volatility indicators.
• Chandelier ━ Stop based on price extremes.
• Activator ━ Dynamic stop based on SAR.
• MA ━ Stop based on moving averages (9 different types).
• SAR ━ Parabolic SAR (Stop and Reverse).
Advanced Take-Profit Options:
• R:R: Risk/Reward ━ sets TP based on SL size.
• T.VOLATY ━ Calculation based on volatility indicators (Fixed, ATR, STDEV).
Testing Modes:
• Stops ━ Cyclical stop-loss testing
• Pivot Point Example ━ Example of using pivot points
• External Example ━ Built-in example how test functions with different parameters
• External Signal ━ Using external signals
⭕️ Usage
━ First Steps:
When opening, select any point on the chart. It will not affect anything until you turn on Manual Start mode (more on this below).
The chart will immediately show the best results of the default Auto mode. You can switch Part's to try to find even better results in the table.
Now you can display any result from the table on the chart by entering its ID in the settings.
Repeat steps 3-4 until you determine which type of Stop Loss you like best. Then set it in the settings instead of Auto mode.
* Example: I flipped through 14 parts before I liked the first result and entered its ID so I could visually evaluate it on the chart.
Then select the stop loss type, choose it in place of Auto mode and repeat steps 3-4 or immediately follow the recommendations of the algorithm.
Now the Genetic Algorithm at the bottom right will prompt you to enter the Parameters you need to search for and select even better results.
Parameters must be entered All at once before they are updated. Enter recommendations strictly in fields with the same names.
Repeat steps 5-6 until there are approximately 10 Part's left or as you like. And after that, easily pour through the remaining Parts and select the best parameters.
━ Example of the finished result.
━ Example of use with Takes
You can also test at the same time along with Take Profit. In this example, I simply enabled Risk/Reward mode and immediately specified in the TP field Maximum RR, Minimum RR and Step. So in this example I can test (3-1) / 0.1 = 20 Takes of different sizes. There are additional tips in the settings.
━
* Soon you will start to understand how the system works and things will become much easier.
* If something doesn't work, just reset the engine settings and start over again.
* Use the tips I have left in the settings and on the Panel.
━ Details:
Sort ━ Sorting results by Score, Profit, Trades, etc..
Filter ━ Filtring results by Score, Profit, Trades, etc..
Trade Type ━ Ability to disable Long\Short but only from statistics.
BackWin ━ Backtest Window Number of Candle the script can test.
Manual Start ━ Enabling it will allow you to call a Stop from a selected point. which you selected when you started the engine.
* If you have a real open position then this mode can help to save good Stop\Take for it.
1 - 9 Сheckboxs ━ Allow you to disable any stop from Auto mode.
Ex Source - Allow you to test Stops/Takes from connected indicators.
Connection guide:
//@version=6
indicator("My script")
rsi = ta.rsi(close, 14)
buy = not na(rsi) and ta.crossover (rsi, 40) // OS = 40
sell = not na(rsi) and ta.crossunder(rsi, 60) // OB = 60
Signal = buy ? +1 : sell ? -1 : 0
plot(Signal, "🔌Connector🔌", display = display.none)
* Format the signal for your indicator in a similar style and then select it in Ex Source.
⭕️ How it Works
Hypothesis of Uniform Distribution of Rare Elements After Mixing.
'This hypothesis states that if an array of N elements contains K valid elements, then after mixing, these valid elements will be approximately uniformly distributed.'
'This means that in a random sample of k elements, the proportion of valid elements should closely match their proportion in the original array, with some random variation.'
'According to the central limit theorem, repeated sampling will result in an average count of valid elements following a normal distribution.'
'This supports the assumption that the valid elements are evenly spread across the array.'
'To test this hypothesis, we can conduct an experiment:'
'Create an array of 1,000,000 elements.'
'Select 1,000 random elements (1%) for validation.'
'Shuffle the array and divide it into groups of 1,000 elements.'
'If the hypothesis holds, each group should contain, on average, 1~ valid element, with minor variations.'
* I'd like to attach more details to My hypothesis but it won't be very relevant here. Since this is a whole separate topic, I will leave the minimum part for understanding the engine.
Practical Application
To apply this hypothesis, I needed a way to generate and thoroughly mix numerous possible combinations. Within Pine, generating over 100,000 combinations presents significant challenges, and storing millions of combinations requires excessive resources.
I developed an efficient mechanism that generates combinations in random order to address these limitations. While conventional methods often produce duplicates or require generating a complete list first, my approach guarantees that the first 10% of possible combinations are both unique and well-distributed. Based on my hypothesis, this sampling is sufficient to determine optimal testing parameters.
Most generators and randomizers fail to accommodate both my hypothesis and Pine's constraints. My solution utilizes a simple Linear Congruential Generator (LCG) for pseudo-randomization, enhanced with prime numbers to increase entropy during generation. I pre-generate the entire parameter range and then apply systematic mixing. This approach, combined with a hybrid combinatorial array-filling technique with linear distribution, delivers excellent generation quality.
My engine can efficiently generate and verify 300 unique combinations per batch. Based on the above, to determine optimal values, only 10-20 Parts need to be manually scrolled through to find the appropriate value or range, eliminating the need for exhaustive testing of millions of parameter combinations.
For the Score statistic I applied all the same, generated a range of Weights, distributed them randomly for each type of statistic to avoid manual distribution.
Score ━ based on Trade, Profit, WinRate, Profit Factor, Drawdown, Sharpe & Sortino & Omega & Calmar Ratio.
⭕️ Notes
For attentive users, a little tricks :)
To save time, switch parts every 3 seconds without waiting for it to load. After 10-20 parts, stop and wait for loading. If the pause is correct, you can switch between the rest of the parts without loading, as they will be cached. This used to work without having to wait for a pause, but now it does slower. This will save a lot of time if you are going to do a deeper backtest.
Sometimes you'll get the error “The scripts take too long to execute.”
For a quick fix you just need to switch the TF or Ticker back and forth and most likely everything will load.
The error appears because of problems on the side of the site because the engine is very heavy. It can also appear if you set too long a period for testing in BackWin or use a heavy indicator for testing.
Manual Start - Allow you to Start you Result from any point. Which in turn can help you choose a good stop-stick for your real position.
* It took me half a year from idea to current realization. This seems to be one of the few ways to build something automatic in backtest format and in this particular Pine environment. There are already better projects in other languages, and they are created much easier and faster because there are no limitations except for personal PC. If you see solutions to improve this system I would be glad if you share the code. At the moment I am tired and will continue him not soon.
Also You can use my previosly big Backtest project with more manual settings(updated soon)
RSI & EMA Crossover Strategy with Daily & Weekly RSI Filter### Algorithm Description: RSI & EMA-Based Trading Strategy with Daily & Weekly RSI Filter
#### **Overview:**
This algorithm is designed to generate trading signals using a combination of **Relative Strength Index (RSI) and Exponential Moving Averages (EMA)**, with a multi-timeframe filter that ensures alignment between the daily and weekly RSI. The strategy aims to capture momentum-based trades while filtering out weak signals using higher timeframe confirmations.
#### **Key Components:**
1. **Primary Indicators:**
- **Relative Strength Index (RSI)**: Used to identify overbought and oversold conditions and confirm momentum direction.
- **Exponential Moving Averages (EMA)**: Used to determine trend direction and dynamic support/resistance levels.
2. **Multi-Timeframe RSI Filter:**
- **Daily RSI (Lower Timeframe)**: Used to identify potential entry points.
- **Weekly RSI (Higher Timeframe)**: Acts as a trend filter to ensure trades align with broader market direction.
#### **Trading Conditions:**
##### **Buy (Long) Entry Conditions:**
1. **Weekly RSI > 50** (indicating bullish momentum on the higher timeframe).
2. **Daily RSI crosses above 50** from below.
3. **Price is above both the 8-EMA and 21-EMA** on the daily timeframe.
4. **Confirmation:** Bullish price action near the EMAs.
##### **Sell (Short) Entry Conditions:**
1. **Weekly RSI < 50** (indicating bearish momentum on the higher timeframe).
2. **Daily RSI crosses below 50** from above.
3. **Price is below both the 8-EMA and 21-EMA** on the daily timeframe.
4. **Confirmation:** Bearish price action near the EMAs.
#### **Exit Strategy:**
- **Profit Target:** Can be set at a fixed percentage (e.g., 2-5%) or based on key resistance/support levels.
- **Stop Loss:** Placed below/above the 21-EMA or at a recent swing low/high.
- **Trailing Stop:** Can be applied based on ATR or moving averages.
#### **Advantages of This Strategy:**
✅ **Multi-Timeframe Confirmation:** Avoids false signals by ensuring alignment between daily and weekly trends.
✅ **Momentum-Based Approach:** Uses RSI for entry confirmation, reducing the risk of trading against the trend.
✅ **Trend Filtering:** EMAs ensure that trades are taken in the direction of the primary trend.
Would you like this converted into Pine Script for automation? 🚀

Market Trend Levels Non-Repainting [BigBeluga X PineIndicators]This strategy is based on the Market Trend Levels Detector developed by BigBeluga. Full credit for the concept and original indicator goes to BigBeluga.
The Market Trend Levels Detector Strategy is a non-repainting trend-following strategy that identifies market trend shifts using two Exponential Moving Averages (EMA). It also detects key price levels and allows traders to apply multiple filters to refine trade entries and exits.
This strategy is designed for trend trading and enables traders to:
Identify trend direction based on EMA crossovers.
Detect significant market levels using labeled trend lines.
Use multiple filter conditions to improve trade accuracy.
Avoid false signals through non-repainting calculations.
How the Market Trend Levels Detector Strategy Works
1. Core Trend Detection Using EMA Crossovers
The strategy detects trend shifts using two EMAs:
Fast EMA (default: 12 periods) – Reacts quickly to price movements.
Slow EMA (default: 25 periods) – Provides a smoother trend confirmation.
A bullish crossover (Fast EMA crosses above Slow EMA) signals an uptrend , while a bearish crossover (Fast EMA crosses below Slow EMA) signals a downtrend .
2. Market Level Detection & Visualization
Each time an EMA crossover occurs, a trend level line is drawn:
Bullish crossover → A green line is drawn at the low of the crossover candle.
Bearish crossover → A purple line is drawn at the high of the crossover candle.
Lines can be extended to act as support and resistance zones for future price action.
Additionally, a small label (●) appears at each crossover to mark the event on the chart.
3. Trade Entry & Exit Conditions
The strategy allows users to choose between three trading modes:
Long Only – Only enters long trades.
Short Only – Only enters short trades.
Long & Short – Trades in both directions.
Entry Conditions
Long Entry:
A bullish EMA crossover occurs.
The trade direction setting allows long trades.
Filter conditions (if enabled) confirm a valid long signal.
Short Entry:
A bearish EMA crossover occurs.
The trade direction setting allows short trades.
Filter conditions (if enabled) confirm a valid short signal.
Exit Conditions
Long Exit:
A bearish EMA crossover occurs.
Exit filters (if enabled) indicate an invalid long position.
Short Exit:
A bullish EMA crossover occurs.
Exit filters (if enabled) indicate an invalid short position.
Additional Trade Filters
To improve trade accuracy, the strategy allows traders to apply up to 7 additional filters:
RSI Filter: Only trades when RSI confirms a valid trend.
MACD Filter: Ensures MACD histogram supports the trade direction.
Stochastic Filter: Requires %K line to be above/below threshold values.
Bollinger Bands Filter: Confirms price position relative to the middle BB line.
ADX Filter: Ensures the trend strength is above a set threshold.
CCI Filter: Requires CCI to indicate momentum in the right direction.
Williams %R Filter: Ensures price momentum supports the trade.
Filters can be enabled or disabled individually based on trader preference.
Dynamic Level Extension Feature
The strategy provides an optional feature to extend trend lines until price interacts with them again:
Bullish support lines extend until price revisits them.
Bearish resistance lines extend until price revisits them.
If price breaks a line, the line turns into a dotted style , indicating it has been breached.
This helps traders identify key levels where trend shifts previously occurred, providing useful support and resistance insights.
Customization Options
The strategy includes several adjustable settings :
Trade Direction: Choose between Long Only, Short Only, or Long & Short.
Trend Lengths: Adjust the Fast & Slow EMA lengths.
Market Level Extension: Decide whether to extend support/resistance lines.
Filters for Trade Confirmation: Enable/disable individual filters.
Color Settings: Customize line colors for bullish and bearish trend shifts.
Maximum Displayed Lines: Limit the number of drawn support/resistance lines.
Considerations & Limitations
Trend Lag: As with any EMA-based strategy, signals may be slightly delayed compared to price action.
Sideways Markets: This strategy works best in trending conditions; frequent crossovers in sideways markets can produce false signals.
Filter Usage: Enabling multiple filters may reduce trade frequency, but can also improve trade quality.
Line Overlap: If many crossovers occur in a short period, the chart may become cluttered with multiple trend levels. Adjusting the "Display Last" setting can help.
Conclusion
The Market Trend Levels Detector Strategy is a non-repainting trend-following system that combines EMA crossovers, market level detection, and customizable filters to improve trade accuracy.
By identifying trend shifts and key price levels, this strategy can be used for:
Trend Confirmation – Using EMA crossovers and filters to confirm trend direction.
Support & Resistance Trading – Identifying dynamic levels where price reacts.
Momentum-Based Trading – Combining EMA crossovers with additional momentum filters.
This strategy is fully customizable and can be adapted to different trading styles, timeframes, and market conditions.
Full credit for the original concept and indicator goes to BigBeluga.

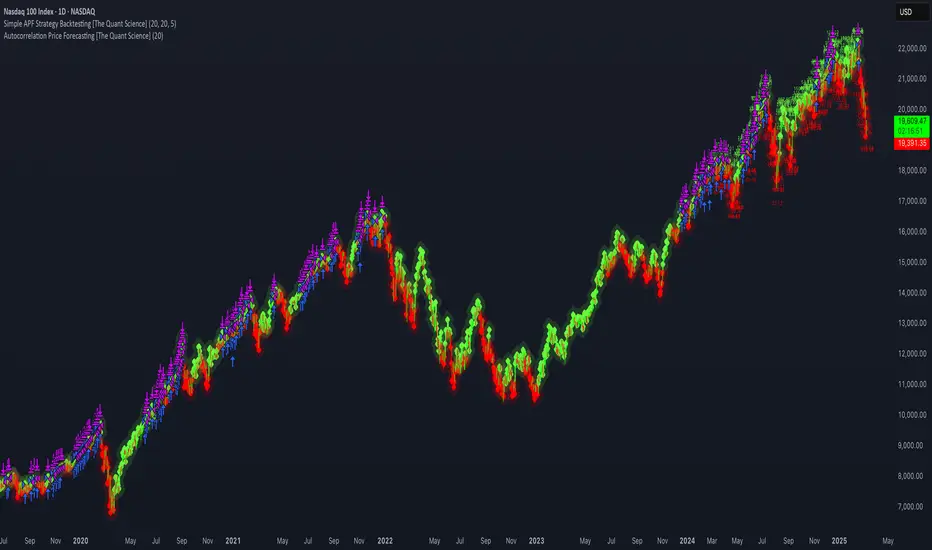
Simple APF Strategy Backtesting [The Quant Science]Simple backtesting strategy for the quantitative indicator Autocorrelation Price Forecasting. This is a Buy & Sell strategy that operates exclusively with long orders. It opens long positions and generates profit based on the future price forecast provided by the indicator. It's particularly suitable for trend-following trading strategies or directional markets with an established trend.
Main functions
1. Cycle Detection: Utilize autocorrelation to identify repetitive market behaviors and cycles.
2. Forecasting for Backtesting: Simulate trades and assess the profitability of various strategies based on future price predictions.
Logic
The strategy works as follow:
Entry Condition: Go long if the hypothetical gain exceeds the threshold gain (configurable by user interface).
Position Management: Sets a take-profit level based on the future price.
Position Sizing: Automatically calculates the order size as a percentage of the equity.
No Stop-Loss: this strategy doesn't includes any stop loss.
Example Use Case
A trader analyzes a dayli period using 7 historical bars for autocorrelation.
Sets a threshold gain of 20 points using a 5% of the equity for each trade.
Evaluates the effectiveness of a long-only strategy in this period to assess its profitability and risk-adjusted performance.
User Interface
Length: Set the length of the data used in the autocorrelation price forecasting model.
Thresold Gain: Minimum value to be considered for opening trades based on future price forecast.
Order Size: percentage size of the equity used for each single trade.
Strategy Limit
This strategy does not use a stop loss. If the price continues to drop and the future price forecast is incorrect, the trader may incur a loss or have their capital locked in the losing trade.
Disclaimer!
This is a simple template. Use the code as a starting point rather than a finished solution. The script does not include important parameters, so use it solely for educational purposes or as a boilerplate.
1H EMA 200 + 15M Supertrend Strategy This strategy is a **multi-timeframe trend-following strategy** that uses the **200 EMA on the 1-hour chart** for trend confirmation and the **Supertrend indicator on the 15-minute chart** for entry signals. Here’s a brief description of how it works:
---
### **Key Components**
1. **Trend Confirmation (1-Hour Chart)**:
- The **200 EMA** is used to determine the overall trend.
- **Buy Signal**: Price is above the 200 EMA (uptrend).
- **Sell Signal**: Price is below the 200 EMA (downtrend).
2. **Entry Signal (15-Minute Chart)**:
- The **Supertrend indicator** is used to generate entry signals.
- **Buy Signal**: Supertrend is in an uptrend (green).
- **Sell Signal**: Supertrend is in a downtrend (red).
3. **Stop-Loss and Take-Profit**:
- **Stop-Loss**: Fixed at the Supertrend value at the time of entry.
- **Take-Profit**: 1.5x the distance between the entry price and the stop-loss.
4. **Trade Management**:
- The strategy **closes the previous trade** whenever a new signal is generated, ensuring only one trade is active at a time.
---
### **How It Works**
1. **Buy Setup**:
- Price is above the 200 EMA (1-hour chart).
- Supertrend is green (15-minute chart).
- A buy trade is opened with:
- **Stop-Loss**: Supertrend value at entry.
- **Take-Profit**: 1.5x the distance between the entry price and the stop-loss.
2. **Sell Setup**:
- Price is below the 200 EMA (1-hour chart).
- Supertrend is red (15-minute chart).
- A sell trade is opened with:
- **Stop-Loss**: Supertrend value at entry.
- **Take-Profit**: 1.5x the distance between the stop-loss and the entry price.
3. **Trade Exit**:
- The trade is closed when either the **stop-loss** or **take-profit** is hit.
- If a new signal is generated, the previous trade is closed, and a new trade is opened.
---
### **Example**
- **Buy Trade**:
- Entry Price: $100
- Supertrend (Stop-Loss): $98
- Take-Profit: $100 + 1.5 * ($100 - $98) = $103
- **Sell Trade**:
- Entry Price: $100
- Supertrend (Stop-Loss): $102
- Take-Profit: $100 - 1.5 * ($102 - $100) = $97
---
### **Advantages**
- **Trend-Following**: Trades in the direction of the higher timeframe trend.
- **Clear Entry Signals**: Uses Supertrend for precise entries.
- **Risk Management**: Fixed stop-loss and take-profit levels based on Supertrend.
---
### **Customization**
- Adjust the **ATR length** and **factor** in the Supertrend settings.
- Modify the **take-profit multiplier** (e.g., 2x SL) if needed.
---
This strategy is designed to capture trends while managing risk effectively. Let me know if you need further adjustments! 🚀

Liquidity Sweep Filter Strategy [AlgoAlpha X PineIndicators]This strategy is based on the Liquidity Sweep Filter developed by AlgoAlpha. Full credit for the concept and original indicator goes to AlgoAlpha.
The Liquidity Sweep Filter Strategy is a non-repainting trading system designed to identify liquidity sweeps, trend shifts, and high-impact price levels. It incorporates volume-based liquidation analysis, trend confirmation, and dynamic support/resistance detection to optimize trade entries and exits.
This strategy helps traders:
Detect liquidity sweeps where major market participants trigger stop losses and liquidations.
Identify trend shifts using a volatility-based moving average system.
Analyze volume distribution with a built-in volume profile visualization.
Filter noise by differentiating between major and minor liquidity sweeps.
How the Liquidity Sweep Filter Strategy Works
1. Trend Detection Using Volatility-Based Filtering
The strategy applies a volatility-adjusted moving average system to determine trend direction:
A central trend line is calculated using an EMA smoothed over a user-defined length.
Upper and lower deviation bands are created based on the average price deviation over multiple periods.
If price closes above the upper band, the strategy signals an uptrend.
If price closes below the lower band, the strategy signals a downtrend.
This approach ensures that trend shifts are confirmed only when price significantly moves beyond normal market fluctuations.
2. Liquidity Sweep Detection
Liquidity sweeps occur when price temporarily breaks key levels, triggering stop-loss liquidations or margin call events. The strategy tracks swing highs and lows, marking potential liquidity grabs:
Bearish Liquidity Sweeps – Price breaks a recent high, then reverses downward.
Bullish Liquidity Sweeps – Price breaks a recent low, then reverses upward.
Volume Integration – The strategy analyzes trading volume at each sweep to differentiate between major and minor sweeps.
Key levels where liquidity sweeps occur are plotted as color-coded horizontal lines:
Red lines indicate bearish liquidity sweeps.
Green lines indicate bullish liquidity sweeps.
Labels are displayed at each sweep, showing the volume of liquidated positions at that level.
3. Volume Profile Analysis
The strategy includes an optional volume profile visualization, displaying how trading volume is distributed across different price levels.
Features of the volume profile:
Point of Control (POC) – The price level with the highest traded volume is marked as a key area of interest.
Bounding Box – The profile is enclosed within a transparent box, helping traders visualize the price range of high trading activity.
Customizable Resolution & Scale – Traders can adjust the granularity of the profile to match their preferred time frame.
The volume profile helps identify zones of strong support and resistance, making it easier to anticipate price reactions at key levels.
Trade Entry & Exit Conditions
The strategy allows traders to configure trade direction:
Long Only – Only takes long trades.
Short Only – Only takes short trades.
Long & Short – Trades in both directions.
Entry Conditions
Long Entry:
A bullish trend shift is confirmed.
A bullish liquidity sweep occurs (price sweeps below a key level and reverses).
The trade direction setting allows long trades.
Short Entry:
A bearish trend shift is confirmed.
A bearish liquidity sweep occurs (price sweeps above a key level and reverses).
The trade direction setting allows short trades.
Exit Conditions
Closing a Long Position:
A bearish trend shift occurs.
The position is liquidated at a predefined liquidity sweep level.
Closing a Short Position:
A bullish trend shift occurs.
The position is liquidated at a predefined liquidity sweep level.
Customization Options
The strategy offers multiple adjustable settings:
Trade Mode: Choose between Long Only, Short Only, or Long & Short.
Trend Calculation Length & Multiplier: Adjust how trend signals are calculated.
Liquidity Sweep Sensitivity: Customize how aggressively the strategy identifies sweeps.
Volume Profile Display: Enable or disable the volume profile visualization.
Bounding Box & Scaling: Control the size and position of the volume profile.
Color Customization: Adjust colors for bullish and bearish signals.
Considerations & Limitations
Liquidity sweeps do not always result in reversals. Some price sweeps may continue in the same direction.
Works best in volatile markets. In low-volatility environments, liquidity sweeps may be less reliable.
Trend confirmation adds a slight delay. The strategy ensures valid signals, but this may result in slightly later entries.
Large volume imbalances may distort the volume profile. Adjusting the scale settings can help improve visualization.
Conclusion
The Liquidity Sweep Filter Strategy is a volume-integrated trading system that combines liquidity sweeps, trend analysis, and volume profile data to optimize trade execution.
By identifying key price levels where liquidations occur, this strategy provides valuable insight into market behavior, helping traders make better-informed trading decisions.
Key use cases for this strategy:
Liquidity-Based Trading – Capturing moves triggered by stop hunts and liquidations.
Volume Analysis – Using volume profile data to confirm high-activity price zones.
Trend Following – Entering trades based on confirmed trend shifts.
Support & Resistance Trading – Using liquidity sweep levels as dynamic price zones.
This strategy is fully customizable, allowing traders to adapt it to different market conditions, timeframes, and risk preferences.
Full credit for the original concept and indicator goes to AlgoAlpha.

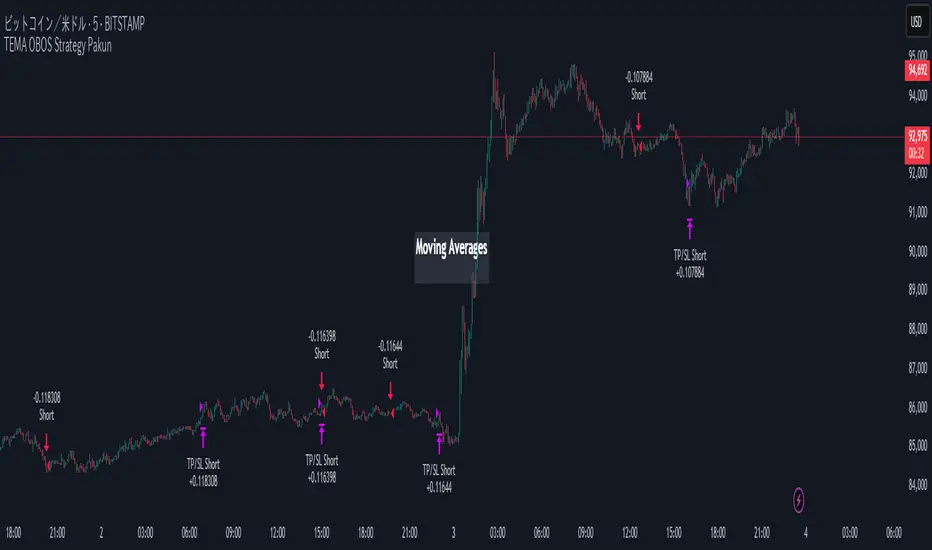
TEMA OBOS Strategy PakunTEMA OBOS Strategy
Overview
This strategy combines a trend-following approach using the Triple Exponential Moving Average (TEMA) with Overbought/Oversold (OBOS) indicator filtering.
By utilizing TEMA crossovers to determine trend direction and OBOS as a filter, it aims to improve entry precision.
This strategy can be applied to markets such as Forex, Stocks, and Crypto, and is particularly designed for mid-term timeframes (5-minute to 1-hour charts).
Strategy Objectives
Identify trend direction using TEMA
Use OBOS to filter out overbought/oversold conditions
Implement ATR-based dynamic risk management
Key Features
1. Trend Analysis Using TEMA
Uses crossover of short-term EMA (ema3) and long-term EMA (ema4) to determine entries.
ema4 acts as the primary trend filter.
2. Overbought/Oversold (OBOS) Filtering
Long Entry Condition: up > down (bullish trend confirmed)
Short Entry Condition: up < down (bearish trend confirmed)
Reduces unnecessary trades by filtering extreme market conditions.
3. ATR-Based Take Profit (TP) & Stop Loss (SL)
Adjustable ATR multiplier for TP/SL
Default settings:
TP = ATR × 5
SL = ATR × 2
Fully customizable risk parameters.
4. Customizable Parameters
TEMA Length (for trend calculation)
OBOS Length (for overbought/oversold detection)
Take Profit Multiplier
Stop Loss Multiplier
EMA Display (Enable/Disable TEMA lines)
Bar Color Change (Enable/Disable candle coloring)
Trading Rules
Long Entry (Buy Entry)
ema3 crosses above ema4 (Golden Cross)
OBOS indicator confirms up > down (bullish trend)
Execute a buy position
Short Entry (Sell Entry)
ema3 crosses below ema4 (Death Cross)
OBOS indicator confirms up < down (bearish trend)
Execute a sell position
Take Profit (TP)
Entry Price + (ATR × TP Multiplier) (Default: 5)
Stop Loss (SL)
Entry Price - (ATR × SL Multiplier) (Default: 2)
TP/SL settings are fully customizable to fine-tune risk management.
Risk Management Parameters
This strategy emphasizes proper position sizing and risk control to balance risk and return.
Trading Parameters & Considerations
Initial Account Balance: $7,000 (adjustable)
Base Currency: USD
Order Size: 10,000 USD
Pyramiding: 1
Trading Fees: $0.94 per trade
Long Position Margin: 50%
Short Position Margin: 50%
Total Trades (M5 Timeframe): 128
Deep Test Results (2024/11/01 - 2025/02/24)BTCUSD-5M
Total P&L:+1638.20USD
Max equity drawdown:694.78USD
Total trades:128
Profitable trades:44.53
Profit factor:1.45
These settings aim to protect capital while maintaining a balanced risk-reward approach.
Visual Support
TEMA Lines (Three EMAs)
Trend direction is indicated by color changes (Blue/Orange)
ema3 (short-term) and ema4 (long-term) crossover signals potential entries
OBOS Histogram
Green → Strong buying pressure
Red → Strong selling pressure
Blue → Possible trend reversal
Entry & Exit Markers
Blue Arrow → Long Entry Signal
Red Arrow → Short Entry Signal
Take Profit / Stop Loss levels displayed
Strategy Improvements & Uniqueness
This strategy is based on indicators developed by "l_lonthoff" and "jdmonto0", but has been significantly optimized for better entry accuracy, visual clarity, and risk management.
Enhanced Trend Identification with TEMA
Detects early trend reversals using ema3 & ema4 crossover
Reduces market noise for a smoother trend-following approach
Improved OBOS Filtering
Prevents excessive trading
Reduces unnecessary risk exposure
Dynamic Risk Management with ATR-Based TP/SL
Not a fixed value → TP/SL adjusts to market volatility
Fully customizable ATR multiplier settings
(Default: TP = ATR × 5, SL = ATR × 2)
Summary
The TEMA + OBOS Strategy is a simple yet powerful trading method that integrates trend analysis and oscillators.
TEMA for trend identification
OBOS for noise reduction & overbought/oversold filtering
ATR-based TP/SL settings for dynamic risk management
Before using this strategy, ensure thorough backtesting and demo trading to fine-tune parameters according to your trading style.
Non-Repainting Renko Emulation Strategy [PineIndicators]Introduction: The Repainting Problem in Renko Strategies
Renko charts are widely used in technical analysis for their ability to filter out market noise and emphasize price trends. Unlike traditional candlestick charts, which are based on fixed time intervals, Renko charts construct bricks only when price moves by a predefined amount. This makes them useful for trend identification while reducing small fluctuations.
However, Renko-based trading strategies often fail in live trading due to a fundamental issue: repainting .
Why Do Renko Strategies Repaint?
Most trading platforms, including TradingView, generate Renko charts retrospectively based on historical price data. This leads to the following issues:
Renko bricks can change or disappear when new data arrives.
Backtesting results do not reflect real market conditions. Strategies may appear highly profitable in backtests because historical data is recalculated with hindsight.
Live trading produces different results than backtesting. Traders cannot know in advance whether a new Renko brick will form until price moves far enough.
Objective of the Renko Emulator
This script simulates Renko behavior on a standard time-based chart without repainting. Instead of using TradingView’s built-in Renko charting, which recalculates past bricks, this approach ensures that once a Renko brick is formed, it remains unchanged .
Key benefits:
No past bricks are recalculated or removed.
Trading strategies can execute reliably without false signals.
Renko-based logic can be applied on a time-based chart.
How the Renko Emulator Works
1. Parameter Configuration & Initialization
The script defines key user inputs and variables:
brickSize : Defines the Renko brick size in price points, adjustable by the user.
renkoPrice : Stores the closing price of the last completed Renko brick.
prevRenkoPrice : Stores the price level of the previous Renko brick.
brickDir : Tracks the direction of Renko bricks (1 = up, -1 = down).
newBrick : A boolean flag that indicates whether a new Renko brick has been formed.
brickStart : Stores the bar index at which the current Renko brick started.
2. Identifying Renko Brick Formation Without Repainting
To ensure that the strategy does not repaint, Renko calculations are performed only on confirmed bars.
The script calculates the difference between the current price and the last Renko brick level.
If the absolute price difference meets or exceeds the brick size, a new Renko brick is formed.
The new Renko price level is updated based on the number of bricks that would fit within the price movement.
The direction (brickDir) is updated , and a flag ( newBrick ) is set to indicate that a new brick has been formed.
3. Visualizing Renko Bricks on a Time-Based Chart
Since TradingView does not support live Renko charts without repainting, the script uses graphical elements to draw Renko-style bricks on a standard chart.
Each time a new Renko brick forms, a colored rectangle (box) is drawn:
Green boxes → Represent bullish Renko bricks.
Red boxes → Represent bearish Renko bricks.
This allows traders to see Renko-like formations on a time-based chart, while ensuring that past bricks do not change.
Trading Strategy Implementation
Since the Renko emulator provides a stable price structure, it is possible to apply a consistent trading strategy that would otherwise fail on a traditional Renko chart.
1. Entry Conditions
A long trade is entered when:
The previous Renko brick was bearish .
The new Renko brick confirms an upward trend .
There is no existing long position .
A short trade is entered when:
The previous Renko brick was bullish .
The new Renko brick confirms a downward trend .
There is no existing short position .
2. Exit Conditions
Trades are closed when a trend reversal is detected:
Long trades are closed when a new bearish brick forms.
Short trades are closed when a new bullish brick forms.
Key Characteristics of This Approach
1. No Historical Recalculation
Once a Renko brick forms, it remains fixed and does not change.
Past price action does not shift based on future data.
2. Trading Strategies Operate Consistently
Since the Renko structure is stable, strategies can execute without unexpected changes in signals.
Live trading results align more closely with backtesting performance.
3. Allows Renko Analysis Without Switching Chart Types
Traders can apply Renko logic without leaving a standard time-based chart.
This enables integration with indicators that normally cannot be used on traditional Renko charts.
Considerations When Using This Strategy
Trade execution may be delayed compared to standard Renko charts. Since new bricks are only confirmed on closed bars, entries may occur slightly later.
Brick size selection is important. A smaller brickSize results in more frequent trades, while a larger brickSize reduces signals.
Conclusion
This Renko Emulation Strategy provides a method for using Renko-based trading strategies on a time-based chart without repainting. By ensuring that bricks do not change once formed, it allows traders to use stable Renko logic while avoiding the issues associated with traditional Renko charts.
This approach enables accurate backtesting and reliable live execution, making it suitable for trend-following and swing trading strategies that rely on Renko price action.

is_strategyCorrection-Adaptive Trend Strategy (Open-Source)
Core Advantage: Designed specifically for the is_correction indicator, with full transparency and customization options.
Key Features:
Open-Source Code:
✅ Full access to the strategy logic – study how every trade signal is generated.
✅ Freedom to customize – modify entry/exit rules, risk parameters, or add new indicators.
✅ No black boxes – understand and trust every decision the strategy makes.
Built for is_correction:
Filters out false signals during market noise.
Works only in confirmed trends (is_correction = false).
Adaptable for Your Needs:
Change Take Profit/Stop Loss ratios directly in the code.
Add alerts, notifications, or integrate with other tools (e.g., Volume Profile).
For Developers/Traders:
Use the code as a template for your own strategies.
Test modifications risk-free on historical data.
How the Strategy Works:
Main Goal:
Automatically buys when the price starts rising and sells when it starts falling, but only during confirmed trends (ignoring temporary pullbacks).
What You See on the Chart:
📈 Up arrows ▼ (below the candle) = Buy signal.
📉 Down arrows ▲ (above the candle) = Sell signal.
Gray background = Market is in a correction (no trades).
Key Mechanics:
Buy Condition:
Price closes higher than the previous candle + is_correction confirms the main trend (not a pullback).
Example: Red candle → green candle → ▼ arrow → buy.
Sell Condition:
Price closes lower than the previous candle + is_correction confirms the trend (optional: turn off short-selling in settings).
Exit Rules:
Closes trades automatically at:
+0.5% profit (adjustable in settings).
-0.5% loss (adjustable).
Or if a reverse signal appears (e.g., sell signal after a buy).
User-Friendly Settings:
Sell – On (default: ON):
ON → Allows short-selling (selling when price falls).
OFF → Strategy only buys and closes positions.
Revers (default: OFF):
ON → Inverts signals (▼ = sell, ▲ = buy).
%Profit & %Loss:
Adjust these values (0-30%) to increase/decrease profit targets and risk.
Example Scenario:
Buy Signal:
Price rises for 3 days → green ▼ arrow → strategy buys.
Stop loss set 0.5% below entry price.
If price keeps rising → trade closes at +0.5% profit.
Correction Phase:
After a rally, price drops for 1 day → gray background → strategy ignores the drop (no action).
Stop Loss Trigger:
If price drops 0.5% from entry → trade closes automatically.
Key Features:
Correction Filter (is_correction):
Acts as a “noise filter” → avoids trades during temporary pullbacks.
Flexibility:
Disable short-selling, flip signals, or tweak profit/loss levels in seconds.
Transparency:
Open-source code → see exactly how every signal is generated (click “Source” in TradingView).
Tips for Beginners:
Test First:
Run the strategy on historical data (click the “Chart” icon in TradingView).
See how it performed in the past.
Customize It:
Increase %Profit to 2-3% for volatile assets like crypto.
Turn off Sell – On if short-selling confuses you.
Trust the Stop Loss:
Even if you think the price will rebound, the strategy will close at -0.5% to protect your capital.
Where to Find Settings:
Click the strategy name on the top-left of your chart → adjust sliders/toggles in the menu.
Русская Версия
Трендовая стратегия с открытым кодом
Главное преимущество: Полная прозрачность логики и адаптация под ваши нужды.
Особенности:
Открытый исходный код:
✅ Видите всю «кухню» стратегии – как формируются сигналы, когда открываются сделки.
✅ Меняйте правила – корректируйте тейк-профит, стоп-лосс или добавляйте новые условия.
✅ Никаких секретов – вы контролируете каждое правило.
Заточка под is_correction:
Игнорирует ложные сигналы в коррекциях.
Работает только в сильных трендах (is_correction = false).
Гибкая настройка:
Подстройте параметры под свой риск-менеджмент.
Добавьте свои индикаторы или условия для входа.
Для трейдеров и разработчиков:
Используйте код как основу для своих стратегий.
Тестируйте изменения на истории перед реальной торговлей.
Простыми словами:
Почему это удобно:
Открытый код = полный контроль. Вы можете:
Увидеть, как именно стратегия решает купить или продать.
Изменить правила закрытия сделок (например, поставить TP=2% вместо 1.5%).
Добавить новые условия (например, торговать только при высоком объёме).
Примеры кастомизации:
Новички: Меняйте только TP/SL в настройках (без кодинга).
Продвинутые: Добавьте RSI-фильтр, чтобы избегать перекупленности.
Разработчики: Встройте стратегию в свою торговую систему.
Как начать:
Скачайте код из TradingView.
Изучите логику в разделе strategy.entry/exit.
Меняйте параметры в блоке input.* (безопасно!).
Тестируйте изменения и оптимизируйте под свои цели.
Как работает стратегия:
Главная задача:
Автоматически покупает, когда цена начинает расти, и продаёт, когда падает. Но делает это «умно» — только когда рынок в основном тренде, а не во временном откате (коррекции).
Что видно на графике:
📈 Стрелки вверх ▼ (под свечой) — сигнал на покупку.
📉 Стрелки вниз ▲ (над свечой) — сигнал на продажу.
Серый фон — рынок в коррекции (не торгуем).
Как это работает:
Когда покупаем:
Если цена закрылась выше предыдущей и индикатор is_correction показывает «основной тренд» (не коррекция).
Пример: Была красная свеча → стала зелёная → появилась стрелка ▼ → покупаем.
Когда продаём:
Если цена закрылась ниже предыдущей и is_correction подтверждает тренд (опционально, можно отключить в настройках).
Когда закрываем сделку:
Автоматически при достижении:
+0.5% прибыли (можно изменить в настройках).
-0.5% убытка (можно изменить).
Или если появился противоположный сигнал (например, после покупки пришла стрелка продажи).
Настройки для чайников:
«Sell – On» (включено по умолчанию):
Если включено → стратегия будет продавать в шорт.
Если выключено → только покупки и закрытие позиций.
«Revers» (выключено по умолчанию):
Если включить → стратегия будет работать наоборот (стрелки ▼ = продажа, ▲ = покупка).
«%Profit» и «%Loss»:
Меняйте эти цифры (от 0 до 30), чтобы увеличить/уменьшить прибыль и риски.
Пример работы:
Сигнал на покупку:
Цена 3 дня растет → появляется зелёная стрелка ▼ → стратегия покупает.
Стоп-лосс ставится на 0.5% ниже цены входа.
Если цена продолжает расти → сделка закрывается при +0.5% прибыли.
Коррекция:
После роста цена падает на 1 день → фон становится серым → стратегия игнорирует это падение (не закрывает сделку).
Стоп-лосс:
Если цена упала на 0.5% от точки входа → сделка закрывается автоматически.
Важные особенности:
Фильтр коррекций (is_correction):
Это «защита от шума» — стратегия не реагирует на мелкие откаты, работая только в сильных трендах.
Гибкие настройки:
Можно запретить шорты, перевернуть сигналы или изменить уровни прибыли/убытка за 2 клика.
Прозрачность:
Весь код открыт → вы можете увидеть, как формируется каждый сигнал (меню «Исходник» в TradingView).
Советы для новичков:
Начните с теста:
Запустите стратегию на исторических данных (кнопка «Свеча» в окне TradingView).
Посмотрите, как она работала в прошлом.
Настройте под себя:
Увеличьте %Profit до 2-3%, если торгуете валюты.
Отключите «Sell – On», если не понимаете шорты.
Доверяйте стоп-лоссу:
Даже если кажется, что цена развернётся — стратегия закроет сделку при -0.5%, защитив ваш депозит.
Где найти настройки:
Кликните на название стратегии в верхнем левом углу графика → откроется меню с ползунками и переключателями.
Важно: Стратегия предоставляет «рыбу» – чтобы она стала «уловистой», адаптируйте её под свой стиль торговли!

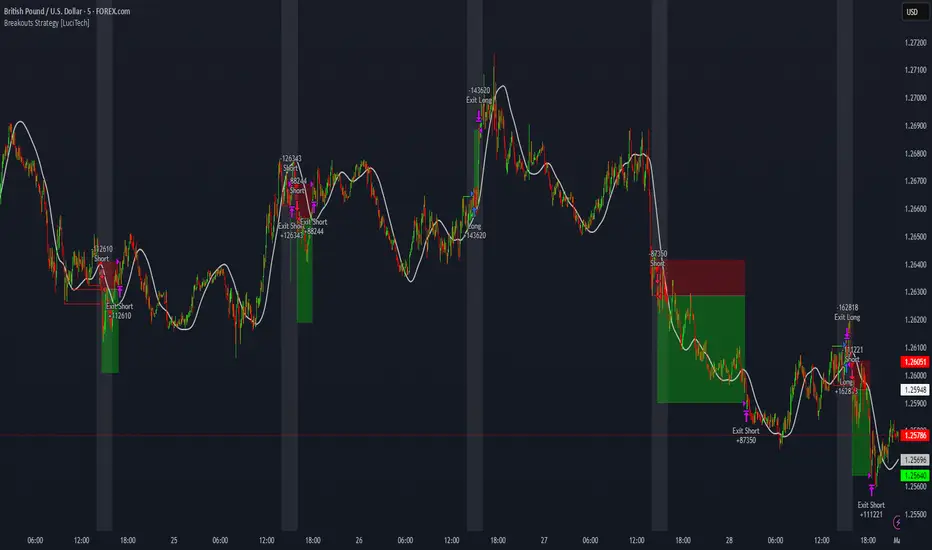
Breakouts With Timefilter Strategy [LuciTech]This strategy captures breakout opportunities using pivot high/low breakouts while managing risk through dynamic stop-loss placement and position sizing. It includes a time filter to limit trades to specific sessions.
How It Works
A long trade is triggered when price closes above a pivot high, and a short trade when price closes below a pivot low.
Stop-loss can be set using ATR, prior candle high/low, or a fixed point value. Take-profit is based on a risk-reward multiplier.
Position size adjusts based on the percentage of equity risked.
Breakout signals are marked with triangles, and entry, stop-loss, and take-profit levels are plotted.
moving average filter: Bullish breakouts only trigger above the MA, bearish breakouts below.
The time filter shades the background during active trading hours.
Customization:
Adjustable pivot length for breakout sensitivity.
Risk settings: percentage risked, risk-reward ratio, and stop-loss type.
ATR settings: length, smoothing method (RMA, SMA, EMA, WMA).
Moving average filter (SMA, EMA, WMA, VWMA, HMA) to confirm breakouts.
ADX for BTC [PineIndicators]The ADX Strategy for BTC is a trend-following system that uses the Average Directional Index (ADX) to determine market strength and momentum shifts. Designed for Bitcoin trading, this strategy applies a customizable ADX threshold to confirm trend signals and optionally filters entries using a Simple Moving Average (SMA). The system features automated entry and exit conditions, dynamic trade visualization, and built-in trade tracking for historical performance analysis.
⚙️ Core Strategy Components
1️⃣ Average Directional Index (ADX) Calculation
The ADX indicator measures trend strength without indicating direction. It is derived from the Positive Directional Movement (+DI) and Negative Directional Movement (-DI):
+DI (Positive Directional Index): Measures upward price movement.
-DI (Negative Directional Index): Measures downward price movement.
ADX Value: Higher values indicate stronger trends, regardless of direction.
This strategy uses a default ADX length of 14 to smooth out short-term fluctuations while detecting sustainable trends.
2️⃣ SMA Filter (Optional Trend Confirmation)
The strategy includes a 200-period SMA filter to validate trend direction before entering trades. If enabled:
✅ Long Entry is only allowed when price is above a long-term SMA multiplier (5x the standard SMA length).
✅ If disabled, the strategy only considers the ADX crossover threshold for trade entries.
This filter helps reduce entries in sideways or weak-trend conditions, improving signal reliability.
📌 Trade Logic & Conditions
🔹 Long Entry Conditions
A buy signal is triggered when:
✅ ADX crosses above the threshold (default = 14), indicating a strengthening trend.
✅ (If SMA filter is enabled) Price is above the long-term SMA multiplier.
🔻 Exit Conditions
A position is closed when:
✅ ADX crosses below the stop threshold (default = 45), signaling trend weakening.
By adjusting the entry and exit ADX levels, traders can fine-tune sensitivity to trend changes.
📏 Trade Visualization & Tracking
Trade Markers
"Buy" label (▲) appears when a long position is opened.
"Close" label (▼) appears when a position is exited.
Trade History Boxes
Green if a trade is profitable.
Red if a trade closes at a loss.
Trend Tracking Lines
Horizontal lines mark entry and exit prices.
A filled trade box visually represents trade duration and profitability.
These elements provide clear visual insights into trade execution and performance.
⚡ How to Use This Strategy
1️⃣ Apply the script to a BTC chart in TradingView.
2️⃣ Adjust ADX entry/exit levels based on trend sensitivity.
3️⃣ Enable or disable the SMA filter for trend confirmation.
4️⃣ Backtest performance to analyze historical trade execution.
5️⃣ Monitor trade markers and history boxes for real-time trend insights.
This strategy is designed for trend traders looking to capture high-momentum market conditions while filtering out weak trends.

MACD Volume Strategy for XAUUSD (15m) [PineIndicators]The MACD Volume Strategy is a momentum-based trading system designed for XAUUSD on the 15-minute timeframe. It integrates two key market indicators: the Moving Average Convergence Divergence (MACD) and a volume-based oscillator to identify strong trend shifts and confirm trade opportunities. This strategy uses dynamic position sizing, incorporates leverage customization, and applies structured entry and exit conditions to improve risk management.
⚙️ Core Strategy Components
1️⃣ Volume-Based Momentum Calculation
The strategy includes a custom volume oscillator to filter trade signals based on market activity. The oscillator is derived from the difference between short-term and long-term volume trends using Exponential Moving Averages (EMAs)
Short EMA (default = 5) represents recent volume activity.
Long EMA (default = 8) captures broader volume trends.
Positive values indicate rising volume, supporting momentum-based trades.
Negative values suggest weak market activity, reducing signal reliability.
By requiring positive oscillator values, the strategy ensures momentum confirmation before entering trades.
2️⃣ MACD Trend Confirmation
The strategy uses the MACD indicator as a trend filter. The MACD is calculated as:
Fast EMA (16-period) detects short-term price trends.
Slow EMA (26-period) smooths out price fluctuations to define the overall trend.
Signal Line (9-period EMA) helps identify crossovers, signaling potential trend shifts.
Histogram (MACD – Signal) visualizes trend strength.
The system generates trade signals based on MACD crossovers around the zero line, confirming bullish or bearish trend shifts.
📌 Trade Logic & Conditions
🔹 Long Entry Conditions
A buy signal is triggered when all the following conditions are met:
✅ MACD crosses above 0, signaling bullish momentum.
✅ Volume oscillator is positive, confirming increased trading activity.
✅ Current volume is at least 50% of the previous candle’s volume, ensuring market participation.
🔻 Short Entry Conditions
A sell signal is generated when:
✅ MACD crosses below 0, indicating bearish momentum.
✅ Volume oscillator is positive, ensuring market activity is sufficient.
✅ Current volume is less than 50% of the previous candle’s volume, showing decreasing participation.
This multi-factor approach filters out weak or false signals, ensuring that trades align with both momentum and volume dynamics.
📏 Position Sizing & Leverage
Dynamic Position Calculation:
Qty = strategy.equity × leverage / close price
Leverage: Customizable (default = 1x), allowing traders to adjust risk exposure.
Adaptive Sizing: The strategy scales position sizes based on account equity and market price.
Slippage & Commission: Built-in slippage (2 points) and commission (0.01%) settings provide realistic backtesting results.
This ensures efficient capital allocation, preventing overexposure in volatile conditions.
🎯 Trade Management & Exits
Take Profit & Stop Loss Mechanism
Each position includes predefined profit and loss targets:
Take Profit: +10% of risk amount.
Stop Loss: Fixed at 10,100 points.
The risk-reward ratio remains balanced, aiming for controlled drawdowns while maximizing trade potential.
Visual Trade Tracking
To improve trade analysis, the strategy includes:
📌 Trade Markers:
"Buy" label when a long position opens.
"Close" label when a position exits.
📌 Trade History Boxes:
Green for profitable trades.
Red for losing trades.
📌 Horizontal Trade Lines:
Shows entry and exit prices.
Helps identify trend movements over multiple trades.
This structured visualization allows traders to analyze past performance directly on the chart.
⚡ How to Use This Strategy
1️⃣ Apply the script to a XAUUSD (Gold) 15m chart in TradingView.
2️⃣ Adjust leverage settings as needed.
3️⃣ Enable backtesting to assess past performance.
4️⃣ Monitor volume and MACD conditions to understand trade triggers.
5️⃣ Use the visual trade markers to review historical performance.
The MACD Volume Strategy is designed for short-term trading, aiming to capture momentum-driven opportunities while filtering out weak signals using volume confirmation.

Balance of Power for US30 4H [PineIndicators]The Balance of Power (BoP) Strategy is a momentum-based trading system for the US30 index on a 4-hour timeframe. It measures the strength of buyers versus sellers in each candle using the Balance of Power (BoP) indicator and executes trades based on predefined threshold crossovers. The strategy includes dynamic position sizing, adjustable leverage, and visual trade tracking.
⚙️ Core Strategy Mechanics
Positive values indicate buying strength.
Negative values indicate selling strength.
Values close to 1 suggest strong bullish momentum.
Values close to -1 indicate strong bearish pressure.
The strategy uses fixed threshold crossovers to determine trade entries and exits.
📌 Trade Logic
Entry Conditions
Long Entry: When BoP crosses above 0.8, signaling strong buying pressure.
Exit Conditions
Position Close: When BoP crosses below -0.8, indicating a shift to selling pressure.
This threshold-based system filters out low-confidence signals and focuses on high-momentum shifts.
📏 Position Sizing & Leverage
Leverage: Adjustable by the user (default = 5x).
Risk Management: Position size adapts dynamically based on equity fluctuations.
📊 Trade Visualization & History Tracking
Trade Markers:
"Buy" labels appear when a long position is opened.
"Close" labels appear when a position is exited.
Trade History Boxes:
Green for profitable trades.
Red for losing trades.
These elements provide clear visual tracking of past trade execution.
⚡ Usage & Customization
1️⃣ Apply the script to a US30 4H chart in TradingView.
2️⃣ Adjust leverage settings as needed.
3️⃣ Review trade signals and historical performance with visual markers.
4️⃣ Enable backtesting to evaluate past performance.
This strategy is designed for momentum-based trading and is best suited for volatile market conditions.
TSI Long/Short for BTC 2HThe TSI Long/Short for BTC 2H strategy is an advanced trend-following system designed specifically for trading Bitcoin (BTC) on a 2-hour timeframe. It leverages the True Strength Index (TSI) to identify momentum shifts and executes both long and short trades in response to dynamic market conditions.
Unlike traditional moving average-based strategies, this script uses a double-smoothed momentum calculation, enhancing signal accuracy and reducing noise. It incorporates automated position sizing, customizable leverage, and real-time performance tracking, ensuring a structured and adaptable trading approach.
🔹 What Makes This Strategy Unique?
Unlike simple crossover strategies or generic trend-following approaches, this system utilizes a customized True Strength Index (TSI) methodology that dynamically adjusts to market conditions.
🔸 True Strength Index (TSI) Filtering – The script refines the TSI by applying double exponential smoothing, filtering out weak signals and capturing high-confidence momentum shifts.
🔸 Adaptive Entry & Exit Logic – Instead of fixed thresholds, it compares the TSI value against a dynamically determined high/low range from the past 100 bars to confirm trade signals.
🔸 Leverage & Risk Optimization – Position sizing is dynamically adjusted based on account equity and leverage settings, ensuring controlled risk exposure.
🔸 Performance Monitoring System – A built-in performance tracking table allows traders to evaluate monthly and yearly results directly on the chart.
📊 Core Strategy Components
1️⃣ Momentum-Based Trade Execution
The strategy generates long and short trade signals based on the following conditions:
✅ Long Entry Condition – A buy signal is triggered when the TSI crosses above its 100-bar highest value (previously set), confirming bullish momentum.
✅ Short Entry Condition – A sell signal is generated when the TSI crosses below its 100-bar lowest value (previously set), indicating bearish pressure.
Each trade execution is fully automated, reducing emotional decision-making and improving trading discipline.
2️⃣ Position Sizing & Leverage Control
Risk management is a key focus of this strategy:
🔹 Dynamic Position Sizing – The script calculates position size based on:
Account Equity – Ensuring trade sizes adjust dynamically with capital fluctuations.
Leverage Multiplier – Allows traders to customize risk exposure via an adjustable leverage setting.
🔹 No Fixed Stop-Loss – The strategy relies on reversals to exit trades, meaning each position is closed when the opposite signal appears.
This design ensures maximum capital efficiency while adapting to market conditions in real time.
3️⃣ Performance Visualization & Tracking
Understanding historical performance is crucial for refining strategies. The script includes:
📌 Real-Time Trade Markers – Buy and sell signals are visually displayed on the chart for easy reference.
📌 Performance Metrics Table – Tracks monthly and yearly returns in percentage form, helping traders assess profitability over time.
📌 Trade History Visualization – Completed trades are displayed with color-coded boxes (green for long trades, red for short trades), visually representing profit/loss dynamics.
📢 Why Use This Strategy?
✔ Advanced Momentum Detection – Uses a double-smoothed TSI for more accurate trend signals.
✔ Fully Automated Trading – Removes emotional bias and enforces discipline.
✔ Customizable Risk Management – Adjust leverage and position sizing to suit your risk profile.
✔ Comprehensive Performance Tracking – Integrated reporting system provides clear insights into past trades.
This strategy is ideal for Bitcoin traders looking for a structured, high-probability system that adapts to both bullish and bearish trends on the 2-hour timeframe.
📌 How to Use: Simply add the script to your 2H BTC chart, configure your leverage settings, and let the system handle trade execution and tracking! 🚀

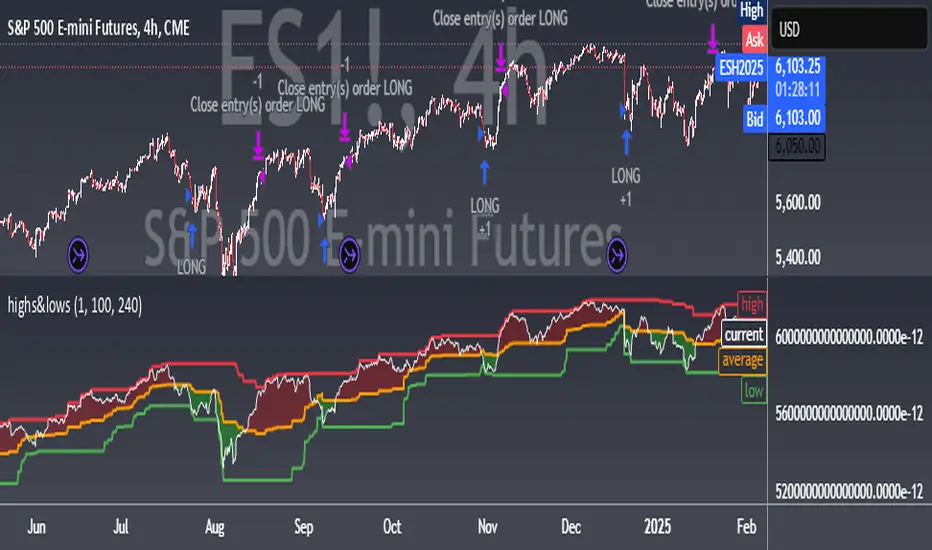
highs&lowsone of my first strategy: highs&lows
This strategy takes the highest high and the lowest low of a specified timeframe and specified bar count.
It will then takes the average between these two extremes to create a center line.
This creates a range of high middle and low.
Then the strategy takes the current market movement
which is the direct average(no specified timeframe and specified bar count) of the current high and low.
Using this "current market movement" within the range of high middle and low it determins when to buy and then sell the asset.
*********note***************
-this strategy is (bullish)
-works good with most futures assets that have volatility/ decent movement
(might add more details if I forget any)
(work in progress)
Son Model ICT [TradingFinder] HTF DOL H1 + Sweep M15 + FVG M1🔵 Introduction
The ICT Son Model setup is a precise trading strategy based on market structure and liquidity, implemented across multiple timeframes. This setup first identifies a liquidity level in the 1-hour (1H) timeframe and then confirms a Market Structure Shift (MSS) in the 5-minute (5M) timeframe to validate the trend. After confirmation, the price forms a new swing in the 5-minute timeframe, absorbing liquidity.
Once this level is broken, traders typically drop to the 30-second (30s) timeframe and enter trades based on a Fair Value Gap (FVG). However, since access to the 30-second timeframe is not available to most traders, we take the entry signal directly from the 5-minute timeframe, using the same liquidity zones and confirmed breakouts to execute trades. This approach simplifies execution and makes the strategy accessible to all traders.
This model operates in two setups :
Bullish ICT Son Model and Bearish ICT Son Model. In the bullish setup, liquidity is first accumulated at the lows of the 1-hour timeframe, and after confirming a market structure shift, a long position is initiated. Conversely, in the bearish setup, liquidity is first drawn from higher levels, and upon confirmation of a bearish trend, a short position is executed.
Bullish Setup :
Bearish Setup :
🔵 How to Use
The ICT Son Model setup is designed around liquidity analysis and market structure shifts and can be applied in both bullish and bearish market conditions. The strategy first identifies a liquidity level in the 1-hour (1H) timeframe and then confirms a Market Structure Shift (MSS) in the 5-minute (5M) timeframe.
After this shift, the price forms a new swing, absorbing liquidity. When this level is broken in the 5-minute timeframe, the trader enters based on a Fair Value Gap (FVG). While the ideal entry is in the 30-second (30s) timeframe, due to accessibility constraints, we take entry signals directly from the 5-minute timeframe.
🟣 Bullish Setup
In the Bullish ICT Son Model, the 1-hour timeframe first identifies liquidity at the market lows, where price sweeps this level to absorb liquidity. Then, in the 5-minute timeframe, an MSS confirms the bullish shift.
After confirmation, the price forms a new swing, absorbing liquidity at a higher level. The price then retraces into a Fair Value Gap (FVG) created in the 5-minute timeframe, where the trader enters a long position, placing the stop-loss below the FVG.
🟣 Bearish Setup
In the Bearish ICT Son Model, liquidity at higher market levels is identified in the 1-hour timeframe, where price sweeps these levels to absorb liquidity. Then, in the 5-minute timeframe, an MSS confirms the bearish trend.
After confirmation, the price forms a new swing, absorbing liquidity at a lower level. The price then retraces into a Fair Value Gap (FVG) created in the 5-minute timeframe, where the trader enters a short position, placing the stop-loss above the FVG.
🔵 Settings
Swing period : You can set the swing detection period.
Max Swing Back Method : It is in two modes "All" and "Custom". If it is in "All" mode, it will check all swings, and if it is in "Custom" mode, it will check the swings to the extent you determine.
Max Swing Back : You can set the number of swings that will go back for checking.
FVG Length : Default is 120 Bar.
MSS Length : Default is 80 Bar.
FVG Filter : This refines the number of identified FVG areas based on a specified algorithm to focus on higher quality signals and reduce noise.
Types of FVG filters :
Very Aggressive Filter: Adds a condition where, for an upward FVG, the last candle's highest price must exceed the middle candle's highest price, and for a downward FVG, the last candle's lowest price must be lower than the middle candle's lowest price. This minimally filters out FVGs.
Aggressive Filter: Builds on the Very Aggressive mode by ensuring the middle candle is not too small, filtering out more FVGs.
Defensive Filter: Adds criteria regarding the size and structure of the middle candle, requiring it to have a substantial body and specific polarity conditions, filtering out a significant number of FVGs.
Very Defensive Filter: Further refines filtering by ensuring the first and third candles are not small-bodied doji candles, retaining only the highest quality signals.
🔵 Conclusion
The ICT Son Model setup is a structured and precise method for trade execution based on liquidity analysis and market structure shifts. This strategy first identifies a liquidity level in the 1-hour timeframe and then confirms a trend shift using the 5-minute timeframe.
Trade entries are executed based on Fair Value Gaps (FVGs), which highlight optimal entry points. By applying this model, traders can leverage existing market liquidity to enter high-probability trades. The bullish setup activates when liquidity is swept from market lows and a market structure shift confirms an upward trend, whereas the bearish setup is used when liquidity is drawn from market highs, confirming a downtrend.
This approach enables traders to identify high-probability trade setups with greater precision compared to many other strategies. Additionally, since access to the 30-second timeframe is limited, the strategy remains fully functional in the 5-minute timeframe, making it more practical and accessible for a wider range of traders.

3x Supertrend (for Vietnamese stock market and vn30f1m)The 4Vietnamese 3x Supertrend Strategy is an advanced trend-following trading system developed in Pine Script™ and designed for publication on TradingView as an open-source strategy under the Mozilla Public License 2.0. This strategy leverages three Supertrend indicators with different ATR lengths and multipliers to identify optimal trade entries and exits while dynamically managing risk.
Key Features:
Option to build and hold long term positions with entry stop order. Try this to avoid market complex movement and retain long term investment style's benefits.
Advanced Entry & Exit Optimization: Includes configurable stop-loss mechanisms, pyramiding, and exit conditions tailored for different market scenarios.
Dynamic Risk Management: Implements features like selective stop-loss activation, trade window settings, and closing conditions based on trend reversals and loss management.
This strategy is particularly suited for traders seeking a systematic and rule-based approach to trend trading. By making it open-source, we aim to provide transparency, encourage community collaboration, and help traders refine and optimize their strategies for better performance.
License:
This script is released under the Mozilla Public License 2.0, allowing modifications and redistribution while maintaining open-source integrity.
Happy trading!
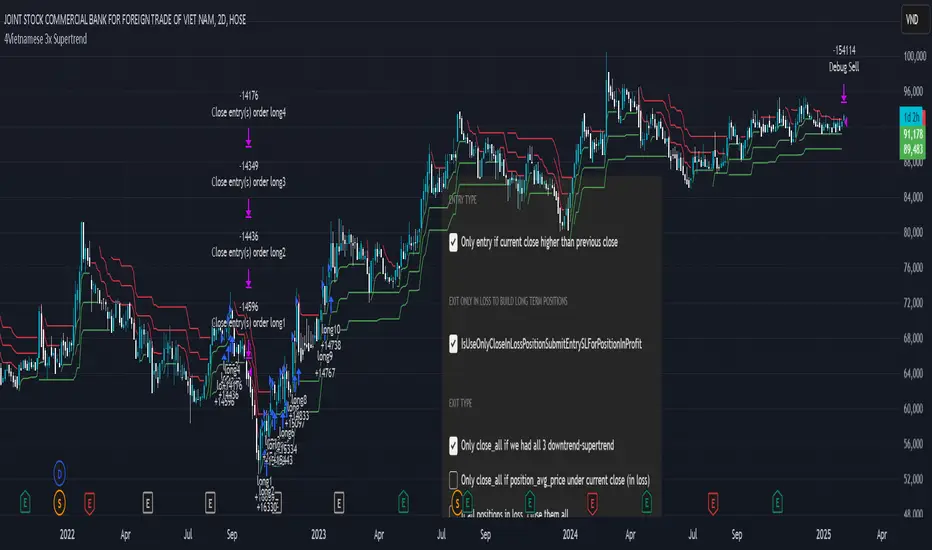
Twitter Model ICT [TradingFinder] MMXM ERL D + FVG + M15 MSS/SMT🔵 Introduction
The Twitter Model ICT is a trading approach based on ICT (Inner Circle Trader) models, focusing on price movement between external and internal liquidity in lower timeframes. This model integrates key concepts such as Market Structure Shift (MSS), Smart Money Technique (SMT) divergence, and CISD level break to identify precise entry points in the market.
The primary goal of this model is to determine key liquidity levels, such as the previous day’s high and low (PDH/PDL) and align them with the Fair Value Gap (FVG) in the 1-hour timeframe. The overall strategy involves framing trades around the 1H FVG and using the M15 Market Structure Shift (MSS) for entry confirmation.
The Twitter Model ICT is designed to utilize external liquidity levels, such as PDH/PDL, as key entry zones. The model identifies FVG in the 1-hour timeframe, which acts as a magnet for price movement. Additionally, traders confirm entries using M15 Market Structure Shift (MSS) and SMT divergence.
Bullish Twitter Model :
In a bullish setup, the price sweeps the previous day’s low (PDL), and after confirming reversal signals, buys are executed in internal liquidity zones. Conversely, in a bearish setup, the price sweeps the previous day’s high (PDH), and after confirming weakness signals, sells are executed.
Bearish Twitter Model :
In short setups, entries are only executed above the Midnight Open, while in long setups, entries are taken below the Midnight Open. Adhering to these principles allows traders to define precise entry and exit points and analyze price movement with greater accuracy based on liquidity and market structure.
🔵 How to Use
The Twitter Model ICT is a liquidity-based trading strategy that analyzes price movements relative to the previous day’s high and low (PDH/PDL) and Fair Value Gap (FVG). This model is applicable in both bullish and bearish directions and utilizes the 1-hour (1H) and 15-minute (M15) timeframes for entry confirmation.
The price first sweeps an external liquidity level (PDH or PDL) and then provides an entry opportunity based on Market Structure Shift (MSS) and SMT divergence. Additionally, the entry should be positioned relative to the Midnight Open, meaning long entries should occur below the Midnight Open and short entries above it.
🟣 Bullish Twitter Model
In a bullish setup, the price first sweeps the previous day’s low (PDL) and reaches an external liquidity level. Then, in the 1-hour timeframe (1H), a bullish Fair Value Gap (FVG) forms, which serves as the price target.
To confirm the entry, a Market Structure Shift (MSS) in the 15-minute timeframe (M15) should be observed, signaling a trend reversal to the upside. Additionally, SMT divergence with correlated assets can indicate weakness in selling pressure.
Under these conditions, a long position is taken below the Midnight Open, with a stop-loss placed at the lowest point of the recent bearish move. The price target for this trade is the FVG in the 1-hour timeframe.
🟣 Bearish Twitter Model
In a bearish setup, the price first sweeps the previous day’s high (PDH) and reaches an external liquidity level. Then, in the 1-hour timeframe (1H), a bearish Fair Value Gap (FVG) is identified, serving as the trade target.
To confirm entry, a Market Structure Shift (MSS) in the 15-minute timeframe (M15) should form, signaling a trend shift to the downside. If an SMT divergence is present, it can provide additional confirmation for the trade.
Once these conditions are met, a short position is taken above the Midnight Open, with a stop-loss placed at the highest level of the recent bullish move. The trade's price target is the FVG in the 1-hour timeframe.
🔵 Settings
Bar Back Check : Determining the return of candles to identify the CISD level.
CISD Level Validity : CISD level validity period based on the number of candles.
Daily Position : Determines whether only the first signal of the day is considered or if signals are evaluated throughout the entire day.
Session : Specifies in which trading sessions the indicator will be active.
Second Symbol : This setting allows you to select another asset for comparison with the primary asset. By default, "XAUUSD" (Gold) is set as the second symbol, but you can change it to any currency pair, stock, or cryptocurrency. For example, you can choose currency pairs like EUR/USD or GBP/USD to identify divergences between these two assets.
Divergence Fractal Periods : This parameter defines the number of past candles to consider when identifying divergences. The default value is 2, but you can change it to suit your preferences. This setting allows you to detect divergences more accurately by selecting a greater number of candles.
The indicator allows displaying sessions based on various time zones. The user can select one of the following options :
UTC (Coordinated Universal Time)
Local Time of the Session
User’s Local Time
Show Open Price : Displays the New York market opening price.
Show PDH / PDL : Displays the previous day’s high and low to identify potential entry points.
Show SMT Divergence : Displays lines and labels for bullish ("+SMT") and bearish ("-SMT") divergences.
🔵 Conclusion
The Twitter Model ICT is an effective approach for analyzing and executing trades in financial markets, utilizing a combination of liquidity principles, market structure, and SMT confirmations to identify optimal entry and exit points.
By analyzing the previous day’s high and low (PDH/PDL), Fair Value Gaps (FVG), and Market Structure Shift (MSS) in the 1H and M15 timeframes, traders can pinpoint liquidity-driven trade opportunities. Additionally, considering the Midnight Open level helps traders avoid random entries and ensures better trade placement.
By applying this model, traders can interpret market movements based on liquidity flow and structural changes, allowing them to fine-tune their trading decisions with higher precision. Ultimately, the Twitter Model ICT provides a structured and logical approach for traders who seek to trade based on liquidity behavior and trend shifts in the market.

Statistical Arbitrage Pairs Trading - Long-Side OnlyThis strategy implements a simplified statistical arbitrage (" stat arb ") approach focused on mean reversion between two correlated instruments. It identifies opportunities where the spread between their normalized price series (Z-scores) deviates significantly from historical norms, then executes long-only trades anticipating reversion to the mean.
Key Mechanics:
1. Spread Calculation: The strategy computes Z-scores for both instruments to normalize price movements, then tracks the spread between these Z-scores.
2. Modified Z-Score: Uses a robust measure combining the median and Median Absolute Deviation (MAD) to reduce outlier sensitivity.
3. Entry Signal: A long position is triggered when the spread’s modified Z-score falls below a user-defined threshold (e.g., -1.0), indicating extreme undervaluation of the main instrument relative to its pair.
4. Exit Signal: The position closes automatically when the spread reverts to its historical mean (Z-score ≥ 0).
Risk management:
Trades are sized as a percentage of equity (default: 10%).
Includes commissions and slippage for realistic backtesting.

Tutorial - Adding sessions to strategiesA simple script to illustrate how to add sessions to trading strategies.
In this interactive tutorial, you'll learn how to add trading sessions to your strategies using Pine Script. By the end of this session (pun intended!), you'll be able to create custom trading windows that adapt to changing market conditions.
What You'll Learn:
Defining Trading Sessions: Understand how to set up specific time frames for buying and selling, tailored to your unique trading style.
RSI-Based Entry Signals: Discover how to use the Relative Strength Index (RSI) as a trigger for buy and sell signals, helping you capitalize on market trends.
Combining Session Logic with Trading Decisions: Learn how to integrate session-based logic into your strategy, ensuring that trades are executed only during designated times.
By combining these elements, we create an interactive strategy that:
1. Generates buy and sell signals based on RSI levels.
2. Checks if the market is open during a specific trading session (e.g., 1300-1700).
3. Executes trades only when both conditions are met.
**Tips & Variations:**
* Experiment with different RSI periods, thresholds, and sessions to optimize your strategy for various markets and time frames.
* Consider adding more advanced logic, such as stop-losses or position sizing, to further refine your trading approach.
Get ready to take your Pine Script skills to the next level!
~Description partially generated with Llama3_8B

QT RSI [ W.ARITAS ]The QT RSI is an innovative technical analysis indicator designed to enhance precision in market trend identification and decision-making. Developed using advanced concepts in quantum mechanics, machine learning (LSTM), and signal processing, this indicator provides actionable insights for traders across multiple asset classes, including stocks, crypto, and forex.
Key Features:
Dynamic Color Gradient: Visualizes market conditions for intuitive interpretation:
Green: Strong buy signal indicating bullish momentum.
Blue: Neutral or observation zone, suggesting caution or lack of a clear trend.
Red: Strong sell signal indicating bearish momentum.
Quantum-Enhanced RSI: Integrates adaptive energy levels, dynamic smoothing, and quantum oscillators for precise trend detection.
Hybrid Machine Learning Model: Combines LSTM neural networks and wavelet transforms for accurate prediction and signal refinement.
Customizable Settings: Includes advanced parameters for dynamic thresholds, sensitivity adjustment, and noise reduction using Kalman and Jurik filters.
How to Use:
Interpret the Color Gradient:
Green Zone: Indicates bullish conditions and potential buy opportunities. Look for upward momentum in the RSI plot.
Blue Zone: Represents a neutral or consolidation phase. Monitor the market for trend confirmation.
Red Zone: Indicates bearish conditions and potential sell opportunities. Look for downward momentum in the RSI plot.
Follow Overbought/Oversold Boundaries:
Use the upper and lower RSI boundaries to identify overbought and oversold conditions.
Leverage Advanced Filtering:
The smoothed signals and quantum oscillator provide a robust framework for filtering false signals, making it suitable for volatile markets.
Application: Ideal for traders and analysts seeking high-precision tools for:
Identifying entry and exit points.
Detecting market reversals and momentum shifts.
Enhancing algorithmic trading strategies with cutting-edge analytics.
