Advanced Momentum Scanner [QuantAlgo]Introducing the Advanced Momentum Scanner by QuantAlgo , a sophisticated technical indicator that leverages multiple EMA combinations, momentum metrics, and adaptive visualization techniques to provide deep insights into market trends and momentum shifts. It is particularly valuable for those looking to identify high-probability trading and investing opportunities based on trend changes and momentum shifts across any market and timeframe.
🟢 Technical Foundation
The Advanced Momentum Scanner utilizes sophisticated trend analysis techniques to identify market momentum and trend direction. The core strategy employs a multi-layered approach with four different EMA periods:
Ultra-Fast EMA for quick trend changes detection
Fast EMA for short-term trend analysis
Mid EMA for intermediate confirmation
Slow EMA for long-term trend identification
For momentum detection, the indicator implements a Rate of Change (RoC) calculation to measure price momentum over a specified period. It further enhances analysis by incorporating RSI readings, volatility measurements through ATR, and optional volume confirmation. When these elements align, the indicator generates various trading signals based on the selected sensitivity mode.
🟢 Key Features & Signals
1. Multi-Period Trend Identification
The indicator combines multiple EMAs of different lengths to provide comprehensive trend analysis within the same timeframe, displaying the information through color-coded visual elements on the chart.
When an uptrend is detected, chart elements are colored with the bullish theme color (default: green/teal).
Similarly, when a downtrend is detected, chart elements are colored with the bearish theme color (default: red).
During neutral or indecisive periods, chart elements are colored with a neutral gray color, providing clear visual distinction between trending and non-trending market conditions.
This visualization provides immediate insights into underlying trend direction without requiring separate indicators, helping traders and investors quickly identify the market's current state.
2. Trend Strength Information Panel
The trend panel operates in three different sensitivity modes (Conservative, Aggressive, and Balanced), each affecting how the indicator processes and displays market information.
The Conservative mode prioritizes signal reliability over frequency, showing only strong trend movements with high conviction levels.
The Aggressive mode detects early trend changes, providing more frequent signals but potentially more false positives.
The Balanced mode offers a middle ground with moderate signal frequency and reliability.
Regardless of the selected mode, the panel displays:
Current trend direction (UPTREND, DOWNTREND, or NEUTRAL)
Trend strength percentage (0-100%)
Early detection signals when applicable
The active sensitivity mode
This comprehensive approach helps traders and investors:
→ Assess the strength and reliability of current market trends
→ Identify early potential trend changes before full confirmation
→ Make more informed trading and investing decisions based on trend context
3. Customizable Visualization Settings
This indicator offers extensive visual customization options to suit different trading/investing styles and preferences:
Display options:
→ Fully customizable uptrend, downtrend, and neutral colors
→ Color-coded price bars showing trend direction
→ Dynamic gradient bands visualizing potential trend channels
→ Optional background coloring based on trend intensity
→ Adjustable transparency levels for all visual elements
These visualization settings can be fine-tuned through the indicator's interface, allowing traders and investors to create a personalized chart environment that emphasizes the most relevant information for their strategy.
The indicator also features a comprehensive alert system with notifications for:
New trend formations (uptrend, downtrend, neutral)
Early trend change signals
Momentum threshold crossovers
Other significant market conditions
Alerts can be delivered through TradingView's notification system, making it easy to stay informed of important market developments even when you are away from the charts.
🟢 Practical Usage Tips
→ Trend Analysis and Interpretation: The indicator visualizes trend direction and strength directly on the chart through color-coding and the information panel, allowing traders and investors to immediately identify the current market context. This information helps in assessing the potential for continuation or reversal.
→ Signal Generation Strategies: The indicator generates potential trading signals based on trend direction, momentum confirmation, and selected sensitivity mode. Users can choose between Conservative (fewer but more reliable signals), Balanced (moderate approach), or Aggressive (more frequent but potentially less reliable signals).
→ Multi-Period Trend Assessment: Through its layered EMA approach, the indicator enables users to understand trend conditions across different lookback periods within the same timeframe. This helps in identifying the dominant trend and potential turning points.
🟢 Pro Tips
Adjust EMA periods based on your timeframe:
→ Lower values for shorter timeframes and more frequent signals
→ Higher values for higher timeframes and more reliable signals
Fine-tune sensitivity mode based on your trading style:
→ "Conservative" for position trading/long-term investing and fewer false signals
→ "Balanced" for swing trading/medium-term investing with moderate signal frequency
→ "Aggressive" for scalping/day trading and catching early trend changes
Look for confluence between components:
→ Strong trend strength percentage and direction in the information panel
→ Overall market context aligning with the expected direction
Use for multiple trading approaches:
→ Trend following during strong momentum periods
→ Counter-trend trading at band extremes during overextension
→ Early trend change detection with sensitivity adjustments
→ Stop loss placement using dynamic bands
Combine with:
→ Volume indicators like the Volume Delta & Order Block Suite for additional confirmation
→ Support/resistance analysis for strategic entry/exit points
→ Multiple timeframe analysis for broader market context
Trendfollowing

Smart MA CrossoverSmart MA Crossover Indicator
This custom indicator helps traders identify key buy and sell signals based on the crossover of price and a customizable moving average (MA). It combines trend direction, momentum, and volume to provide accurate entry signals with dynamic visual cues.
Features:
- Customizable Moving Average (MA): Choose from various MA types such as SMA, EMA, HMA, and more.
- Buy & Sell Signals: Signals are generated based on strong trend momentum and volume, with the addition of crossovers from a moving average.
- Background Coloring: The chart background turns green when in an uptrend and red during a downtrend, offering a quick visual guide to market conditions.
- Volume Confirmation: Signals are validated with volume filters to ensure strong market participation.
- Alerts: Set alerts for buy and sell signals to receive real-time notifications.
How It Works:
Buy Signal: Triggered when the price is above the selected MA, with bullish momentum (closing more than 0.5% higher than the open), and accompanied by a volume spike.
Sell Signal: Triggered when the price is below the selected MA, with bearish momentum (closing more than 0.5% lower than the open), and a corresponding volume surge.

AI Adaptive Oscillator [PhenLabs]📊 Algorithmic Adaptive Oscillator
Version: PineScript™ v6
📌 Description
The AI Adaptive Oscillator is a sophisticated technical indicator that employs ensemble learning and adaptive weighting techniques to analyze market conditions. This innovative oscillator combines multiple traditional technical indicators through an AI-driven approach that continuously evaluates and adjusts component weights based on historical performance. By integrating statistical modeling with machine learning principles, the indicator adapts to changing market dynamics, providing traders with a responsive and reliable tool for market analysis.
🚀 Points of Innovation:
Ensemble learning framework with adaptive component weighting
Performance-based scoring system using directional accuracy
Dynamic volatility-adjusted smoothing mechanism
Intelligent signal filtering with cooldown and magnitude requirements
Signal confidence levels based on multi-factor analysis
🔧 Core Components
Ensemble Framework : Combines up to five technical indicators with performance-weighted integration
Adaptive Weighting : Continuous performance evaluation with automated weight adjustment
Volatility-Based Smoothing : Adapts sensitivity based on current market volatility
Pattern Recognition : Identifies potential reversal patterns with signal qualification criteria
Dynamic Visualization : Professional color schemes with gradient intensity representation
Signal Confidence : Three-tiered confidence assessment for trading signals
🔥 Key Features
The indicator provides comprehensive market analysis through:
Multi-Component Ensemble : Integrates RSI, CCI, Stochastic, MACD, and Volume-weighted momentum
Performance Scoring : Evaluates each component based on directional prediction accuracy
Adaptive Smoothing : Automatically adjusts based on market volatility
Pattern Detection : Identifies potential reversal patterns in overbought/oversold conditions
Signal Filtering : Prevents excessive signals through cooldown periods and minimum change requirements
Confidence Assessment : Displays signal strength through intuitive confidence indicators (average, above average, excellent)
🎨 Visualization
Gradient-Filled Oscillator : Color intensity reflects strength of market movement
Clear Signal Markers : Distinct bullish and bearish pattern signals with confidence indicators
Range Visualization : Clean representation of oscillator values from -6 to 6
Zero Line : Clear demarcation between bullish and bearish territory
Customizable Colors : Color schemes that can be adjusted to match your chart style
Confidence Symbols : Intuitive display of signal confidence (no symbol, +, or ++) alongside direction markers
📖 Usage Guidelines
⚙️ Settings Guide
Color Settings
Bullish Color
Default: #2b62fa (Blue)
This setting controls the color representation for bullish movements in the oscillator. The color appears when the oscillator value is positive (above zero), with intensity indicating the strength of the bullish momentum. A brighter shade indicates stronger bullish pressure.
Bearish Color
Default: #ce9851 (Amber)
This setting determines the color representation for bearish movements in the oscillator. The color appears when the oscillator value is negative (below zero), with intensity reflecting the strength of the bearish momentum. A more saturated shade indicates stronger bearish pressure.
Signal Settings
Signal Cooldown (bars)
Default: 10
Range: 1-50
This parameter sets the minimum number of bars that must pass before a new signal of the same type can be generated. Higher values reduce signal frequency and help prevent overtrading during choppy market conditions. Lower values increase signal sensitivity but may generate more false positives.
Min Change For New Signal
Default: 1.5
Range: 0.5-3.0
This setting defines the minimum required change in oscillator value between consecutive signals of the same type. It ensures that new signals represent meaningful changes in market conditions rather than minor fluctuations. Higher values produce fewer but potentially higher-quality signals, while lower values increase signal frequency.
AI Core Settings
Base Length
Default: 14
Minimum: 2
This fundamental setting determines the primary calculation period for all technical components in the ensemble (RSI, CCI, Stochastic, etc.). It represents the lookback window for each component’s base calculation. Shorter periods create a more responsive but potentially noisier oscillator, while longer periods produce smoother signals with potential lag.
Adaptive Speed
Default: 0.1
Range: 0.01-0.3
Controls how quickly the oscillator adapts to new market conditions through its volatility-adjusted smoothing mechanism. Higher values make the oscillator more responsive to recent price action but potentially more erratic. Lower values create smoother transitions but may lag during rapid market changes. This parameter directly influences the indicator’s adaptiveness to market volatility.
Learning Lookback Period
Default: 150
Minimum: 10
Determines the historical data range used to evaluate each ensemble component’s performance and calculate adaptive weights. This setting controls how far back the AI “learns” from past performance to optimize current signals. Longer periods provide more stable weight distribution but may be slower to adapt to regime changes. Shorter periods adapt more quickly but may overreact to recent anomalies.
Ensemble Size
Default: 5
Range: 2-5
Specifies how many technical components to include in the ensemble calculation.
Understanding The Interaction Between Settings
Base Length and Learning Lookback : The base length determines the reactivity of individual components, while the lookback period determines how their weights are adjusted. These should be balanced according to your timeframe - shorter timeframes benefit from shorter base lengths, while the lookback should generally be 10-15 times the base length for optimal learning.
Adaptive Speed and Signal Cooldown : These settings control sensitivity from different angles. Increasing adaptive speed makes the oscillator more responsive, while reducing signal cooldown increases signal frequency. For conservative trading, keep adaptive speed low and cooldown high; for aggressive trading, do the opposite.
Ensemble Size and Min Change : Larger ensembles provide more stable signals, allowing for a lower minimum change threshold. Smaller ensembles might benefit from a higher threshold to filter out noise.
Understanding Signal Confidence Levels
The indicator provides three distinct confidence levels for both bullish and bearish signals:
Average Confidence (▲ or ▼) : Basic signal that meets the minimum pattern and filtering criteria. These signals indicate potential reversals but with moderate confidence in the prediction. Consider using these as initial alerts that may require additional confirmation.
Above Average Confidence (▲+ or ▼+) : Higher reliability signal with stronger underlying metrics. These signals demonstrate greater consensus among the ensemble components and/or stronger historical performance. They offer increased probability of successful reversals and can be traded with less additional confirmation.
Excellent Confidence (▲++ or ▼++) : Highest quality signals with exceptional underlying metrics. These signals show strong agreement across oscillator components, excellent historical performance, and optimal signal strength. These represent the indicator’s highest conviction trade opportunities and can be prioritized in your trading decisions.
Confidence assessment is calculated through a multi-factor analysis including:
Historical performance of ensemble components
Degree of agreement between different oscillator components
Relative strength of the signal compared to historical thresholds
✅ Best Use Cases:
Identify potential market reversals through oscillator extremes
Filter trade signals based on AI-evaluated component weights
Monitor changing market conditions through oscillator direction and intensity
Confirm trade signals from other indicators with adaptive ensemble validation
Detect early momentum shifts through pattern recognition
Prioritize trading opportunities based on signal confidence levels
Adjust position sizing according to signal confidence (larger for ++ signals, smaller for standard signals)
⚠️ Limitations
Requires sufficient historical data for accurate performance scoring
Ensemble weights may lag during dramatic market condition changes
Higher ensemble sizes require more computational resources
Performance evaluation quality depends on the learning lookback period length
Even high confidence signals should be considered within broader market context
💡 What Makes This Unique
Adaptive Intelligence : Continuously adjusts component weights based on actual performance
Ensemble Methodology : Combines strength of multiple indicators while minimizing individual weaknesses
Volatility-Adjusted Smoothing : Provides appropriate sensitivity across different market conditions
Performance-Based Learning : Utilizes historical accuracy to improve future predictions
Intelligent Signal Filtering : Reduces noise and false signals through sophisticated filtering criteria
Multi-Level Confidence Assessment : Delivers nuanced signal quality information for optimized trading decisions
🔬 How It Works
The indicator processes market data through five main components:
Ensemble Component Calculation :
Normalizes traditional indicators to consistent scale
Includes RSI, CCI, Stochastic, MACD, and volume components
Adapts based on the selected ensemble size
Performance Evaluation :
Analyzes directional accuracy of each component
Calculates continuous performance scores
Determines adaptive component weights
Oscillator Integration :
Combines weighted components into unified oscillator
Applies volatility-based adaptive smoothing
Scales final values to -6 to 6 range
Signal Generation :
Detects potential reversal patterns
Applies cooldown and magnitude filters
Generates clear visual markers for qualified signals
Confidence Assessment :
Evaluates component agreement, historical accuracy, and signal strength
Classifies signals into three confidence tiers (average, above average, excellent)
Displays intuitive confidence indicators (no symbol, +, ++) alongside direction markers
💡 Note:
The AI Adaptive Oscillator performs optimally when used with appropriate timeframe selection and complementary indicators. Its adaptive nature makes it particularly valuable during changing market conditions, where traditional fixed-weight indicators often lose effectiveness. The ensemble approach provides a more robust analysis by leveraging the collective intelligence of multiple technical methodologies. Pay special attention to the signal confidence indicators to optimize your trading decisions - excellent (++) signals often represent the most reliable trade opportunities.

Ichimoku Cloud SmoothedThis smoothed version of the Ichimoku Cloud uses exponential moving averages (EMAs) of the HL2 price (average of high and low) for calculations rather than the traditional high-low calculation method. This simple modification creates a smoother, more responsive Ichimoku Cloud that reduces noise while enhancing trend identification.

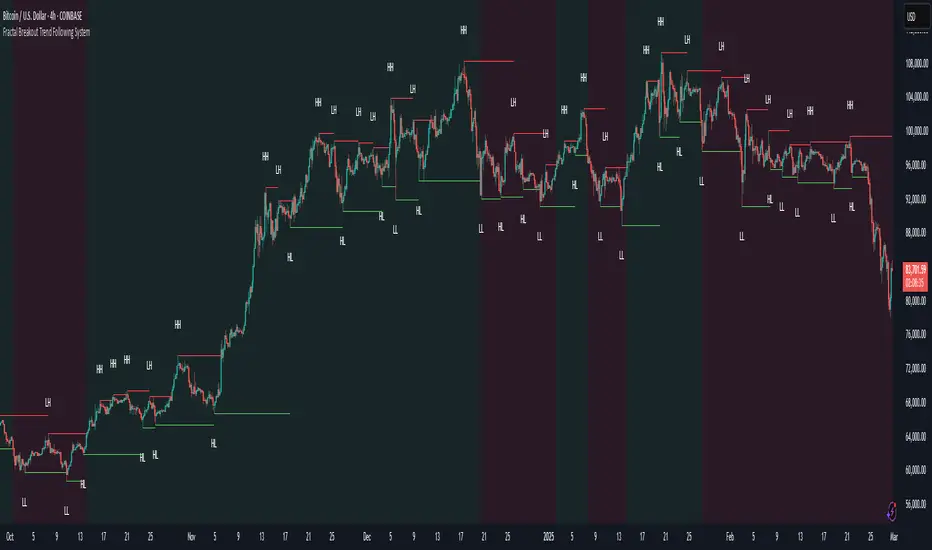
Fractal Breakout Trend Following System█ OVERVIEW
The Fractal Breakout Trend Following System is a custom technical analysis tool designed to pinpoint significant fractal pivot points and breakout levels. By analyzing price action through configurable pivot parameters, this indicator dynamically identifies key support and resistance zones. It not only marks crucial highs and lows on the chart but also signals potential trend reversals through real-time breakout detections, helping traders capture shifts in market momentum.
█ KEY FEATURES
Fractal Pivot Detection
Utilizes user-defined left and right pivot lengths to detect local highs (pivot highs) and lows (pivot lows). This fractal-based approach ensures that only meaningful price moves are considered, effectively filtering out minor market noise.
Dynamic Line Visualization
Upon confirmation of a pivot, the system draws a dynamic line representing resistance (from pivot highs) or support (from pivot lows). These lines extend across the chart until a breakout occurs, offering a continuous visual guide to key levels.
Trend Breakout Signals
Monitors for price crossovers relative to the drawn pivot lines. A crossover above a resistance line signals a bullish breakout, while a crossunder below a support line indicates a bearish move, thus updating the prevailing trend.
Pivot Labelling
Assigns labels such as "HH", "LH", "LL", or "HL" to detected pivots based on their relative values.
It uses the following designations:
HH (Higher High) : Indicates that the current pivot high is greater than the previous pivot high, suggesting continued upward momentum.
LH (Lower High) : Signals that the current pivot high is lower than the previous pivot high, which may hint at a potential reversal within an uptrend.
LL (Lower Low) : Shows that the current pivot low is lower than the previous pivot low, confirming sustained downward pressure.
HL (Higher Low) : Reveals that the current pivot low is higher than the previous pivot low, potentially indicating the beginning of an upward reversal in a downtrend.
These labels provide traders with immediate insight into the market structure and recent price behavior.
Customizable Visual Settings
Offers various customization options:
• Adjust pivot sensitivity via left/right pivot inputs.
• Toggle pivot labels on or off.
• Enable background color changes to reflect bullish or bearish trends.
• Choose preferred colors for bullish (e.g., green) and bearish (e.g., red) signals.
█ UNDERLYING METHODOLOGY & CALCULATIONS
Fractal Pivot Calculation
The script employs a sliding window technique using configurable left and right parameters to identify local highs and lows. Detected pivot values are sanitized to ensure consistency in subsequent calculations.
Dynamic Line Plotting
When a new pivot is detected, a corresponding line is drawn from the pivot point. This line extends until the price breaks the level, at which point it is reset. This method provides a continuous reference for support and resistance.
Trend Breakout Identification
By continuously monitoring price interactions with the pivot lines, the indicator identifies breakouts. A price crossover above a resistance line suggests a bullish breakout, while a crossunder below a support line indicates a bearish shift. The current trend is updated accordingly.
Pivot Label Assignment
The system compares the current pivot with the previous one to determine if the move represents a higher high, lower high, higher low, or lower low. This classification helps traders understand the underlying market momentum.
█ HOW TO USE THE INDICATOR
1 — Apply the Indicator
• Add the Fractal Breakout Trend Following System to your chart to begin visualizing dynamic pivot points and breakout signals.
2 — Adjust Settings for Your Market
• Pivot Detection – Configure the left and right pivot lengths for both highs and lows to suit your desired sensitivity:
- Use shorter lengths for more responsive signals in fast-moving markets.
- Use longer lengths to filter out minor fluctuations in volatile conditions.
• Visual Customization – Toggle the display of pivot labels and background color changes. Select your preferred colors for bullish and bearish trends.
3 — Interpret the Signals
• Support & Resistance Lines – Observe the dynamically drawn lines that represent key pivot levels.
• Pivot Labels – Look for labels like "HH", "LH", "LL", and "HL" to quickly assess market structure and trend behavior.
• Trend Signals – Watch for price crossovers and corresponding background color shifts to gauge bullish or bearish breakouts.
4 — Integrate with Your Trading Strategy
• Use the identified pivot points as potential support and resistance levels.
• Combine breakout signals with other technical indicators for comprehensive trade confirmation.
• Adjust the sensitivity settings to tailor the indicator to various instruments and market conditions.
█ CONCLUSION
The Fractal Breakout Trend Following System offers a robust framework for identifying critical fractal pivot points and potential breakout opportunities. With its dynamic line plotting, clear pivot labeling, and customizable visual settings, this indicator equips traders with actionable insights to enhance decision-making and optimize entry and exit strategies.
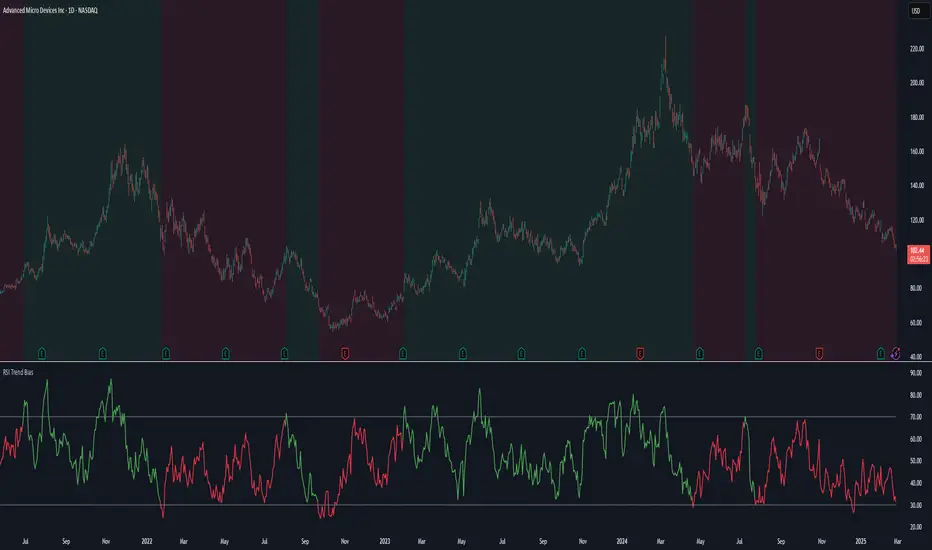
RSI Trend Bias█ OVERVIEW
The RSI Trend Bias indicator is a custom technical analysis tool that utilizes the Relative Strength Index (RSI) to gauge market momentum and identify potential trend shifts. By monitoring RSI crossovers and crossunders relative to customizable threshold levels, the indicator provides clear visual cues that distinguish between bullish and bearish market conditions. This flexible approach makes it suitable for both short-term scalping and longer-term trend analysis.
█ KEY FEATURES
Dynamic RSI Trend Detection
The indicator dynamically determines market bias by monitoring the RSI for crossovers above the upper threshold and crossunders below the lower threshold. This method ensures that only significant momentum shifts trigger a change in trend, reducing false signals in volatile markets.
Adaptive Visualizations
The RSI Trend Bias indicator enhances clarity by plotting the RSI with colors that reflect current market conditions. Additionally, it offers an optional background color change to further emphasize bullish or bearish states, providing immediate visual feedback to traders.
Clear Threshold Indicators
Upper and lower threshold levels are plotted as constant reference lines, clearly delineating overbought and oversold regions. These markers help traders quickly assess market conditions at a glance.
Customizable Settings
Users have full control over key parameters including the RSI length, threshold levels, and visual settings. This customization allows the indicator to be tailored for different markets and trading styles, ensuring optimal performance across various timeframes.
█ UNDERLYING METHODOLOGY & CALCULATIONS
RSI Calculation
The indicator computes the Relative Strength Index over a user-defined period (default is 14), providing a measure of market momentum that reflects price changes over time.
Trend Determination Logic
By detecting when the RSI crosses above the upper threshold, the indicator signals a shift towards bullish momentum. Conversely, a crossunder below the lower threshold indicates bearish conditions. This straightforward binary approach filters out minor fluctuations, ensuring clarity in trend analysis.
Visual Signal Integration
Based on the detected trend, the RSI line is dynamically colored—green for bullish conditions and red for bearish conditions. An optional background color change further reinforces these signals, offering an immediate visual cue of prevailing market sentiment.
█ HOW TO USE THE INDICATOR
1 — Apply the Indicator
• Add the RSI Trend Bias indicator to a separate pane in your trading platform.
2 — Adjust Settings for Your Market
• RSI Length – Define the period for RSI calculation (default is 14).
• Threshold Levels – Set the upper (default 70) and lower (default 30) thresholds to identify overbought and oversold conditions.
• Visual Customization – Choose the bullish (green) and bearish (red) colors, and enable background color changes to enhance visual trend recognition.
3 — Interpret the Signals
• RSI Line – Observe the dynamically colored RSI line; a shift to green signals bullish momentum, while red indicates bearish conditions.
• Threshold Levels – Use the constant upper and lower lines as reference points for overbought and oversold states.
• Signal Timing – A crossover above the upper threshold or a crossunder below the lower threshold suggests potential entry or exit points.
4 — Integrate with Your Trading Strategy
• Combine RSI Trend Bias signals with other technical analysis tools to confirm market direction.
• Utilize the visual cues for fine-tuning your entry and exit decisions, ensuring robust risk management and optimized trade timing.
█ CONCLUSION
The RSI Trend Bias indicator offers a streamlined yet effective approach to monitoring market momentum. By leveraging the established principles of RSI analysis alongside dynamic visual cues, it enables traders to quickly identify bullish and bearish trends. Its customizable features and clear threshold indicators make it a valuable tool for enhancing technical analysis and making informed trading decisions.
Breakout and Retest Signals [AlgoAlpha]OVERVIEW
This script detects breakout and retest signals by identifying key pivot points in price action and analyzing their relationship with historical swing highs and lows. It highlights breakout structures using ATR-based tolerance levels and volume analysis to confirm potential trend continuations or reversals. The script marks significant price levels with dynamic boxes and dashed lines to help traders visualize breakout and retest areas effectively.
CONCEPTS
The script relies on pivot point analysis, a technique used to identify significant price levels where the market has previously reversed. It dynamically tracks a set number of recent swing highs and lows, allowing traders to see if the price is revisiting a previously significant level. The concept of breakouts and retests is widely used in technical analysis to determine potential entry points. A breakout occurs when the price moves beyond a resistance or support level, and a retest happens when the price returns to test that level before continuing in the breakout direction. This script enhances that analysis by incorporating ATR-based tolerance levels, ensuring that price zones are not too large.
FEATURES
Breakout and Retest Markings : Highlights breakout and retest areas with shaded boxes, allowing traders to visualize where price action is confirming key levels.
Volume Delta and Ratio : Analyzes volume at breakout levels to gauge the strength of the move, displaying volume delta information for additional context. The script also displays the ratio of selling to buying at the retest along traders to make better judgement on their entries.
Multi-Timeframe Adaptability : Dynamically adjusts volume analysis to align with the appropriate lower timeframe, ensuring reliable volume comparisons.
Alerts for Breakout and Retest Events : Traders can receive real-time notifications when bullish or bearish breakout retests are detected.
USAGE
This script is best suited for traders looking to identify strong breakout and retest setups across different timeframes. Users can customize the pivot detection period and swing point memory to adjust sensitivity based on their trading style. The ATR length and multiplier allow further refinement of breakout tolerance, reducing noise in volatile markets. The breakout zones are displayed as shaded boxes, where traders can assess whether a price retest is occurring under favorable conditions. Alerts can be set to notify traders of potential trade opportunities.

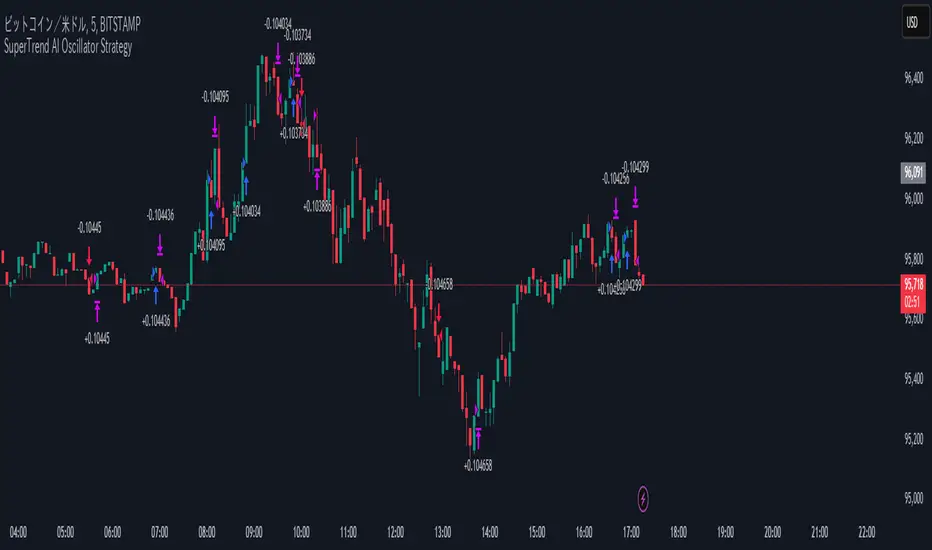
SuperTrend AI Oscillator StrategySuperTrend AI Oscillator Strategy
Overview
This strategy is a trend-following approach that combines the SuperTrend indicator with oscillator-based filtering.
By identifying market trends while utilizing oscillator-based momentum analysis, it aims to improve entry precision.
Additionally, it incorporates a trailing stop to strengthen risk management while maximizing profits.
This strategy can be applied to various markets, including Forex, Crypto, and Stocks, as well as different timeframes. However, its effectiveness varies depending on market conditions, so thorough testing is required.
Features
1️⃣ Trend Identification Using SuperTrend
The SuperTrend indicator (a volatility-adjusted trend indicator based on ATR) is used to determine trend direction.
A long entry is considered when SuperTrend turns bullish.
A short entry is considered when SuperTrend turns bearish.
The goal is to capture clear trend reversals and avoid unnecessary trades in ranging markets.
2️⃣ Entry Filtering with an Oscillator
The Super Oscillator is used to filter entry signals.
If the oscillator exceeds 50, it strengthens long entries (indicating strong bullish momentum).
If the oscillator drops below 50, it strengthens short entries (indicating strong bearish momentum).
This filter helps reduce trades in uncertain market conditions and improves entry accuracy.
3️⃣ Risk Management with a Trailing Stop
Instead of a fixed stop loss, a SuperTrend-based trailing stop is implemented.
The stop level adjusts automatically based on market volatility.
This allows profits to run while managing downside risk effectively.
4️⃣ Adjustable Risk-Reward Ratio
The default risk-reward ratio is set at 1:2.
Example: A 1% stop loss corresponds to a 2% take profit target.
The ratio can be customized according to the trader’s risk tolerance.
5️⃣ Clear Trade Signals & Visual Support
Green "BUY" labels indicate long entry signals.
Red "SELL" labels indicate short entry signals.
The Super Oscillator is plotted in a separate subwindow to visually assess trend strength.
A real-time trailing stop is displayed to support exit strategies.
These visual aids make it easier to identify entry and exit points.
Trading Parameters & Considerations
Initial Account Balance: Default is $7,000 (adjustable).
Base Currency: USD
Order Size: 10,000 USD
Pyramiding: 1
Trading Fees: $0.94 per trade
Long Position Margin: 50%
Short Position Margin: 50%
Total Trades (M5 Timeframe): 1,032
Visual Aids for Clarity
This strategy includes clear visual trade signals to enhance decision-making:
Green "BUY" labels for long entries
Red "SELL" labels for short entries
Super Oscillator plotted in a subwindow with a 50 midline
Dynamic trailing stop displayed for real-time trend tracking
These visual aids allow traders to quickly identify trade setups and manage positions with greater confidence.
Summary
The SuperTrend AI Oscillator Strategy is developed based on indicators from Black Cat and LuxAlgo.
By integrating high-precision trend analysis with AI-based oscillator filtering, it provides a strong risk-managed trading approach.
Important Notes
This strategy does not guarantee profits—performance varies based on market conditions.
Past performance does not guarantee future results. Markets are constantly changing.
Always test extensively with backtesting and demo trading before using it in live markets.
Risk management, position sizing, and market conditions should always be considered when trading.
Conclusion
This strategy combines trend analysis with momentum filtering, enhancing risk management in trading.
By following market trends carefully, making precise entries, and using trailing stops, it seeks to reduce risk while maximizing potential profits.
Before using this strategy, be sure to test it thoroughly via backtesting and demo trading, and adjust the settings to match your trading style.
Donchian Trend Ribbon MTF HeatmapIf you're familiar with Donchian Channels, you probably already know how they work, so I won’t dive too deep into that.
This indicator builds upon the concept of Donchian Channels to create a Donchian Trend Ribbon MultiTimeframe (MTF) Heatmap. The aim is to visualize trend strength across multiple timeframes and provide a clearer picture of market direction.
How it Works:
Main Trend Calculation: The indicator calculates the main trend direction based on a user-defined period (e.g., 20 periods). You can adjust this length to fit your trading strategy.
Secondary Trend Analysis: It also calculates the trend direction for each of the 9 lower lengths. For example, if you set the length to 20, the secondary lengths would be 19, 18, ..., down to 11.
Trend Alignment Check: The indicator compares the trend direction from the lower lengths to the main trend direction to determine alignment.
Trend Ribbon Coloring: Based on this alignment, the trend ribbon changes color to reflect the strength and direction of the trend. The color intensity adjusts as the strength of the trend shifts.
Trend Colors:
Yellow: Strong uptrend
Dark Yellow: Weak uptrend
Red: Strong downtrend
Dark Red: Weak downtrend
Gray: Neutral or no strong trend
Additionally, weak trends are highlighted with emojis (😯 for weak long and 😡 for weak short), making it easy to spot when trends are fading.
Warning:
Entry points provided by this indicator may also indicate potential trend reversals, so use caution.
Consider utilizing a stop-loss line if you plan to take positions based on the signals generated by this tool.
Notes :
Non-Repainting: This indicator does not repaint, providing reliable historical signals.
Educational Use: The indicator is designed primarily for educational purposes and has not been backtested. Please use it as part of your broader analysis before making trading decisions.
Original Code by:
The original version of this code was created by LonesomeTheBlue. This enhanced version includes additional features such as multi-timeframe analysis and trend strength visualization.

Liquidity Sweep Filter [AlgoAlpha]Unlock a deeper understanding of market liquidity with the Liquidity Sweep Filter by AlgoAlpha. This indicator identifies liquidity sweeps, highlighting key price levels where large liquidations have occurred. By visualizing major and minor liquidation events, traders can better anticipate potential reversals and market structure shifts, making this an essential tool for those trading in volatile conditions.
Key Features :
🔍 Liquidity Sweep Detection – Identifies and highlights areas where liquidity has been swept, distinguishing between major and minor liquidation events.
📊 Volume Profile Integration – Displays a volume profile overlay, helping traders spot high-activity price zones where the market is likely to react.
📈 Trend-Based Filtering – Utilizes an adaptive trend detection algorithm to refine liquidity sweeps based on market direction, reducing noise.
🎨 Customizable Visualization – Modify colors, thresholds, and display settings to tailor the indicator to your trading style.
🔔 Alerts for Liquidity Sweeps & Trend Changes – Stay ahead of the market by receiving alerts when significant liquidity events or trend shifts occur.
How to Use:
🛠 Add the Indicator : Add the Liquidity Sweep Filter to your chart and configure the settings based on your preferred sensitivity. Adjust the major sweep threshold to filter out smaller moves.
📊 Analyze Liquidity Zones and trend direction : Look for liquidation levels where large buy or sell stops have been triggered. Major sweeps indicate strong reactions, while minor sweeps show gradual liquidity absorption. You can also see which levels are high in liquidity by the transparency of the levels.
🔔 Set-Up Alerts : Use the in-built alerts so you don't miss a trading opportunity
How It Works :
The Liquidity Sweep Filter detects liquidity events by tracking swing highs and lows (defined as a pivot where neighboring candles are lower/higher than it) where traders are likely to have placed stop-loss orders. It evaluates volume and price action, marking areas where liquidity has been absorbed by the market. Additionally, the integrated trend filter ensures that only relevant liquidity sweeps are highlighted based on market direction, lows in an uptrend and highs in a downtrend. The trend filter works by calculating a basis, and defining trend shifts when the closing price crosses over the upper or lower bands.The included volume profile further enhances analysis by displaying key trading zones where price may react.

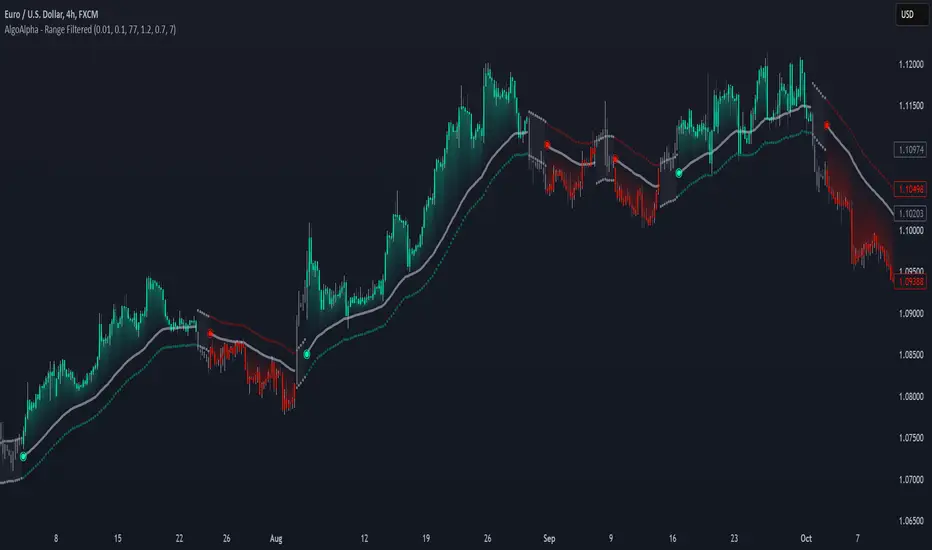
Range Filtered Trend Signals [AlgoAlpha]Introducing the Range Filtered Trend Signals , a cutting-edge trading indicator designed to detect market trends and ranging conditions with high accuracy. This indicator leverages a combination of Kalman filtering and Supertrend analysis to smooth out price fluctuations while maintaining responsiveness to trend shifts. By incorporating volatility-based range filtering, it ensures traders can differentiate between trending and ranging conditions effectively, reducing false signals and enhancing trade decision-making.
:key: Key Features
:white_check_mark: Kalman Filter Smoothing – Minimizes market noise while preserving trend clarity.
:bar_chart: Supertrend Integration – A dynamic trend-following mechanism for spotting reversals.
:fire: Volatility-Based Range Detection – Detects trending vs. ranging conditions with precision.
:art: Color-Coded Trend Signals – Instantly recognize bullish, bearish, and ranging market states.
:gear: Customizable Inputs – Fine-tune Kalman parameters, Supertrend settings, and color themes to match your strategy.
:bell: Alerts for Trend Shifts – Get real-time notifications when market conditions change!
:tools: How to Use
Add the Indicator – Click the star icon to add it to your TradingView favorites.
Analyze Market Conditions – Observe the color-coded signals and range boundaries to identify trend strength and direction.
Use Alerts for Trade Execution – Set alerts for trend shifts and market conditions to stay ahead without constantly monitoring charts.
:mag: How It Works
The Kalman filter smooths price fluctuations by dynamically adjusting its weighting based on market volatility. It helps remove noise while keeping the signal reactive to trend changes. The Supertrend calculation is then applied to the filtered price data, providing a robust trend-following mechanism. To enhance signal accuracy, a volatility-weighted range filter is incorporated, creating upper and lower boundaries that define trend conditions. When price breaks out of these boundaries, the indicator confirms trend continuation, while signals within the range indicate market consolidation. Traders can leverage this tool to enhance trade timing, filter false breakouts, and identify optimal entry/exit zones.
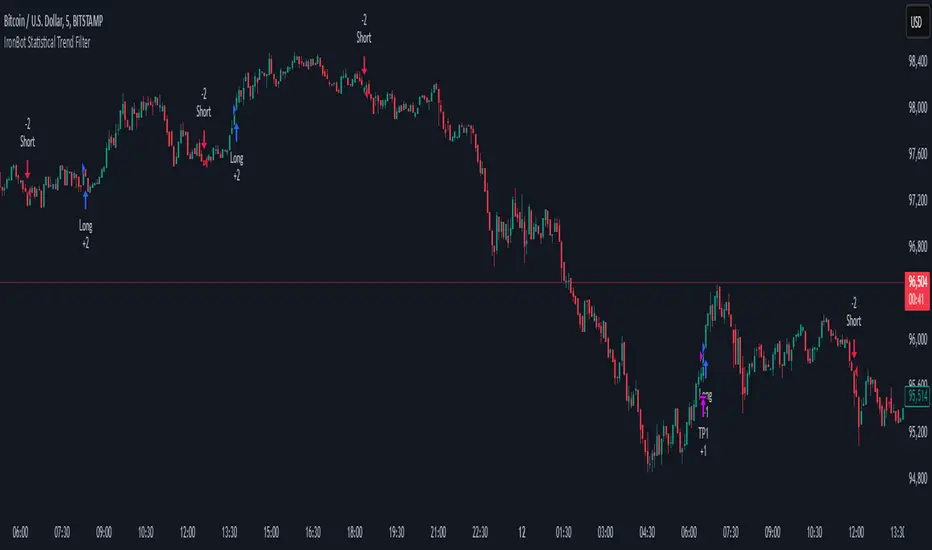
Iron Bot Statistical Trend Filter📌 Iron Bot Statistical Trend Filter
📌 Overview
Iron Bot Statistical Trend Filter is an advanced trend filtering strategy that combines statistical methods with technical analysis.
By leveraging Z-score and Fibonacci levels, this strategy quantitatively analyzes market trends to provide high-precision entry signals.
Additionally, it includes an optional EMA filter to enhance trend reliability.
Risk management is reinforced with Stop Loss (SL) and four Take Profit (TP) levels, ensuring a balanced approach to risk and reward.
📌 Key Features
🔹 1. Statistical Trend Filtering with Z-Score
This strategy calculates the Z-score to measure how much the price deviates from its historical mean.
Positive Z-score: Indicates a statistically high price, suggesting a strong uptrend.
Negative Z-score: Indicates a statistically low price, signaling a potential downtrend.
Z-score near zero: Suggests a ranging market with no strong trend.
By using the Z-score as a filter, market noise is reduced, leading to more reliable entry signals.
🔹 2. Fibonacci Levels for Trend Reversal Detection
The strategy integrates Fibonacci retracement levels to identify potential reversal points in the market.
High Trend Level (Fibo 23.6%): When the price surpasses this level, an uptrend is likely.
Low Trend Level (Fibo 78.6%): When the price falls below this level, a downtrend is expected.
Trend Line (Fibo 50%): Acts as a midpoint, helping to assess market balance.
This allows traders to visually confirm trend strength and turning points, improving entry accuracy.
🔹 3. EMA Filter for Trend Confirmation (Optional)
The strategy includes an optional 200 EMA (Exponential Moving Average) filter for trend validation.
Price above 200 EMA: Indicates a bullish trend (long entries preferred).
Price below 200 EMA: Indicates a bearish trend (short entries preferred).
Enabling this filter reduces false signals and improves trend-following accuracy.
🔹 4. Multi-Level Take Profit (TP) and Stop Loss (SL) Management
To ensure effective risk management, the strategy includes four Take Profit levels and a Stop Loss:
Stop Loss (SL): Automatically closes trades when the price moves against the position by a certain percentage.
TP1 (+0.75%): First profit-taking level.
TP2 (+1.1%): A higher probability profit target.
TP3 (+1.5%): Aiming for a stronger trend move.
TP4 (+2.0%): Maximum profit target.
This system secures profits at different stages and optimizes risk-reward balance.
🔹 5. Automated Long & Short Trading Logic
The strategy is built using Pine Script®’s strategy.entry() and strategy.exit(), allowing fully automated trading.
Long Entry:
Price is above the trend line & high trend level.
Z-score is positive (indicating an uptrend).
(Optional) Price is also above the EMA for stronger confirmation.
Short Entry:
Price is below the trend line & low trend level.
Z-score is negative (indicating a downtrend).
(Optional) Price is also below the EMA for stronger confirmation.
This logic helps filter out unnecessary trades and focus only on high-probability entries.
📌 Trading Parameters
This strategy is designed for flexible capital management and risk control.
💰 Account Size: $5000
📉 Commissions and Slippage: Assumes 94 pips commission per trade and 1 pip slippage.
⚖️ Risk per Trade: Adjustable, with a default setting of 1% of equity.
These parameters help preserve capital while optimizing the risk-reward balance.
📌 Visual Aids for Clarity
To enhance usability, the strategy includes clear visual elements for easy market analysis.
✅ Trend Line (Blue): Indicates market midpoint and helps with entry decisions.
✅ Fibonacci Levels (Yellow): Highlights high and low trend levels.
✅ EMA Line (Green, Optional): Confirms long-term trend direction.
✅ Entry Signals (Green for Long, Red for Short): Clearly marked buy and sell signals.
These features allow traders to quickly interpret market conditions, even without advanced technical analysis skills.
📌 Originality & Enhancements
This strategy is developed based on the IronXtreme and BigBeluga indicators,
combining a unique Z-score statistical method with Fibonacci trend analysis.
Compared to conventional trend-following strategies, it leverages statistical techniques
to provide higher-precision entry signals, reducing false trades and improving overall reliability.
📌 Summary
Iron Bot Statistical Trend Filter is a statistically-driven trend strategy that utilizes Z-score and Fibonacci levels.
High-precision trend analysis
Enhanced accuracy with an optional EMA filter
Optimized risk management with multiple TP & SL levels
Visually intuitive chart design
Fully customizable parameters & leverage support
This strategy reduces false signals and helps traders ride the trend with confidence.
Try it out and take your trading to the next level! 🚀
Enhanced Momentum Divergence Radar+ [Alpha Extract]Enhanced Momentum Divergence Radar+
The AE's Enhanced Momentum Divergence Radar+ is designed to detect momentum shifts and divergence patterns, helping traders identify potential trend reversals and continuation points. By normalizing momentum readings and applying divergence detection, it enhances market timing for entries and exits.
🔶 CALCULATION
The indicator calculates normalized momentum using a combination of Detrended Price Oscillator (DPO) and volatility-adjusted smoothing techniques. It highlights overbought and oversold conditions while identifying bullish and bearish divergences.
Core Calculation:
ATR-based volatility adjustment ensures dynamic sensitivity.
DPO is derived from the price minus a simple moving average (SMA) to isolate cyclical movements.
Momentum score is normalized using historical max values for consistent scaling.
Thresholds are dynamically adjusted based on average absolute momentum.
dpo = close - ma
sd = (dpo / volatility) * 100
normalizedSD = sd / maxAbsSD
The momentum score is plotted as a histogram, where:
Green bars indicate strong upward momentum.
Red bars indicate strong downward momentum.
Neutral values fade into gray.
🔶 DETAILS
📊 Visual Features:
Histogram bars dynamically color-coded based on momentum strength.
Threshold bands provide reference points for overbought and oversold levels.
Divergence markers (Bullish/Bearish & Hidden Bullish/Bearish) highlight key reversal signals.
🛠 How Divergences Work:
Bullish Divergence (𝓞𝓢): Price makes a lower low while momentum makes a higher low.
Bearish Divergence (𝓞𝓑): Price makes a higher high while momentum makes a lower high.
Hidden Divergences confirm trend continuations rather than reversals.
📌 Example of Divergence Logic:
bullishDiv = (low == priceLow) and (sd > momentumLow)
bearishDiv = (high == priceHigh) and (sd < momentumHigh)
🔶 EXAMPLES
📍 The chart below illustrates price reacting to momentum divergences, identifying potential tops and bottoms before major price moves.
📌 Example snapshots:
A bullish divergence leading to a reversal in price.
A bearish divergence marking the beginning of a downtrend.
🔶 SETTINGS
🔹 Customization Options:
Lookback Period: Adjusts sensitivity to market cycles.
Smoothing Period: Controls signal clarity.
Color Options: Enables bar coloring based on momentum strength.
Divergence Sensitivity: Choose to display hidden divergences.
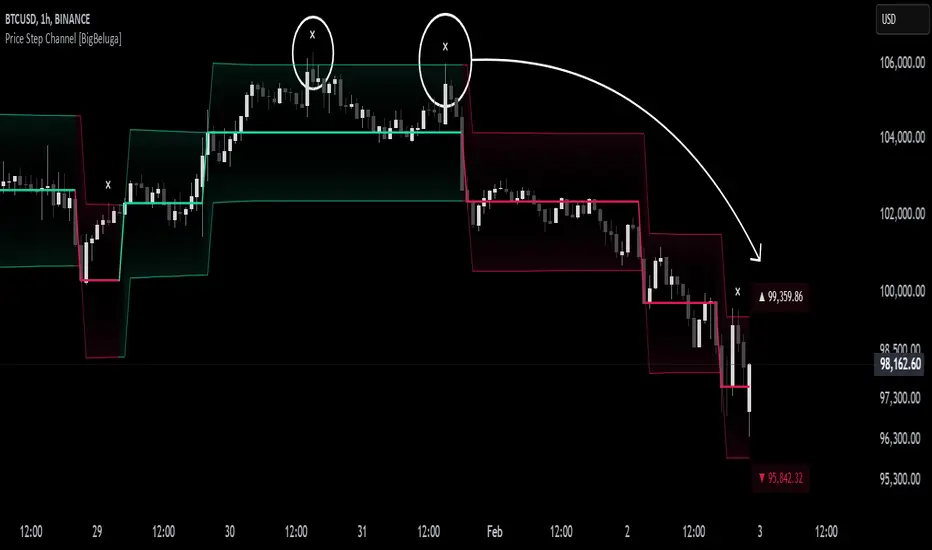
Price Step Channel [BigBeluga]Price Step Channel is designed to provide a structured look at price trends through a dynamic step line channel, highlighting trend direction and volatility boundaries.
🔵 Key Features:
Step Line with Boundaries: The central step line adjusts with price movements, creating upper and lower boundaries based on price volatility. The channel is green during uptrends and red during downtrends, visually signaling the trend’s direction.
Fakeout Markers: "✖" markers identify potential fakeouts—moments when the price breaches the channel boundary without confirming a trend change. These markers help you spot possible mean reversion points.
Dynamic Boundary Labels: Labels at the end of the channel show the price levels of the upper and lower boundaries. In uptrends, the upper label turns green; in downtrends, the lower label turns red, providing an instant read on the trend's direction.
Customizable Display: You can toggle off the boundaries and labels for a cleaner view, focusing only on the step line and its color-coded trend signals.
🔵 When to Use:
Price Step Channel is ideal for traders looking to follow structured trends with defined volatility boundaries. The step line and color-coded channel provide clear trend insights, while the fakeout markers and customizable display options enhance flexibility in different market conditions. Whether you’re focusing on clean trend signals or detailed boundary interactions, this tool adapts to your style.
AE - ATR Exhaustion ChannelAE - ATR Exhaustion Channel
📈 Overview
Identify Exhaustion Zones & Trend Breakouts with ATR Precision!
The AE - ATR Exhaustion Channel is a powerful volatility-based trading tool that combines an averaged SMA with ATR bands to dynamically highlight potential trend exhaustion zones. It provides real-time breakout detection by marking when price moves beyond key volatility bands, helping traders spot overextensions and reversals with ease.
🔑 Key Features
✔️ ATR-SMA Hybrid Channel: Uses an averaged SMA as the core trend filter while incorporating adaptive ATR-based bands for precise volatility tracking.
✔️ Dynamic Exhaustion Markers: Marks red crosses when price exceeds the upper band and green crosses when price drops below the lower band.
✔️ Customizable ATR Sensitivity: Adjust the ATR multiplier and length settings to fine-tune band sensitivity based on market conditions.
✔️ Clear Channel Visualization: A gray SMA midpoint and a blue-filled ATR band zone make it easy to track market structure.
📚 How It Works
1️⃣ Averaged SMA Calculation: The script calculates an averaged SMA over a user-defined range (min/max period). This smooths out short-term fluctuations while preserving trend direction.
2️⃣ ATR Band Construction: The ATR value (adjusted by a multiplier) is added to/subtracted from the SMA to form dynamic upper and lower volatility bands.
3️⃣ Exhaustion Detection:
If high > upper ATR band, a red cross is plotted (potential overextension).
If low < lower ATR band, a green cross is plotted (potential reversal zone).
4️⃣ Filled ATR Channel: The area between the upper and lower bands is shaded blue, providing a visual trading range.
🎨 Customization & Settings
⚙️ ATR Length – Adjusts the ATR calculation period (default: 14).
⚙️ ATR Multiplier – Scales the ATR bands for tighter or wider volatility tracking (default: 0.8, adjustable in 0.1 steps).
⚙️ SMA Range (Min/Max Length) – Defines the period range for calculating the averaged SMA (default: 5-20).
⚙️ Rolling Lookback Length – Controls how far back the high/low comparison is calculated (default: 50 bars).
🚀 Practical Usage
📌 Spotting Exhaustion Zones – Look for red/green markers appearing outside the ATR bands, signaling potential trend exhaustion and possible reversal opportunities.
📌 Breakout Confirmation – Price consistently breaching the upper band with momentum could indicate continuation, while repeated touches without strong closes may hint at reversal zones.
📌 Trend Reversal Signals – Watch for green markers below the lower band in uptrends (buy signals) and red markers above the upper band in downtrends (sell signals).
🔔 Alerts & Notifications
📢 Set Alerts for Exhaustion Signals!
Traders can configure alerts to trigger when price breaches the ATR bands, allowing for instant notifications when volatility-based exhaustion is detected.
📊 Example Scenarios
✔ Trend Exhaustion in Overextended Moves – A series of red crosses near resistance may indicate a short opportunity.
✔ Trend Exhaustion in Overextended Moves – A series of red crosses near resistance may indicate an opportunity to open a short trade.
✔ Volatility Compression Breakouts – If price consolidates within the ATR bands and suddenly breaks out, it could signify a momentum shift.
✔ Reversal Catching in Trending Markets – Spot potential trend reversals by looking for green markers below the ATR bands in bullish markets.
🌟 Why Choose AE - ATR Exhaustion Channel?
Trade with Confidence. Spot Volatility. Catch Breakouts.
The AE - ATR Exhaustion Channel is an essential tool for traders looking to identify trend exhaustion, detect breakouts, and manage volatility effectively. Whether you're trading stocks, crypto, or forex, this ATR-SMA hybrid system provides clear visual cues to help you stay ahead of market moves.
✅ Customizable to Fit Any Market
✅ Combines Volatility & Trend Analysis
✅ Easy-to-Use with Instant Breakout Detection

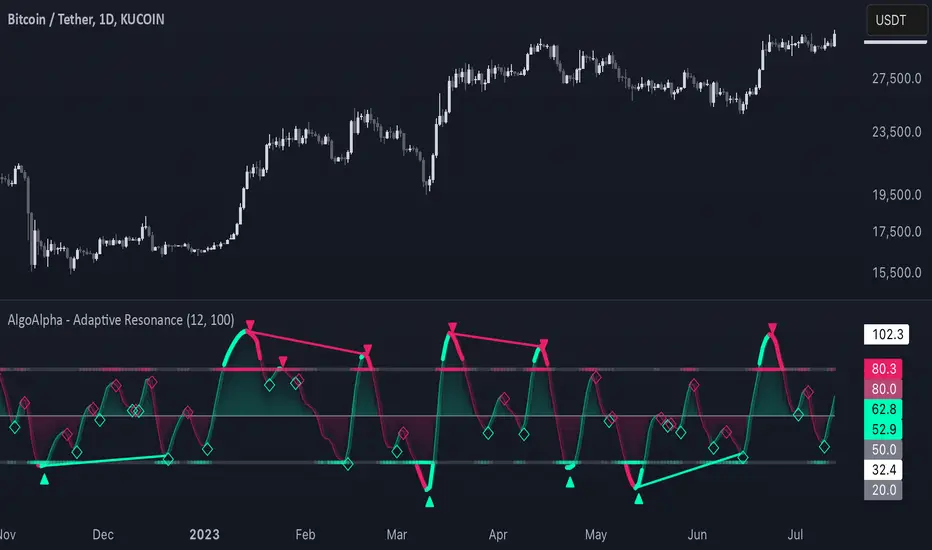
Adaptive Resonance Oscillator [AlgoAlpha]Introducing the Adaptive Resonance Oscillator , an advanced momentum-based oscillator designed to dynamically adjust to changing market conditions. This innovative indicator detects market frequency through a Hilbert Transform approach, adapting in real-time to identify overbought and oversold conditions with improved accuracy. With built-in divergence detection, trend analysis, and customizable smoothing, this tool is perfect for traders looking to refine their entries and exits based on adaptive oscillation mechanics.
🚀 Key Features :
🔹 Adaptive Frequency Detection – Uses Hilbert Transform principles to dynamically determine market cycle length for precise oscillator calculation.
⚙️ Customizable Smoothing – Option to apply a Hull Moving Average (HMA) for enhanced signal clarity.
📈 Divergence Detection – Identifies bullish and bearish divergences with visual markers, helping traders spot early trend reversals.
🟢 Overbought & Oversold Signals – Highlights extreme momentum conditions with adjustable thresholds.
🔔 Real-Time Alerts – Get notified for crossovers, divergences, and strong trend shifts directly on your TradingView chart.
🎨 Fully Customizable Appearance – Modify colors, divergence sensitivity, and smoothing options to fit your trading style.
🛠 How to Use :
Add the Adaptive Resonance Oscillator to your TradingView chart by clicking the ★ to favorite it.
Monitor the Charts , switch between smoothed and I smoothed modes to identify trend and price swings, use divergences and reversal signals for potential entry/exits.
Set alerts for bullish/bearish crossovers and divergence signals to stay ahead of market moves.
⚙ How It Works :
The indicator begins by applying a Hilbert Transform frequency estimation to the price series, identifying the dominant market cycle length. This is used to calculate a period for the RSI that matches its resonant frequency with the dominant market frequency, dynamically adjusting the Oscillator. The oscillator then applies an optional Hull Moving Average (HMA) smoothing for signal refinement. Additionally, the indicator scans for bullish and bearish divergences by comparing oscillator movements against price action, plotting signals accordingly. When overbought/oversold conditions or divergence events occur, alerts are triggered to notify the trader in real time.
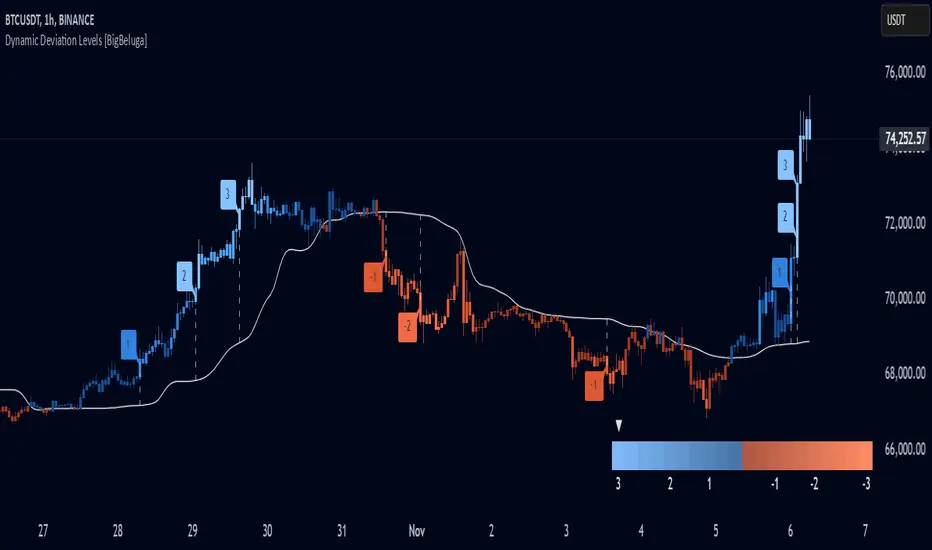
Dynamic Deviation Levels [BigBeluga]Dynamic Deviation Levels is an innovative indicator designed to analyze price deviations relative to a smoothed midline. It provides traders with visual cues for overbought/oversold zones, price momentum, levels through labeled deviations and gradient candle coloring.
🔵Key Features:
Smoothed Midline:
A central line calculated as a smoothed median of the price source, serving as the baseline for price deviation analysis.
Dynamic Deviation Levels:
- Three deviation levels are plotted above and below the midline, with labels (1, 2, 3, -1, -2, -3) marking significant price movements.
- Helps traders identify overbought and oversold market conditions.
Heat-Colored Candles:
- Candle colors shift in intensity based on the deviation level, with four gradient shades for both upward and downward movements.
- Quickly highlights market extremes or stable zones.
Interactive Color Scale:
- A gradient scale at the bottom right of the chart visually represents deviation values.
- A triangle marker indicates the current price deviation in real time.
Optional Deviation Levels Display:
- Traders can enable all dynamic levels on the chart to visualize support and resistance areas dynamically.
🔵Usage and Benefits:
Identify Overbought/Oversold Zones: Use labeled deviation levels and heat-colored candles to spot stretched market conditions.
Track Trend Reversals and Momentum: Monitor price interactions with deviation levels for potential trend continuation or reversal signals.
Real-Time Deviation Insights: Leverage the color scale and triangle marker for live deviation tracking and actionable insights.
Map Dynamic Support and Resistance: Enable dynamic levels to highlight key areas where price reactions are likely to occur.
Dynamic Deviation Levels is an indispensable tool for traders aiming to combine price dynamics, momentum analysis, and visual clarity in their trading strategies.
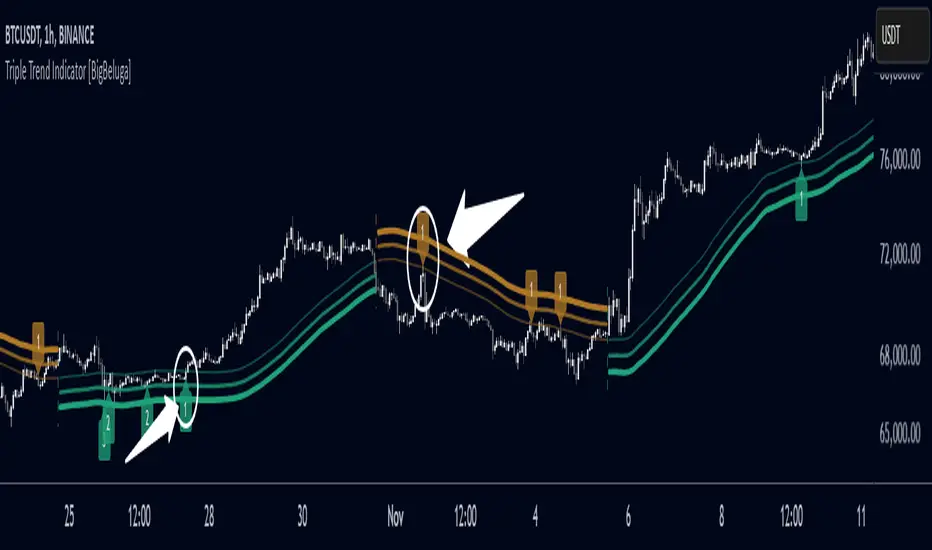
Triple Trend Indicator [BigBeluga]Triple Trend Indicator is a versatile trend-following tool designed to help traders identify trend strength and potential pullback levels using a three-band system. Each band represents a varying degree of price deviation from the mean, providing progressively stronger trend signals.
🔵 Key Features:
Three Adaptive Bands:
The indicator dynamically calculates three bands (1, 2, and 3) based on moving averages (SMA, EMA, WMA) and ATR multipliers.
Bands are positioned below the price in an uptrend and above the price in a downtrend, offering clear trend direction visualization.
Signal System:
Signals are generated when price interacts with the bands:
Signal 1: Triggered when the price touches Band 1, indicating a minor pullback within the trend.
Signal 2: Triggered at Band 2, showing a stronger price deviation and trend confirmation.
Signal 3: Triggered at Band 3, representing the most significant price deviation and strongest trend signal.
The further the price deviates from the mean, the stronger the trend signal, with Signal 3 being the most robust.
Color-Coded Bands:
Bands dynamically change color based on the trend direction:
Green bands signify an uptrend.
Brown bands signify a downtrend.
Dynamic Trend Line Changes:
Dashed lines highlight trend changes, helping traders visualize key turning points in the market.
🔵 Usage:
Use the bands to identify trend direction and strength.
Monitor the signal system to assess the level of price deviation and potential pullback strength.
Combine Signal 1, 2, and 3 to confirm trend momentum:
Signal 1 suggests a weaker pullback and continuation.
Signal 2 indicates a stronger trend confirmation.
Signal 3 highlights the strongest momentum and potential exhaustion points.
Utilize the color-coded bands for an intuitive understanding of current market conditions.
The Triple Trend Indicator is an ideal tool for trend traders looking for structured signals and dynamic support and resistance levels to optimize entries and exits.
Auto-Adjusting Kalman Filter by TenozenNew year, new indicator! Auto-Adjusting Kalman Filter is an indicator designed to provide an adaptive approach to trend analysis. Using the Kalman Filter (a recursive algorithm used in signal processing), this algo dynamically adjusts to market conditions, offering traders a reliable way to identify trends and manage risk! In other words, it's a remaster of my previous indicator, Kalman Filter by Tenozen.
What's the difference with the previous indicator (Kalman Filter by Tenozen)?
The indicator adjusts its parameters (Q and R) in real-time using the Average True Range (ATR) as a measure of market volatility. This ensures the filter remains responsive during high-volatility periods and smooth during low-volatility conditions, optimizing its performance across different market environments.
The filter resets on a user-defined timeframe, aligning its calculations with dominant trends and reducing sensitivity to short-term noise. This helps maintain consistency with the broader market structure.
A confidence metric, derived from the deviation of price from the Kalman filter line (measured in ATR multiples), is visualized as a heatmap:
Green : Bullish confidence (higher values indicate stronger trends).
Red : Bearish confidence (higher values indicate stronger trends).
Gray : Neutral zone (low confidence, suggesting caution).
This provides a clear, objective measure of trend strength.
How it works?
The Kalman Filter estimates the "true" price by filtering out market noise. It operates in two steps, that is, prediction and update. Prediction is about projection the current state (price) forward. Update is about adjusting the prediction based on the latest price data. The filter's parameters (Q and R) are scaled using normalized ATR, ensuring adaptibility to changing market conditions. So it means that, Q (Process Noise) increases during high volatility, making the filter more responsive to price changes and R (Measurement Noise) increases during low volatility, smoothing out the filter to avoid overreacting to minor fluctuations. Also, the trend confidence is calculated based on the deviation of price from the Kalman filter line, measured in ATR multiples, this provides a quantifiable measure of trend strength, helping traders assess market conditions objectively.
How to use?
Use the Kalman Filter line to identify the prevailing trend direction. Trade in alignment with the filter's slope for higher-probability setups.
Look for pullbacks toward the Kalman Filter line during strong trends (high confidence zones)
Utilize the dynamic stop-loss and take-profit levels to manage risk and lock in profits
Confidence Heatmap provides an objective measure of market sentiment, helping traders avoid low-confidence (neutral) zones and focus on high-probability opportunities
Guess that's it! I hope this indicator helps! Let me know if you guys got some feedback! Ciao!

Market Pressure Index [AlgoAlpha]The Market Pressure Index is a cutting-edge trading tool designed to measure and visualize bullish and bearish momentum through a unique blend of volatility analysis and dynamic smoothing techniques. This indicator provides traders with an intuitive understanding of market pressure, making it easier to identify trend shifts, breakout opportunities, and key moments to take profit. Perfect for scalpers and swing traders looking for a strategic edge in volatile markets.
Key Features:
🔎 Bullish and Bearish Volatility Separation : Dynamically calculates and displays bullish and bearish momentum separately, helping traders assess market direction with precision.
🎨 Customizable Appearance: Set your preferred colors for bullish and bearish signals to match your chart's theme.
📊 Deviation-Based Upper Band : Tracks extreme volatility levels using a configurable deviation multiplier, highlighting potential breakout points.
📈 Real-Time Signal Alerts : Provides alerts for bullish and bearish crossovers, as well as take-profit signals, ensuring you never miss key market movements.
⚡ Gradient-Based Visualization : Uses color gradients to depict the intensity of market pressure, making it easy to spot changes in momentum at a glance.
How to Use:
Add the Indicator : Add the Market Pressure Index to your TradingView chart by clicking the star icon. Customize inputs like the pressure lookback period, deviation settings, and colors to fit your trading style.
Interpret the Signals : Monitor the bullish and bearish momentum columns to gauge market direction. Look for crossovers to signal potential trend changes.
Take Action : Use alerts for breakouts above the upper band or for take-profit levels to enhance your trade execution.
How It Works:
The Market Pressure Index separates bullish and bearish momentum by analyzing price movement (close vs. open) and volatility. These values are smoothed using Hull Moving Averages (HMA) to highlight trends while minimizing noise. A deviation-based upper band dynamically tracks market extremes, signaling breakout zones. Color gradients depict the intensity of momentum, offering a clear, visually intuitive representation of market pressure. Alerts are triggered when significant crossovers or take-profit conditions occur, giving traders actionable insights without constant chart monitoring.

Adaptive Fractal Grid Scalping StrategyThis Pine Script v6 component implements an "Adaptive Fractal Grid Scalping Strategy" with an added volatility threshold feature.
Here's how it works:
Fractal Break Detection: Uses ta.pivothigh and ta.pivotlow to identify local highs and lows.
Volatility Clustering: Measures volatility using the Average True Range (ATR).
Adaptive Grid Levels: Dynamically adjusts grid levels based on ATR and user-defined multipliers.
Directional Bias Filter: Uses a Simple Moving Average (SMA) to determine trend direction.
Volatility Threshold: Introduces a new input to specify a minimum ATR value required to activate the strategy.
Trade Execution Logic: Places limit orders at grid levels based on trend direction and fractal levels, but only when ATR exceeds the volatility threshold.
Profit-Taking and Stop-Loss: Implements profit-taking at grid levels and a trailing stop-loss based on ATR.
How to Use
Inputs: Customize the ATR length, SMA length, grid multipliers, trailing stop multiplier, and volatility threshold through the input settings.
Visuals: The script plots fractal points and grid levels on the chart for easy visualization.
Trade Signals: The strategy automatically places buy/sell orders based on the detected fractals, trend direction, and volatility threshold.
Profit and Risk Management: The script includes logic for taking profits and setting stop-loss levels to manage trades effectively.
This strategy is designed to capitalize on micro-movements during high volatility and avoid overtrading during low-volatility trends. Adjust the input parameters to suit your trading style and market conditions.

Smart Money Breakout Signals [AlgoAlpha]Introducing the Smart Money Breakout Signals, a cutting-edge trading indicator designed to identify key structural shifts and breakout opportunities in the market. This tool leverages a blend of smart money concepts like Break of Structure (BOS) and Change of Character (CHoCH) to provide traders with actionable insights into market direction and potential entry or exit points.
Key Features :
✨ Market Structure Analysis : Automatically detects and labels BOS and CHoCH for trend confirmation and reversals.
🎨 Customizable Visualization : Tailor bullish and bearish colors for breakout lines and signals to suit your preferences.
📊 Dynamic Take-Profit Targets : Displays three tiered take-profit levels based on breakout volatility.
🔔 Real-Time Alerts : Stay ahead of the game with notifications for bullish and bearish breakouts.
📋 Performance Dashboard : Monitor signal statistics, including win rates and total signals, directly on your chart.
How to Use :
Add the Indicator : Add the script to your favourites ⭐ and customize settings like market structure horizon and confirmation type.
Monitor Breakouts : Observe BOS and CHoCH labels to identify potential trend shifts. Use the breakout lines and tiered take-profit levels to plan trades effectively.
Set Alerts : Enable alerts for bullish or bearish breakouts to act on opportunities without constant monitoring.
How It Works :
The indicator identifies market structure by analyzing pivot highs and lows over a user-defined time horizon. A breakout is confirmed based on either candle closes or wicks surpassing previous pivot points. Upon detection, the script generates signals with breakout lines and calculates take-profit targets based on the distance from the breakout level. A built-in dashboard tracks performance metrics like total signals and win rates, giving traders real-time feedback on strategy effectiveness.

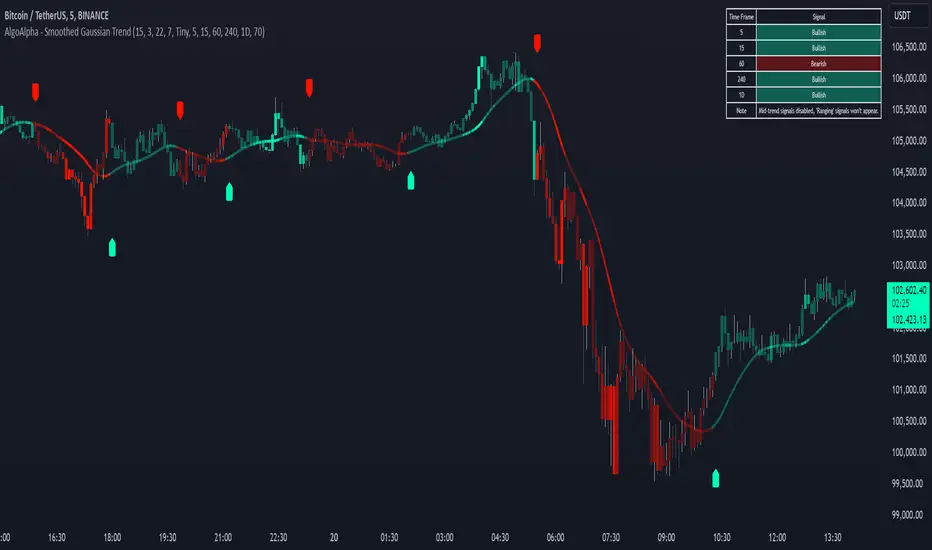
Smoothed Gaussian Trend Filter [AlgoAlpha]Experience seamless trend detection and market analysis with the Smoothed Gaussian Trend Filter by AlgoAlpha! This cutting-edge indicator combines advanced Gaussian filtering with linear regression smoothing to identify and enhance market trends, making it an essential tool for traders seeking precise and actionable signals.
Key Features :
🔍 Gaussian Trend Filtering: Utilizes a customizable Gaussian filter with adjustable length and pole settings for tailored smoothing and trend identification.
📊 Linear Regression Smoothing: Reduces noise and further refines the Gaussian output with user-defined smoothing length and offset, ensuring clarity in trend representation.
✨ Dynamic Visual Highlights: Highlights trends and signals based on volume intensity, allowing for real-time insights into market behavior.
📉 Choppy Market Detection: Identifies ranging or choppy markets, helping traders avoid false signals.
🔔 Custom Alerts: Set alerts for bullish and bearish signals, trend reversals, or choppy market conditions to stay on top of trading opportunities.
🎨 Color-Coded Visuals: Fully customizable colors for bullish and bearish signals, ensuring clear and intuitive chart analysis.
How to Use :
Add the Indicator: Add it to your favorites and apply it to your TradingView chart.
Interpret the Chart: Observe the trend line for directional changes and use the accompanying buy/sell signals for entry and exit opportunities. Choppy market conditions are flagged for additional caution.
Set Alerts: Enable alerts for trend signals or choppy market detections to act promptly without constant chart monitoring.
How It Works :
The Smoothed Gaussian Trend Filter uses a combination of advanced smoothing techniques to identify trends and enhance market clarity. First, a Gaussian filter is applied to price data, using a user-defined length (Gaussian length) and poles (smoothness level) to calculate an alpha value that determines the degree of smoothing. This creates a refined trend line that minimizes noise while preserving key market movements. The output is then further processed using linear regression smoothing, allowing traders to adjust the length and offset to flatten minor oscillations and emphasize the dominant trend. To incorporate market activity, volume intensity is analyzed through a normalized Hull Moving Average (HMA), dynamically adjusting the trend line's color transparency based on trading activity. The indicator also identifies trend direction by comparing the smoothed trend line with a calculated SuperTrend-style level, generating clear trend regimes and highlighting ranging or choppy conditions where trends are less reliable and avoiding false signals. This seamless integration of Gaussian smoothing, regression analysis, and volume dynamics provides traders with a powerful and intuitive tool for market analysis.