Çoklu İndikatör Alım-Satım Sinyalleriİndikatör hala:
5 farklı teknik göstergenin sinyallerini birleştirir
0-5 arası puanlama yapar
Basit ve anlaşılır alım-satım sinyalleri üretir
GÜÇLÜ AL/SAT, AL/SAT, ZAYIF AL/SAT veya BEKLE şeklinde etiketler gösterir
Sinyalin gücüne göre çubuk grafik renklendirir
Volatility

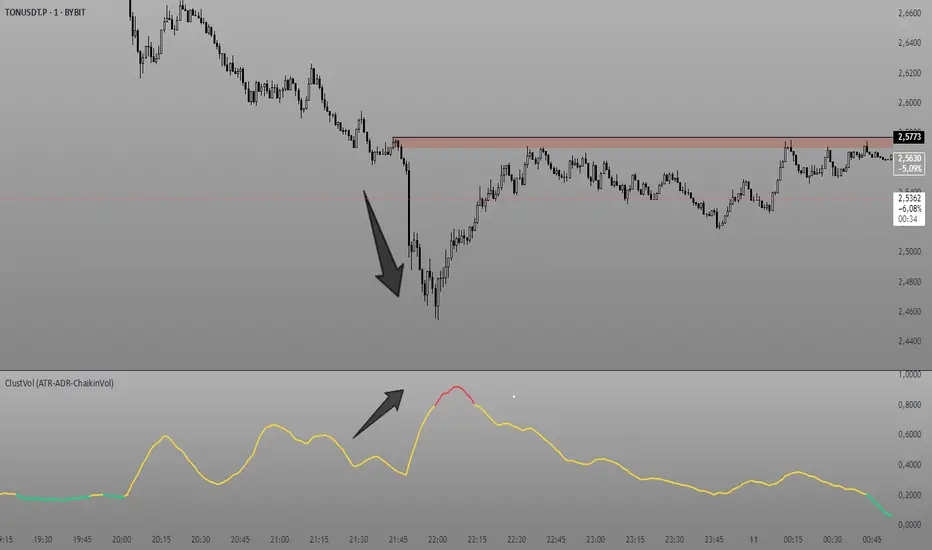
Clustering Volatility (ATR-ADR-ChaikinVol) [Sam SDF-Solutions]The Clustering Volatility indicator is designed to evaluate market volatility by combining three widely used measures: Average True Range (ATR), Average Daily Range (ADR), and the Chaikin Oscillator.
Each indicator is normalized using one of the available methods (MinMax, Rank, or Z-score) to create a unified metric called the Score. This Score is further smoothed with an Exponential Moving Average (EMA) to reduce noise and provide a clearer view of market conditions.
Key Features:
Multi-Indicator Integration: Combines ATR, ADR, and the Chaikin Oscillator into a single Score that reflects overall market volatility.
Flexible Normalization: (Supports three normalization methods)
MinMax: Scales values between the observed minimum and maximum.
Rank: Normalizes based on the relative rank within a moving window.
Z-score: Standardizes values using mean and standard deviation.
Dynamic Window Selection: Offers an automatic window selection option based on a specified lookback period, or a fixed window size can be used.
Customizable Weights: Allows the user to assign individual weights to ATR, ADR, and the Chaikin Oscillator. Optionally, weights can be normalized to sum to 1.
Score Smoothing: Applies an EMA to the computed Score to smooth out short-term fluctuations and reduce market noise.
Cluster Visualization: Divides the smoothed Score into a number of clusters, each represented by a distinct color. These colors can be applied to the price bars (if enabled) for an immediate visual indication of the current volatility regime.
How It Works:
Input & Window Setup: Users set parameters for indicator periods, normalization methods, weights, and window size. The indicator can automatically determine the analysis window based on the number of lookback days.
Calculation of Metrics: The indicator computes the ATR, ADR (as the average of bar ranges), and the Chaikin Oscillator (based on the difference between short and long EMAs of the Accumulation/Distribution line).
Normalization & Scoring: Each indicator’s value is normalized and then weighted to form a raw Score. This raw Score is scaled to a range using statistics from the chosen window.
Smoothing & Clustering: The raw Score is smoothed using an EMA. The resulting smoothed Score is then multiplied by the number of clusters to assign a cluster index, which is used to choose a color for visual signals.
Visualization: The smoothed Score is plotted on the chart with a color that changes based on its value (e.g., lime for low, red for high, yellow for intermediate values). Optionally, the price bars are colored according to the assigned cluster.
_____________
This indicator is ideal for traders seeking a quick and clear assessment of market volatility. By integrating multiple volatility measures into one comprehensive Score, it simplifies analysis and aids in making more informed trading decisions.
For more detailed instructions, please refer to the guide here:
Clustering & Divergences (RSI-Stoch-CCI) [Sam SDF-Solutions]The Clustering & Divergences (RSI-Stoch-CCI) indicator is a comprehensive technical analysis tool that consolidates three popular oscillators—Relative Strength Index (RSI), Stochastic, and Commodity Channel Index (CCI)—into one unified metric called the Score. This Score offers traders an aggregated view of market conditions, allowing them to quickly identify whether the market is oversold, balanced, or overbought.
Functionality:
Oscillator Clustering: The indicator calculates the values of RSI, Stochastic, and CCI using user-defined periods. These oscillator values are then normalized using one of three available methods: MinMax, Z-Score, or Z-Bins.
Score Calculation: Each normalized oscillator value is multiplied by its respective weight (which the user can adjust), and the weighted values are summed to generate an overall Score. This Score serves as a single, interpretable metric representing the combined oscillator behavior.
Market Clustering: The indicator performs clustering on the Score over a configurable window. By dividing the Score range into a set number of clusters (also configurable), the tool visually represents the market’s state. Each cluster is assigned a unique color so that traders can quickly see if the market is trending toward oversold, balanced, or overbought conditions.
Divergence Detection: The script automatically identifies both Regular and Hidden divergences between the price action and the Score. By using pivot detection on both price and Score data, the indicator marks potential reversal signals on the chart with labels and connecting lines. This helps in pinpointing moments when the price and the underlying oscillator dynamics diverge.
Customization Options: Users have full control over the indicator’s behavior. They can adjust:
The periods for each oscillator (RSI, Stochastic, CCI).
The weights applied to each oscillator in the Score calculation.
The normalization method and its manual boundaries.
The number of clusters and whether to invert the cluster order.
Parameters for divergence detection (such as pivot sensitivity and the minimum/maximum bar distance between pivots).
Visual Enhancements:
Depending on the user’s preference, either the Score or the Cluster Index (derived from the clustering process) is plotted on the chart. Additionally, the script changes the color of the price bars based on the identified cluster, providing an at-a-glance visual cue of the current market regime.
Logic & Methodology:
Input Parameters: The script starts by accepting user inputs for clustering settings, oscillator periods, weights, divergence detection, and manual boundary definitions for normalization.
Oscillator Calculation & Normalization: It computes RSI, Stochastic, and CCI values from the price data. These values are then normalized using either the MinMax method (scaling between a lower and upper band) or the Z-Score method (standardizing based on mean and standard deviation), or using Z-Bins for an alternative scaling approach.
Score Computation: Each normalized oscillator is multiplied by its corresponding weight. The sum of these products results in the overall Score that represents the combined oscillator behavior.
Clustering Algorithm: The Score is evaluated over a moving window to determine its minimum and maximum values. Using these values, the script calculates a cluster index that divides the Score into a predefined number of clusters. An option to invert the cluster calculation is provided to adjust the interpretation of the clustering.
Divergence Analysis: The indicator employs pivot detection (using left and right bar parameters) on both the price and the Score. It then compares recent pivot values to detect regular and hidden divergences. When a divergence is found, the script plots labels and optional connecting lines to highlight these key moments on the chart.
Plotting: Finally, based on the user’s selection, the indicator plots either the Score or the Cluster Index. It also overlays manual boundary lines (for the chosen normalization method) and adjusts the bar colors according to the cluster to provide clear visual feedback on market conditions.
_________
By integrating multiple oscillator signals into one cohesive tool, the Clustering & Divergences (RSI-Stoch-CCI) indicator helps traders minimize subjective analysis. Its dynamic clustering and automated divergence detection provide a streamlined method for assessing market conditions and potentially enhancing the accuracy of trading decisions.
For further details on using this indicator, please refer to the guide available at:

AI Adaptive Oscillator [PhenLabs]📊 Algorithmic Adaptive Oscillator
Version: PineScript™ v6
📌 Description
The AI Adaptive Oscillator is a sophisticated technical indicator that employs ensemble learning and adaptive weighting techniques to analyze market conditions. This innovative oscillator combines multiple traditional technical indicators through an AI-driven approach that continuously evaluates and adjusts component weights based on historical performance. By integrating statistical modeling with machine learning principles, the indicator adapts to changing market dynamics, providing traders with a responsive and reliable tool for market analysis.
🚀 Points of Innovation:
Ensemble learning framework with adaptive component weighting
Performance-based scoring system using directional accuracy
Dynamic volatility-adjusted smoothing mechanism
Intelligent signal filtering with cooldown and magnitude requirements
Signal confidence levels based on multi-factor analysis
🔧 Core Components
Ensemble Framework : Combines up to five technical indicators with performance-weighted integration
Adaptive Weighting : Continuous performance evaluation with automated weight adjustment
Volatility-Based Smoothing : Adapts sensitivity based on current market volatility
Pattern Recognition : Identifies potential reversal patterns with signal qualification criteria
Dynamic Visualization : Professional color schemes with gradient intensity representation
Signal Confidence : Three-tiered confidence assessment for trading signals
🔥 Key Features
The indicator provides comprehensive market analysis through:
Multi-Component Ensemble : Integrates RSI, CCI, Stochastic, MACD, and Volume-weighted momentum
Performance Scoring : Evaluates each component based on directional prediction accuracy
Adaptive Smoothing : Automatically adjusts based on market volatility
Pattern Detection : Identifies potential reversal patterns in overbought/oversold conditions
Signal Filtering : Prevents excessive signals through cooldown periods and minimum change requirements
Confidence Assessment : Displays signal strength through intuitive confidence indicators (average, above average, excellent)
🎨 Visualization
Gradient-Filled Oscillator : Color intensity reflects strength of market movement
Clear Signal Markers : Distinct bullish and bearish pattern signals with confidence indicators
Range Visualization : Clean representation of oscillator values from -6 to 6
Zero Line : Clear demarcation between bullish and bearish territory
Customizable Colors : Color schemes that can be adjusted to match your chart style
Confidence Symbols : Intuitive display of signal confidence (no symbol, +, or ++) alongside direction markers
📖 Usage Guidelines
⚙️ Settings Guide
Color Settings
Bullish Color
Default: #2b62fa (Blue)
This setting controls the color representation for bullish movements in the oscillator. The color appears when the oscillator value is positive (above zero), with intensity indicating the strength of the bullish momentum. A brighter shade indicates stronger bullish pressure.
Bearish Color
Default: #ce9851 (Amber)
This setting determines the color representation for bearish movements in the oscillator. The color appears when the oscillator value is negative (below zero), with intensity reflecting the strength of the bearish momentum. A more saturated shade indicates stronger bearish pressure.
Signal Settings
Signal Cooldown (bars)
Default: 10
Range: 1-50
This parameter sets the minimum number of bars that must pass before a new signal of the same type can be generated. Higher values reduce signal frequency and help prevent overtrading during choppy market conditions. Lower values increase signal sensitivity but may generate more false positives.
Min Change For New Signal
Default: 1.5
Range: 0.5-3.0
This setting defines the minimum required change in oscillator value between consecutive signals of the same type. It ensures that new signals represent meaningful changes in market conditions rather than minor fluctuations. Higher values produce fewer but potentially higher-quality signals, while lower values increase signal frequency.
AI Core Settings
Base Length
Default: 14
Minimum: 2
This fundamental setting determines the primary calculation period for all technical components in the ensemble (RSI, CCI, Stochastic, etc.). It represents the lookback window for each component’s base calculation. Shorter periods create a more responsive but potentially noisier oscillator, while longer periods produce smoother signals with potential lag.
Adaptive Speed
Default: 0.1
Range: 0.01-0.3
Controls how quickly the oscillator adapts to new market conditions through its volatility-adjusted smoothing mechanism. Higher values make the oscillator more responsive to recent price action but potentially more erratic. Lower values create smoother transitions but may lag during rapid market changes. This parameter directly influences the indicator’s adaptiveness to market volatility.
Learning Lookback Period
Default: 150
Minimum: 10
Determines the historical data range used to evaluate each ensemble component’s performance and calculate adaptive weights. This setting controls how far back the AI “learns” from past performance to optimize current signals. Longer periods provide more stable weight distribution but may be slower to adapt to regime changes. Shorter periods adapt more quickly but may overreact to recent anomalies.
Ensemble Size
Default: 5
Range: 2-5
Specifies how many technical components to include in the ensemble calculation.
Understanding The Interaction Between Settings
Base Length and Learning Lookback : The base length determines the reactivity of individual components, while the lookback period determines how their weights are adjusted. These should be balanced according to your timeframe - shorter timeframes benefit from shorter base lengths, while the lookback should generally be 10-15 times the base length for optimal learning.
Adaptive Speed and Signal Cooldown : These settings control sensitivity from different angles. Increasing adaptive speed makes the oscillator more responsive, while reducing signal cooldown increases signal frequency. For conservative trading, keep adaptive speed low and cooldown high; for aggressive trading, do the opposite.
Ensemble Size and Min Change : Larger ensembles provide more stable signals, allowing for a lower minimum change threshold. Smaller ensembles might benefit from a higher threshold to filter out noise.
Understanding Signal Confidence Levels
The indicator provides three distinct confidence levels for both bullish and bearish signals:
Average Confidence (▲ or ▼) : Basic signal that meets the minimum pattern and filtering criteria. These signals indicate potential reversals but with moderate confidence in the prediction. Consider using these as initial alerts that may require additional confirmation.
Above Average Confidence (▲+ or ▼+) : Higher reliability signal with stronger underlying metrics. These signals demonstrate greater consensus among the ensemble components and/or stronger historical performance. They offer increased probability of successful reversals and can be traded with less additional confirmation.
Excellent Confidence (▲++ or ▼++) : Highest quality signals with exceptional underlying metrics. These signals show strong agreement across oscillator components, excellent historical performance, and optimal signal strength. These represent the indicator’s highest conviction trade opportunities and can be prioritized in your trading decisions.
Confidence assessment is calculated through a multi-factor analysis including:
Historical performance of ensemble components
Degree of agreement between different oscillator components
Relative strength of the signal compared to historical thresholds
✅ Best Use Cases:
Identify potential market reversals through oscillator extremes
Filter trade signals based on AI-evaluated component weights
Monitor changing market conditions through oscillator direction and intensity
Confirm trade signals from other indicators with adaptive ensemble validation
Detect early momentum shifts through pattern recognition
Prioritize trading opportunities based on signal confidence levels
Adjust position sizing according to signal confidence (larger for ++ signals, smaller for standard signals)
⚠️ Limitations
Requires sufficient historical data for accurate performance scoring
Ensemble weights may lag during dramatic market condition changes
Higher ensemble sizes require more computational resources
Performance evaluation quality depends on the learning lookback period length
Even high confidence signals should be considered within broader market context
💡 What Makes This Unique
Adaptive Intelligence : Continuously adjusts component weights based on actual performance
Ensemble Methodology : Combines strength of multiple indicators while minimizing individual weaknesses
Volatility-Adjusted Smoothing : Provides appropriate sensitivity across different market conditions
Performance-Based Learning : Utilizes historical accuracy to improve future predictions
Intelligent Signal Filtering : Reduces noise and false signals through sophisticated filtering criteria
Multi-Level Confidence Assessment : Delivers nuanced signal quality information for optimized trading decisions
🔬 How It Works
The indicator processes market data through five main components:
Ensemble Component Calculation :
Normalizes traditional indicators to consistent scale
Includes RSI, CCI, Stochastic, MACD, and volume components
Adapts based on the selected ensemble size
Performance Evaluation :
Analyzes directional accuracy of each component
Calculates continuous performance scores
Determines adaptive component weights
Oscillator Integration :
Combines weighted components into unified oscillator
Applies volatility-based adaptive smoothing
Scales final values to -6 to 6 range
Signal Generation :
Detects potential reversal patterns
Applies cooldown and magnitude filters
Generates clear visual markers for qualified signals
Confidence Assessment :
Evaluates component agreement, historical accuracy, and signal strength
Classifies signals into three confidence tiers (average, above average, excellent)
Displays intuitive confidence indicators (no symbol, +, ++) alongside direction markers
💡 Note:
The AI Adaptive Oscillator performs optimally when used with appropriate timeframe selection and complementary indicators. Its adaptive nature makes it particularly valuable during changing market conditions, where traditional fixed-weight indicators often lose effectiveness. The ensemble approach provides a more robust analysis by leveraging the collective intelligence of multiple technical methodologies. Pay special attention to the signal confidence indicators to optimize your trading decisions - excellent (++) signals often represent the most reliable trade opportunities.

Combined BB & New SuperTrend StrategyExplanation
Bollinger Bands Section:
A customizable moving average (with multiple options) calculates the basis, upper, and lower bands. These are plotted on the chart with a filled area between them.
New SuperTrend Section:
The new SuperTrend code is integrated after renaming its variables (prefixed with st_) to avoid conflicts. This section calculates ATR-based stop levels, determines the trend direction, and generates buy/sell signals when the trend reverses. Optional labels and visual fills are also provided.
Trading Logic:
When a bullish SuperTrend signal occurs (transition from bearish to bullish), the script closes any short position and enters a long position. Conversely, when a bearish signal occurs, it closes the long position and enters a short. Additionally, if the price touches the Bollinger Bands (upper for longs, lower for shorts), the respective positions are exited.
This combined script should now compile without errors and use your new SuperTrend indicator for trade signals while retaining the Bollinger Bands exit conditions. Let me know if you need further modifications or explanations!

Spot - Fut spread v2"Spot - Fut Spread v2"
indicator is designed to track the difference between spot and futures prices on various exchanges. It automatically identifies the corresponding instrument (spot or futures) based on the current symbol and calculates the spread between the prices. This tool is useful for analyzing the delta between spot and futures markets, helping traders assess arbitrage opportunities and market sentiment.
Key Features:
- Automatic detection of spot and futures assets based on the current chart symbol.
- Supports multiple exchanges, including Binance, Bybit, OKX, MEXC, BingX, Bitget, BitMEX, Deribit, Whitebit, Gate.io, and HTX.
- Flexible asset selection: the ability to manually choose the second asset if automatic selection is disabled.
- Spread calculation between futures and spot prices.
- Moving average of the spread for smoothing data and trend analysis.
Flexible visualization:
- Color indication of positive and negative spread.
- Adjustable background transparency.
- Text label displaying the current spread and moving average values.
- Error alerts in case of invalid data.
How the Indicator Works:
- Determines whether the current symbol is a futures contract.
- Based on this, selects the corresponding spot or futures symbol.
- Retrieves price data and calculates the spread between them.
- Displays the spread value and its moving average.
- The chart background color changes based on the spread value (positive or negative).
- In case of an error, the indicator provides an alert with an explanation.
Customization Parameters:
-Exchange selection: the ability to specify a particular exchange from the list.
- Automatic pair selection: enable or disable automatic selection of the second asset.
- Moving average period: user-defined.
- Colors for positive and negative spread values.
- Moving average color.
- Background transparency.
- Background coloring source (based on spread or its moving average).
Application:
The indicator is suitable for traders who analyze the difference between spot and futures prices, look for arbitrage opportunities, and assess the premium or discount of futures relative to the spot market.
----------------------------------------------------------------------------------------------------
**"Spot - Fut Spread v2"** предназначен для отслеживания разницы между ценами на спотовом и фьючерсном рынках на различных биржах. Он автоматически определяет соответствующий инструмент (спот или фьючерс) на основе текущего символа и рассчитывает спред между ценами. Этот инструмент полезен для анализа дельты между спотовым и фьючерсным рынками, помогая трейдерам оценивать арбитражные возможности и рыночные настроения.
### **Основные функции:**
- Автоматическое определение спотовых и фьючерсных активов на основе текущего символа графика.
- Поддержка нескольких бирж, включая **Binance, Bybit, OKX, MEXC, BingX, Bitget, BitMEX, Deribit, Whitebit, Gate.io и HTX**.
- Гибкий выбор активов: возможность вручную выбрать второй актив, если автоматический выбор отключен.
- Расчет спреда между фьючерсными и спотовыми ценами.
- Скользящая средняя спреда для сглаживания данных и анализа трендов.
### **Гибкая визуализация:**
- Цветовая индикация положительного и отрицательного спреда.
- Регулируемая прозрачность фона.
- Текстовая метка с отображением текущего значения спреда и его скользящей средней.
- Оповещения об ошибках при наличии некорректных данных.
### **Как работает индикатор:**
1. Определяет, является ли текущий символ фьючерсным контрактом.
2. На основе этого выбирает соответствующий спотовый или фьючерсный актив.
3. Получает ценовые данные и рассчитывает разницу между ними.
4. Отображает значение спреда и его скользящую среднюю.
5. Фон графика меняет цвет в зависимости от значения спреда (положительный или отрицательный).
6. В случае ошибки индикатор выдает предупреждение с объяснением.
### **Настройки:**
- Выбор биржи: возможность указать конкретную биржу из списка.
- Автоматический выбор пары: включение или отключение автоматического выбора второго актива.
- Период скользящей средней: задается пользователем.
- Цвета для положительных и отрицательных значений спреда.
- Цвет скользящей средней.
- Прозрачность фона.
- Источник окраски фона (на основе спреда или его скользящей средней).
### **Применение:**
Этот индикатор подходит для трейдеров, анализирующих разницу между спотовыми и фьючерсными ценами, ищущих арбитражные возможности, а также оценивающих премию или дисконт фьючерсов относительно спотового рынка.

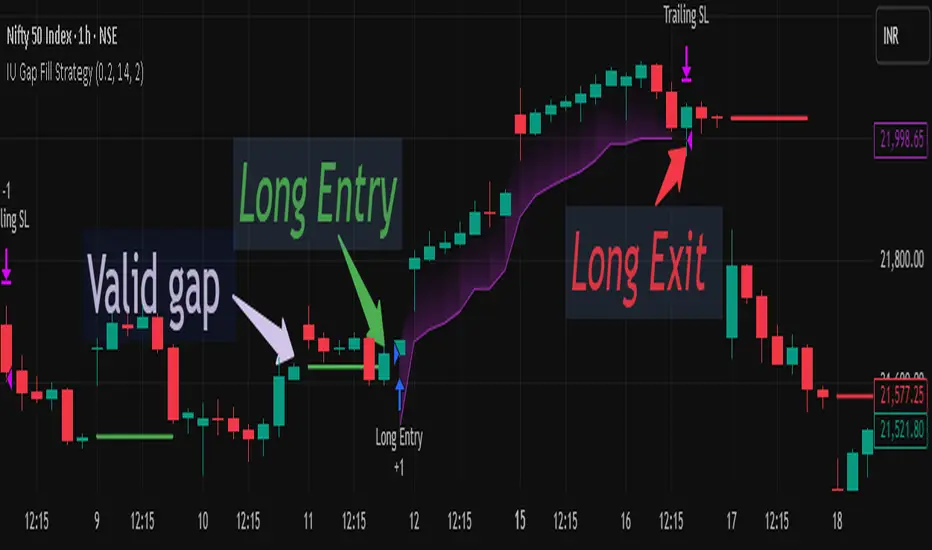
IU Gap Fill StrategyThe IU Gap Fill Strategy is designed to capitalize on price gaps that occur between trading sessions. It identifies gaps based on a user-defined percentage threshold and executes trades when the price fills the gap within a day. This strategy is ideal for traders looking to take advantage of market inefficiencies that arise due to overnight or session-based price movements. An ATR-based trailing stop-loss is incorporated to dynamically manage risk and lock in profits.
USER INPUTS
Percentage Difference for Valid Gap - Defines the minimum gap size in percentage terms for a valid trade setup. ( Default is 0.2 )
ATR Length - Sets the lookback period for the Average True Range (ATR) calculation. (default is 14 )
ATR Factor - Determines the multiplier for the trailing stop-loss, helping in risk management. ( Default is 2.00 )
LONG CONDITION
A gap-up occurs, meaning the current session opens above the previous session’s close.
The price initially dips below the previous session's close but then recovers and closes above it.
The gap meets the valid percentage threshold set by the user.
The bar is not the first or last bar of the session to avoid false signals.
SHORT CONDITION
A gap-down occurs, meaning the current session opens below the previous session’s close.
The price initially moves above the previous session’s close but then closes below it.
The gap meets the valid percentage threshold set by the user.
The bar is not the first or last bar of the session to avoid false signals.
LONG EXIT
An ATR-based trailing stop-loss is set below the entry price and dynamically adjusts upwards as the price moves in favor of the trade.
The position is closed when the trailing stop-loss is hit.
SHORT EXIT
An ATR-based trailing stop-loss is set above the entry price and dynamically adjusts downwards as the price moves in favor of the trade.
The position is closed when the trailing stop-loss is hit.
WHY IT IS UNIQUE
Precision in Identifying Gaps - The strategy focuses on real price gaps rather than minor fluctuations.
Dynamic Risk Management - Uses ATR-based trailing stop-loss to secure profits while allowing the trade to run.
Versatility - Works on stocks, indices, forex, and any market that experiences session-based gaps.
Optimized Entry Conditions - Ensures entries are taken only when the price attempts to fill the gap, reducing false signals.
HOW USERS CAN BENEFIT FROM IT
Enhance Trade Timing - Captures high-probability trade setups based on market inefficiencies caused by gaps.
Minimize Risk - The ATR trailing stop-loss helps protect gains and limit losses.
Works in Different Market Conditions - Whether markets are trending or consolidating, the strategy adapts to potential gap fill opportunities.
Fully Customizable - Users can fine-tune gap percentage, ATR settings, and stop-loss parameters to match their trading style.
Liquidity Market Seeking SwiftEdgeThis indicator is designed to identify potential liquidity levels on the chart by detecting swing highs and lows, which are often areas where stop-loss orders or significant orders accumulate. It visualizes these levels with horizontal lines and labels on the right side of the chart, color-coded based on volume to help traders understand where the market might seek liquidity.
How It Works
Swing Highs and Lows: The indicator uses the ta.pivothigh and ta.pivotlow functions to identify significant swing points over a user-defined lookback period (Swing Length). These points are considered potential liquidity levels where stop-loss orders might be placed.
Volume Analysis: The indicator compares the volume at each swing point to the average volume over a specified period (Volume Average Length). Levels with above-average volume are colored red, indicating higher liquidity, while levels with below-average volume are colored green.
Liquidity Visualization: Horizontal dashed lines are drawn at each identified level, extending across the chart. Labels on the right side display the estimated liquidity amount (simulated based on volume and a multiplier, Volume Multiplier for Liquidity).
Sell Signal: A "SELL NOW" label appears when the price approaches a liquidity level after an uptrend (detected using a simple moving average crossover). This suggests a potential reversal as the market may target liquidity at that level.
Strategy Concept: Market Seeking Liquidity
The indicator is based on the concept that markets often move toward areas of high liquidity, such as clusters of stop-loss orders or significant order accumulations. These liquidity pools are typically found around swing highs and lows, where traders place their stop-losses or large orders. By identifying these levels and highlighting those with higher volume (red lines), the indicator aims to show where the market might move to "grab" this liquidity. For example, after an uptrend, the market may reverse at a swing high to take out stop-losses above that level, providing liquidity for larger players to enter or exit positions.
Settings
Swing Length: The number of bars to look back for detecting swing highs and lows. Default is 20.
Liquidity Threshold: The price threshold for merging nearby levels to avoid duplicates. Default is 0.001.
Volume Average Length: The period for calculating the average volume to compare against. Default is 20.
Volume Multiplier for Liquidity: A multiplier to scale the volume into a simulated liquidity amount (displayed as "K"). Default is 1000.
Usage Notes
Use this indicator on any timeframe, though it may be more effective on higher timeframes (e.g., 1H, 4H) where swing points are more significant.
Red lines indicate levels with higher volume, suggesting stronger liquidity pools that the market might target.
Green lines indicate levels with lower volume, which may be less significant.
The "SELL NOW" signal is a basic example of how to use liquidity levels for trading decisions. It appears when the price approaches a liquidity level after an uptrend, but it should be used in conjunction with other analysis.
Adjust the Volume Multiplier for Liquidity to scale the displayed liquidity amounts based on your instrument (e.g., forex pairs may need a higher multiplier than indices).

HTF Trend Tracker [BigBeluga]HTF Trend Tracker is a higher timeframe (HTF) trend tracking indicator designed to help traders identify significant trends, key levels, and market sentiment. The indicator dynamically adapts to the current price action, using HTF highs and lows to display trend direction and strength with detailed visuals.
🔵 Key Features:
Dynamic Trend Detection:
Uptrend is identified when the price closes above the HTF high.
Downtrend is detected when the price closes below the HTF low.
Midline changes color dynamically based on the trend direction:
Bullish Green: Indicates an uptrend.
Bearish Red: Indicates a downtrend.
Historical and Active HTF Levels:
Historic HTF highs and lows are displayed as dotted lines.
Current active HTF high and low levels are shown as solid lines.
Timeframe labels (e.g., "1D High" or "1D Low") mark the active levels for clarity.
Trend Change Signals:
A green checkmark (✓) is plotted when an uptrend starts.
A red cross (✕) appears when a downtrend begins.
Trend-Based Candle Coloring:
Candle colors change dynamically based on the trend and the price's distance from the midline:
Intense Bullish Green: Price is far above the midline during an uptrend.
Intense Bearish Red: Price is far below the midline during a downtrend.
Neutral Gray: Price is near the midline.
Users can customize the colors to suit their preferences.
🔵 Usage:
Identify uptrends and downtrends using the midline's color and the position of the close relative to the HTF levels.
Use solid lines and timeframe labels to track current HTF high and low levels.
Observe dotted lines for historical HTF levels to understand past price behavior.
Watch for checkmark (✓) and cross (✕) signals to spot trend changes and key market shifts.
Monitor candle colors to gauge trend intensity and proximity to the midline:
Intense colors signal strong trends, while neutral gray indicates consolidation near the midline.
HTF Trend Tracker is an essential tool for traders aiming to follow higher timeframe trends, identify key levels, and make data-driven decisions based on price dynamics and trend strength. Its customizable features allow for flexible integration into any trading strategy.

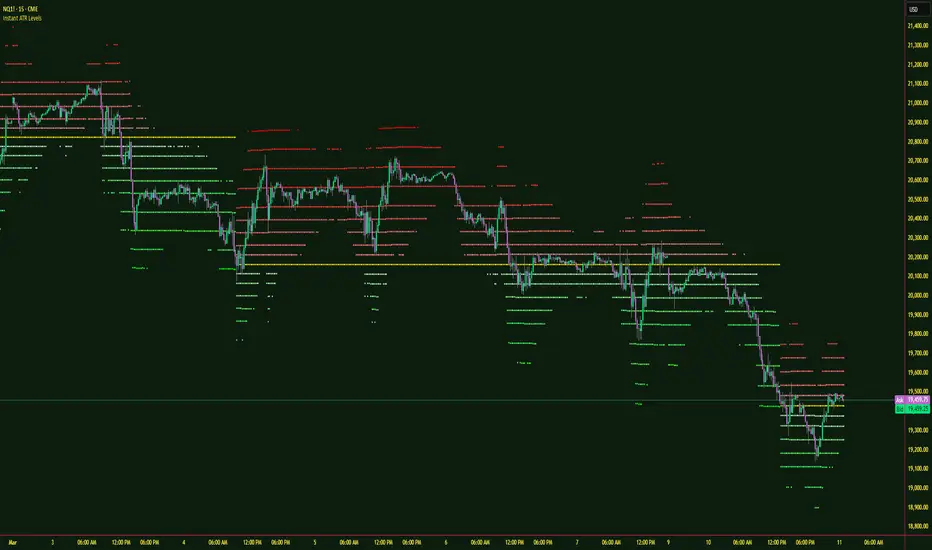
Ehlers Instantaneous Trendline ATR LevelsOverview
This sophisticated technical analysis tool merges John Ehlers' cutting-edge Instantaneous Trendline methodology with a dynamic ATR-based bands system. The indicator is designed to provide traders with a comprehensive view of market trends while accounting for volatility, making it suitable for both trending and ranging markets. Works on all timeframes and chart types.
Key Features in Detail
1. Ehlers Instantaneous Trendline Implementation
- Advanced algorithm that reduces lag typically associated with moving averages
- Built-in volatility filtering system to minimize false signals
- Adaptive to market conditions through dynamic calculations
- Real-time trend direction identification
2. Multi-layered ATR Band System
- Hierarchical band structure with 18 total bands (9 upper, 9 lower)
- Color-coded visualization system:
Upper bands: Red gradient (darker = further from trendline)
Lower bands: Green gradient (darker = further from trendline)
Central trendline: Yellow for optimal visibility
- Customizable multipliers for each band level
- Independent visibility controls for each band
Configuration Options
Trendline Settings:
- Lower values: More responsive to price changes and faster reacting to break in ATR filter
- Higher values: Smoother trendline with less noise and slower reacting to break in ATR filter
ATR Configuration:
Period: Customizable from 1 to any positive integer
- Longer periods: More stable volatility measurement
- Shorter periods: More reactive to recent volatility changes
Filter Multiplier: Fine-tune volatility filtering
- Higher values: More filtered signals leading to less shift in bands
- Lower values: More sensitive to price movements leading to more band shifts
Practical Applications
1. Trend Analysis
Use the central trendline for primary trend direction
Monitor band crossovers for trend strength confirmation
Track price position relative to bands for trend context
2. Volatility Assessment
Band spacing indicates current market volatility
Width between bands helps identify consolidation vs. expansion phases
Price Extremes
3. Support and Resistance
Each band acts as a dynamic support/resistance level
Multiple timeframe analysis possible adjusting for different timeframe ATR
SAR Distance with TrendBy comparing the closing price to the SAR, the indicator visually distinguishes bullish (price above SAR) from bearish (price below SAR) conditions. This immediate visual cue helps traders quickly assess the prevailing market trend.
A sudden change in the distance, especially when accompanied by a change in the trend color (from green to red or vice versa), could alert traders to a potential reversal. This can be used as an early warning to tighten stop-loss orders or exit a position.

TJR SEEK AND DESTROYTJR SEEK AND DESTROY – Intraday ICT Trading Tool
Built for day traders, TJR SEEK AND DESTROY combines Smart Money concepts like order blocks, fair value gaps, and liquidity sweeps with structure breaks and daily bias to pinpoint high-probability trades during US market hours (9:30–16:00). Ideal for scalping or intraday strategies on stocks, futures, or forex.
What Makes It Unique?
Unlike standalone ICT indicators, this script integrates:
Order Blocks with volume and range filters for precise support/resistance zones.
Fair Value Gaps (FVG) to spot pre-market price imbalances.
Break of Structure (BOS) and Liquidity Sweeps for trend and reversal signals.
A 1H MA-based Bias to align trades with the day’s direction.
BUY/SELL Labels triggered only when bias, BOS, and sweeps align, reducing noise.
How Does It Work?
Order Blocks: Marks zones with high volume (>1.5x 20-period SMA) and low range (<0.5x ATR20) as teal boxes—potential reversal points.
Fair Value Gap: Compares the prior day’s close to the current open (pre- or post-9:30), shown as a purple line and label (e.g., "FVG: 0.005").
Pivot Point: Calculates (prevHigh + prevLow + prevClose) / 3 from the prior day, plotted as an orange line for equilibrium.
Break of Structure: Detects crossovers of 5-bar highs/lows (gray lines), marked with red triangles.
Liquidity Sweeps: Tracks breaches of the prior day’s high/low (yellow lines), marked with yellow triangles.
Daily Bias: Uses 1H close vs. 20-period MA (blue line) for bullish (green background), bearish (red), or neutral (gray) context.
Signals: BUY (green label) when bias is bullish, price breaks up, and sweeps the prior high; SELL (red label) when bias is bearish, price breaks down, and sweeps the prior low.
How to Use It
Setup: Apply to 1M–15M charts for US session trading (9:30–16:00 EST).
Trading:
Wait for a BUY label after a yellow sweep triangle above the prior day’s high in a green (bullish) background.
Wait for a SELL label after a yellow sweep triangle below the prior day’s low in a red (bearish) background.
Use order blocks (teal boxes) as support/resistance for stop-loss or take-profit.
Markets: Best for SPY, ES futures, or forex pairs with US session volatility.
Underlying Concepts
Order Blocks: High-volume, low-range bars suggest institutional activity.
FVG: Gaps between close and open indicate imbalance to be filled.
BOS & Sweeps: Price breaking key levels signals momentum or stop-hunting.
Bias: 1H MA filters trades by broader trend.
Chart Setup
Displays order blocks (teal boxes), pivot (orange), open (purple), bias (colored background), BOS/sweeps (triangles), and signals (labels). Keep other indicators off for clarity.

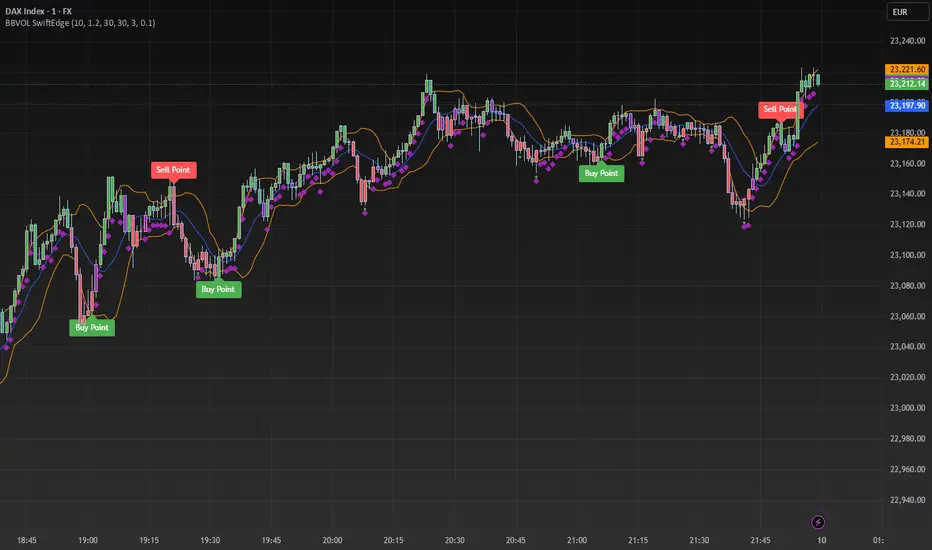
BBVOL SwiftEdgeBBVOL SwiftEdge – Precision Scalping with Volume and Trend Filtering
Optimized for scalping and short-term trading on fast-moving markets (e.g., 1-minute charts), BBVOL SwiftEdge combines Bollinger Bands, Heikin Ashi smoothing, volume momentum, and EMA trend alignment to deliver actionable buy/sell signals with visual trend cues. Ideal for forex, crypto, and stocks.
What Makes BBVOL SwiftEdge Unique?
Unlike traditional Bollinger Bands scripts that focus solely on price volatility, BBVOL SwiftEdge enhances signal precision by:
Using Heikin Ashi to filter out noise and confirm trend direction, reducing false signals in choppy markets.
Incorporating volume analysis to ensure signals align with significant buying or selling pressure (customizable thresholds).
Adding an EMA overlay to keep trades in sync with the short-term trend.
Coloring candlesticks (green for bullish, red for bearish, purple for consolidation) to visually highlight market conditions at a glance.
How Does It Work?
Buy Signal: Triggers when price crosses above the lower Bollinger Band, Heikin Ashi shows bullish momentum (close > open), buy volume exceeds your set threshold (default 30%), and price is above the EMA. A green triangle appears below the candle.
Sell Signal: Triggers when price crosses below the upper Bollinger Band, Heikin Ashi turns bearish (close < open), sell volume exceeds the threshold (default 30%), and price is below the EMA. A red triangle appears above the candle.
Trend Visualization: Candles turn green when price is significantly above the Bollinger Bands’ basis (indicating a bullish trend), red when below (bearish trend), or purple when near the basis (consolidation), based on a customizable threshold (default 10% of BB width).
Risk Management: Each signal calculates a stop-loss (10% beyond the opposite band) and take-profit (opposite band), plotted for reference.
How to Use It
Timeframe: Best on 1-minute to 5-minute charts for scalping; test higher timeframes for swing trading.
Markets: Works well in volatile markets like forex pairs (e.g., EUR/USD), crypto (e.g., BTC/USD), or liquid stocks.
Customization: Adjust Bollinger Bands length (default 10), multiplier (default 1.2), volume thresholds (default 30%), EMA length (default 3), and consolidation threshold (default 0.1%) to match your strategy.
Interpretation: Look for green/red triangles as entry signals, confirmed by candle colors. Purple candles suggest caution—wait for a breakout. Use stop-loss/take-profit levels for trade management.
Underlying Concepts
Bollinger Bands: Measures volatility and identifies overbought/oversold zones.
Heikin Ashi: Smooths price action to emphasize trend direction.
Volume Momentum: Calculates cumulative buy/sell volume percentages to confirm market strength (e.g., buyVolPercent = buyVolume / totalVolume * 100).
EMA: A fast-moving average (default length 3) ensures signals align with the immediate trend.
Chart Setup
The chart displays Bollinger Bands (orange), Heikin Ashi close (green circles), EMA (purple), and volume-scaled lines (lime/red). Signals are marked with triangles, and candle colors reflect trend state. Keep the chart clean by focusing on these outputs for clarity.
Volatility Cycle IndicatorThis Volatility Cycle Indicator measures market volatility using Bollinger Band Width (BBW). It highlights periods of high volatility (expansion) and low volatility (contraction) to help traders spot potential breakouts or calm periods before big moves.

VIX/VIX3M Ratio計算並顯示 CBOE:VIX 和 CBOE:VIX3M 的比率,幫助交易者評估市場的波動性。
當比率超過設定的高水平或低於低水平時,指標將顯示為紅色,提示潛在的市場異常情況。
Calculates and displays the ratio of CBOE:VIX to CBOE:VIX3M, helping traders assess market volatility.
When the ratio exceeds the set high level or falls below the low level, the indicator will be displayed in red, signaling potential market anomalies.
Bollinger Bands + Supertrend by XoediacBollinger Bands with Supertrend Indicator by Xeodiac
This script combines two powerful technical analysis tools — Bollinger Bands and the Supertrend Indicator — to provide traders with a comprehensive view of market volatility and trend direction.
Bollinger Bands: These bands consist of a middle band (the simple moving average, or SMA) and two outer bands (calculated as standard deviations away from the middle). The upper and lower bands act as dynamic support and resistance levels, expanding during high volatility and contracting during low volatility.
Supertrend Indicator: The Supertrend is a trend-following indicator that uses the Average True Range (ATR) to calculate an adaptive threshold, indicating whether the market is in an uptrend or downtrend. The indicator changes color based on the trend direction, providing clear buy and sell signals.
Features of the Script:
Volatility-based Signals : By incorporating the Bollinger Bands, the script adjusts to market volatility. Traders can identify periods of high and low volatility, helping to gauge potential price breakouts or reversals.
Trend Confirmation: The Supertrend helps confirm the trend direction, ensuring that trades are aligned with the overall market trend. Green Supertrend signals indicate an uptrend, while red signals indicate a downtrend.
Enhanced Decision-making: By using both indicators together, traders can make more informed decisions. For instance, buying opportunities are validated when the price is near the lower Bollinger Band, and the Supertrend is in a bullish phase, and vice versa for selling.
Customizable Parameters: The script allows users to customize the settings for both the Bollinger Bands and the Supertrend, enabling fine-tuning based on trading preferences or market conditions.
Ideal Use Cases:
Identifying trend reversals or continuation patterns in trending markets.
Monitoring price action during periods of low volatility for breakout opportunities.
Filtering out false signals by combining volatility with trend strength.

ReadyFor401ks Just Tell Me When!ReadyFor401ks Just Tell Me When!
LET ME START BY SAYING. NO INDICATOR WILL HELP YOU NAIL THE PERFECT ENTRY/EXIT ON A TRADE. YOU SHOULD ALWAYS EDUCATE YOURSELF AND HAVE A BASIC UNDERSTANDING OF INVESTING, TRADING, CHART ANALYSIS, AND THE RISKS INVOLVED WITH. THAT BEING SAID, WITH THE RIGHT ADJUSTMENTS, IT'S PRETTY D*$N CLOSE TO PERFECTION!
This indicator is designed to help traders identify t rend direction, continuation signals, and potential exits based on a dynamic blend of moving averages, ATR bands, and price action filters. Whether you’re an intraday trader scalping the 5-minute chart or a swing trader analyzing the weekly timeframe for LEAPS , this tool provides a clear, rule-based system to help guide your trading decisions.
⸻
Key Features & Benefits
🔹 Customizable Trend Power (Baseline) Calculation
• Choose from JMA, EMA, HMA, TEMA, DEMA, SMA, VAMA, and WMA for defining your baseline trend direction.
• The baseline helps confirm whether the market is in a bullish or bearish phase.
🔹 ATR-Based Trend Continuation & Volatility Measurement
• ATR bands dynamically adjust to market conditions, helping you spot breakouts and fakeouts.
• The indicator detects when price violates ATR range , which often signals impulse moves.
🔹 Clear Entry & Exit Signals
• Uses a Continuation MA (SSL2) to confirm trends.
• Includes a separate Exit MA (SSL3) that provides crossover signals to indicate when to exit trades or reverse positions .
• Plots trend continuation circles when ATR conditions align with trend signals.
🔹 Keltner Channel Baseline for Market Structure
• A modified Keltner Channel is integrated into the baseline to help filter out choppy conditions .
• If price remains inside the baseline, the market is in consolidation , while breakouts beyond the bands indicate strong trends .
🔹 Adaptive Color Coding for Market Conditions
• Bars change color based on momentum, making trend direction easy to read.
• Green = Bullish Trend, Red = Bearish Trend, Gray = Neutral/Chop.
🔹 Flexible Alerts for Trade Management
• Get real-time alerts when the Exit MA crosses price , helping you l ock in profits or switch directions .
⸻
How to Use This Indicator for Different Trading Styles
🟢 For Intraday Trading (5-Minute Chart Setup)
• Faster MA settings help react quickly to momentum shifts.
• Ideal for scalping breakouts, trend continuation setups, and intraday reversals.
• Watch for ATR violations and price interacting with the baseline/Keltner Channel for entries.
--------------------------------
My Settings for Intraday Trading on 5min Chart
ATR Period: 15
ATR Multi: 1
ATR Smoothing: WMA
Trend Power based off of: JMA
Trend Power Period: 30
Continuation Type: JMA
Continuation Length: 20
Calculate Exit of what MA?: HMA
Calculate Exit off what Period? 30
Source of Exit Calculation: close
JMA Phase *APPLIES TO JMA ONLY: 3
JMA Power *APPLIES TO JMA ONLY: 3
Volatility Lookback Period *APPLIES TO VAMA ONLY 30
Use True Range for Channel? Checked
Base Channel Multiplier: 0.4
ATR Continuation Criteria: 1.1
----------------------------------
🔵 For Swing Trading & LEAPS (Weekly Chart Setup - Default Settings)
• Slower MAs provide a broader view of trend structure.
• Helps capture multi-week trend shifts and confirm entry points for longer-term trades.
• Weekly ATR bands highlight when stocks are entering overextended conditions.
💡 Example:
Let’s say you’re looking at TSLA on a Weekly Chart using the default settings. You notice that price crosses above the continuation MA (SSL2) while remaining above the baseline (trend power MA). The bar turns green, and price breaks above ATR resistance, signaling a strong bullish continuation. This could be a great opportunity to enter a long-term swing trade or LEAPS options position.
On the flip side, if price reverses below the Exit MA (SSL3) and turns red while breaking the lower ATR band, it might signal a good time to exit longs or enter a short trade.
⸻
Final Thoughts
The ReadyFor401ks Just Tell Me When! indicator is an all-in-one trading system that simplifies trend-following, volatility measurement, and trade management. By integrating multiple moving average types, ATR filters, and clear visual cues, it allows traders to stay disciplined and remove emotions from their trading decisions.
✅ Perfect for scalpers, day traders, and swing traders alike!
🔔 Set up alerts for automated trade signals and never miss a key move!
💬 If you find this indicator useful, leave a comment and share how you use it in your trading! 🚀

Adaptive Range XV📌 Как это работает?
1️⃣ Анализирует волатильность с помощью SMA от ATR.
2️⃣ Определяет, в каком состоянии рынок:
Тренд → Увеличивает K (2.0) и снижает шум.
Флет → Уменьшает K (1.2) и увеличивает шум.
Нейтральное состояние → Оставляет средние значения.
3️⃣ Подстраивает Range XV в режиме реального времени.
🔥 Индикатор сам корректируется под рынок! 🚀

Range/volumeEMARange/volumeEMA, reflecting the relationship between price changes and trading volume.

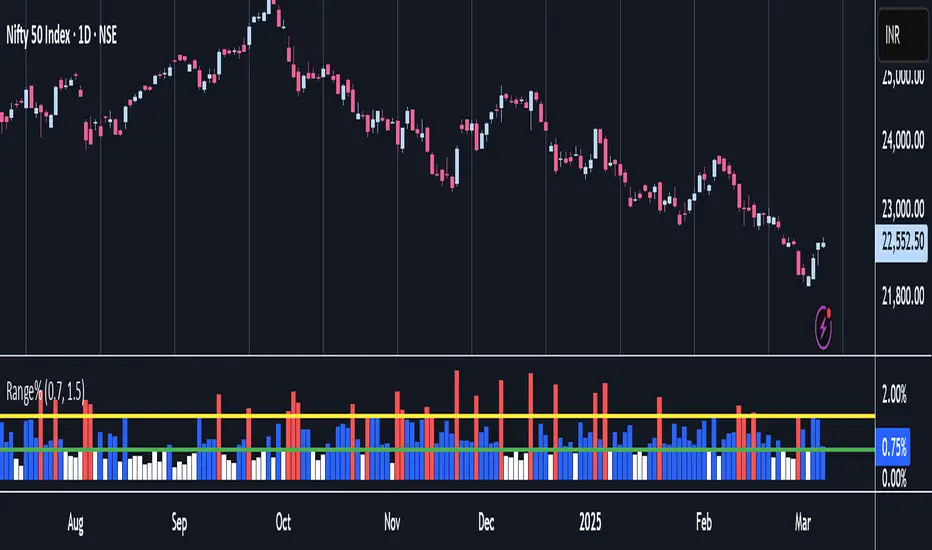
Range%This indicator displays the range of each candle i.e. High minus Low as a percentage of the previous closing price. It does not account for gaps, making it particularly useful for intraday trading. By tracking the volatility cycle of candles, this indicator helps identify periods of increased or decreased market volatility, allowing traders to pinpoint the best days to execute trades.
If the Range% is below low line candles will turn White and If Range% is above the High Line Candles will turn Red.
RSI & 5 EMARSI & 5 EMA Reversal Trading Indicator
📌 Category: Reversal Trading
🔹 Overview
This script is designed to identify potential reversal points using the Relative Strength Index (RSI) and the 5-Period Exponential Moving Average (EMA). It helps traders spot short-term exhaustion in price movements and provides clear entry signals when momentum shifts against the prevailing move.
🔹 How It Works
5-Period EMA (Blue Line):
Used to gauge short-term price direction.
RSI-Based Reversal Setup:
Helps filter trade setups to avoid false signals.
A buy preparation level is set when RSI is below 40, and the high is below the 5 EMA, indicating a potential oversold condition.
A sell preparation level is set when RSI is above 60, and the low is above the 5 EMA, signaling a possible overbought condition.
Reversal Entry Conditions:
A buy signal occurs if the price closes above the buy preparation level within the next 3 candles.
A sell signal occurs if the price closes below the sell preparation level within the next 3 candles.
Visual Enhancements:
Signal candles are highlighted with a white wick and border to make reversals easy to spot.
The 5 EMA is plotted in blue to track short-term trends.
🔹 How to Use This Indicator
✅ Best for traders looking to catch short-term reversals.
✅ Works well on 5-min, 15-min, 1-hour, and daily charts.
✅ Can be used in range-bound markets or at key support/resistance levels.
🔹 Customization Request
Even the conditions are met, no signal is plotted by this script. I will be very happy if anyone correct the script for better and accurate result.

Divergenze VIX vs SP500L'indicatore confronta il prezzo dell'S&P 500 con l'RSI del VIX per rilevare divergenze rialziste e ribassiste. Questo strumento è progettato per anticipare le inversioni di trend, sfruttando la correlazione inversa tra S&P 500 e VIX.
🔍 Principio di funzionamento:
Se l’S&P 500 raggiunge nuovi massimi, ma l’RSI del VIX non conferma, si potrebbe verificare un’inversione ribassista.
Se l’S&P 500 segna nuovi minimi, ma l’RSI del VIX inizia a salire, il mercato potrebbe rimbalzare.

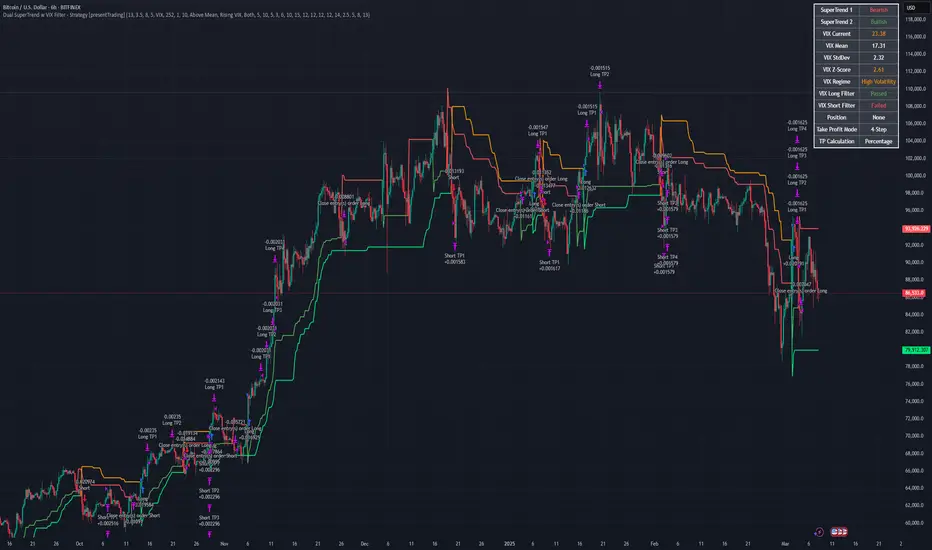
Dual SuperTrend w VIX Filter - Strategy [presentTrading]Hey everyone! Haven't been here for a long time. Been so busy again in the past 2 months. I recently started working on analyzing the combination of trend strategy and VIX, but didn't get outstanding results after a few tries. Sharing this tool with all of you in case you have better insights.
█ Introduction and How it is Different
The Dual SuperTrend with VIX Filter Strategy combines traditional trend following with market volatility analysis. Unlike conventional SuperTrend strategies that focus solely on price action, this experimental system incorporates VIX (Volatility Index) as an adaptive filter to create a more context-aware trading approach. By analyzing where current volatility stands relative to historical norms, the strategy adjusts to different market environments rather than applying uniform logic across all conditions.
BTCUSD 6hr Long Short Performance
█ Strategy, How it Works: Detailed Explanation
🔶 Dual SuperTrend Core
The strategy uses two SuperTrend indicators with different sensitivity settings:
- SuperTrend 1: Length = 13, Multiplier = 3.5
- SuperTrend 2: Length = 8, Multiplier = 5.0
The SuperTrend calculation follows this process:
1. ATR = Average of max(High-Low, |High-PreviousClose|, |Low-PreviousClose|) over 'length' periods
2. UpperBand = (High+Low)/2 - (Multiplier * ATR)
3. LowerBand = (High+Low)/2 + (Multiplier * ATR)
Trend direction is determined by:
- If Close > previous LowerBand, Trend = Bullish (1)
- If Close < previous UpperBand, Trend = Bearish (-1)
- Otherwise, Trend = previous Trend
🔶 VIX Analysis Framework
The core innovation lies in the VIX analysis system:
1. Statistical Analysis:
- VIX Mean = SMA(VIX, 252)
- VIX Standard Deviation = StdDev(VIX, 252)
- VIX Z-Score = (Current VIX - VIX Mean) / VIX StdDev
2. **Volatility Bands:
- Upper Band 1 = VIX Mean + (2 * VIX StdDev)
- Upper Band 2 = VIX Mean + (3 * VIX StdDev)
- Lower Band 1 = VIX Mean - (2 * VIX StdDev)
- Lower Band 2 = VIX Mean - (3 * VIX StdDev)
3. Volatility Regimes:
- "Very Low Volatility": VIX < Lower Band 1
- "Low Volatility": Lower Band 1 ≤ VIX < Mean
- "Normal Volatility": Mean ≤ VIX < Upper Band 1
- "High Volatility": Upper Band 1 ≤ VIX < Upper Band 2
- "Extreme Volatility": VIX ≥ Upper Band 2
4. VIX Trend Detection:
- VIX EMA = EMA(VIX, 10)
- VIX Rising = VIX > VIX EMA
- VIX Falling = VIX < VIX EMA
Local performance:
🔶 Entry Logic Integration
The strategy combines trend signals with volatility filtering:
Long Entry Condition:
- Both SuperTrend 1 AND SuperTrend 2 must be bullish (trend = 1)
- AND selected VIX filter condition must be satisfied
Short Entry Condition:
- Both SuperTrend 1 AND SuperTrend 2 must be bearish (trend = -1)
- AND selected VIX filter condition must be satisfied
Available VIX filter rules include:
- "Below Mean + SD": VIX < Lower Band 1
- "Below Mean": VIX < VIX Mean
- "Above Mean": VIX > VIX Mean
- "Above Mean + SD": VIX > Upper Band 1
- "Falling VIX": VIX < VIX EMA
- "Rising VIX": VIX > VIX EMA
- "Any": No VIX filtering
█ Trade Direction
The strategy allows testing in three modes:
1. **Long Only:** Test volatility effects on uptrends only
2. **Short Only:** Examine volatility's impact on downtrends only
3. **Both (Default):** Compare how volatility affects both trend directions
This enables comparative analysis of how volatility regimes impact bullish versus bearish markets differently.
█ Usage
Use this strategy as an experimental framework:
1. Form a hypothesis about how volatility affects trend reliability
2. Configure VIX filters to test your specific hypothesis
3. Analyze performance across different volatility regimes
4. Compare results between uptrends and downtrends
5. Refine your volatility filtering approach based on results
6. Share your findings with the trading community
This framework allows you to investigate questions like:
- Are uptrends more reliable during rising or falling volatility?
- Do downtrends perform better when volatility is above or below its historical average?
- Should different volatility filters be applied to long vs. short positions?
█ Default Settings
The default settings serve as a starting point for exploration:
SuperTrend Parameters:
- SuperTrend 1 (Length=13, Multiplier=3.5): More responsive to trend changes
- SuperTrend 2 (Length=8, Multiplier=5.0): More selective filter requiring stronger trends
VIX Analysis Settings:
- Lookback Period = 252: Establishes a full market cycle for volatility context
- Standard Deviation Bands = 2 and 3 SD: Creates statistically significant regime boundaries
- VIX Trend Period = 10: Balances responsiveness with noise reduction
Default VIX Filter Selection:
- Long Entry: "Above Mean" - Tests if uptrends perform better during above-average volatility
- Short Entry: "Rising VIX" - Tests if downtrends accelerate when volatility is increasing
Feel Free to share your insight below!!!