Divergenze VIX vs SP500L'indicatore confronta il prezzo dell'S&P 500 con l'RSI del VIX per rilevare divergenze rialziste e ribassiste. Questo strumento è progettato per anticipare le inversioni di trend, sfruttando la correlazione inversa tra S&P 500 e VIX.
Principio di funzionamento:
Se l’S&P 500 raggiunge nuovi massimi, ma l’RSI del VIX non conferma, si potrebbe verificare un’inversione ribassista.
Se l’S&P 500 segna nuovi minimi, ma l’RSI del VIX inizia a salire, il mercato potrebbe rimbalzare.
Volatility

Volatility-Enhanced Williams %R [AIBitcoinTrend]👽 Volatility-Enhanced Williams %R (AIBitcoinTrend)
The Volatility-Enhanced Williams %R takes the classic Williams %R oscillator to the next level by incorporating volatility-adaptive smoothing, making it significantly more responsive to market dynamics. Unlike the traditional version, which uses a fixed calculation method, this indicator dynamically adjusts its smoothing factor based on market volatility, helping traders capture trends more effectively while filtering out noise.
Additionally, the indicator includes real-time divergence detection and an ATR-based trailing stop system, providing traders with enhanced risk management tools and early reversal signals.
👽 What Makes the Volatility-Enhanced Williams %R Unique?
Unlike the standard Williams %R, which applies a simple lookback-based formula, this version integrates adaptive smoothing and volatility-based filtering to refine its signals and reduce false breakouts.
✅ Volatility-Adaptive Smoothing – Adjusts dynamically based on standard deviation, enhancing signal accuracy.
✅ Real-Time Divergence Detection – Identifies bullish and bearish divergences for early trend reversal signals.
✅ Crossovers & Trailing Stops – Implements Williams %R crossovers with ATR-based trailing stops for intelligent trade management.
👽 The Math Behind the Indicator
👾 Volatility-Adaptive Smoothing
The indicator smooths the Williams %R calculation by applying an adaptive filtering mechanism, which adjusts its responsiveness based on market conditions. This helps to eliminate whipsaws and makes trend-following strategies more reliable.
The smoothing function is defined as:
clamp(x, lo, hi) => math.min(math.max(x, lo), hi)
adaptive(src, prev, len, divisor, minAlpha, maxAlpha) =>
vol = ta.stdev(src, len)
alpha = clamp(vol / divisor, minAlpha, maxAlpha)
prev + alpha * (src - prev)
Where:
Volatility Factor (vol) measures price dispersion using standard deviation.
Adaptive Alpha (alpha) dynamically adjusts smoothing strength.
Clamped Output ensures that the smoothing factor remains within a stable range.
👽 How Traders Can Use This Indicator
👾 Divergence Trading Strategy
Bullish Divergence Setup:
Price makes a lower low, while Williams %R forms a higher low.
Buy signal is confirmed when Williams %R reverses upward.
Bearish Divergence Setup:
Price makes a higher high, while Williams %R forms a lower high.
Sell signal is confirmed when Williams %R reverses downward.
👾 Trailing Stop & Signal-Based Trading
Bullish Setup:
✅ Williams %R crosses above trigger level → Buy signal.
✅ A bullish trailing stop is placed at Low - (ATR × Multiplier).
✅ Exit if price crosses below the stop.
Bearish Setup:
✅ Williams %R crosses below trigger level → Sell signal.
✅ A bearish trailing stop is placed at High + (ATR × Multiplier).
✅ Exit if price crosses above the stop.
👽 Why It’s Useful for Traders
Adaptive Filtering Mechanism – Avoids excessive noise while maintaining responsiveness.
Real-Time Divergence Alerts – Helps traders anticipate market reversals before they occur.
ATR-Based Risk Management – Stops dynamically adjust based on market volatility.
Multi-Market Compatibility – Works effectively across stocks, forex, crypto, and futures.
👽 Indicator Settings
Smoothing Factor – Controls how aggressively the indicator adapts to volatility.
Enable Divergence Analysis – Activates real-time divergence detection.
Lookback Period – Defines the number of bars for detecting pivot points.
Enable Crosses Signals – Turns on Williams %R crossover-based trade signals.
ATR Multiplier – Adjusts trailing stop sensitivity.
Disclaimer: This indicator is designed for educational purposes and does not constitute financial advice. Please consult a qualified financial advisor before making investment decisions.

BBMA Uranus ACIndikator **BBMA Uranus AC** adalah alat analisis teknikal yang menggabungkan **Bollinger Bands**, **Weighted Moving Average (WMA)**, dan **Exponential Moving Average (EMA)** untuk membantu trader mengidentifikasi **tren**, **volatilitas**, dan **momentum** pasar. Berikut penjelasan ringkasnya:
---
**1. Bollinger Bands**
- **Fungsi**: Mengukur volatilitas dan menentukan level support/resistance.
- **Komponen**:
- Mid BB (SMA 20): Garis tengah.
- Upper BB (Mid BB + 2 × Standar Deviasi): Resistance.
- Lower BB (Mid BB - 2 × Standar Deviasi): Support.
- **Warna**: Abu-abu.
---
**2. WMA (Weighted Moving Average)**
- **Fungsi**: Mengukur momentum harga.
- **Komponen**:
- WMA 5 High dan WMA 10 High: Untuk harga tinggi.
- WMA 5 Low dan WMA 10 Low: Untuk harga rendah.
- **Area Fill**: Mengisi area antara WMA 5 dan WMA 10 dengan warna abu-abu gelap transparan (80%) untuk visualisasi momentum.
- **Tampilan**: Garis WMA disembunyikan, hanya area fill yang terlihat.
---
**3. EMA (Exponential Moving Average)**
- **EMA 50**: Garis tren jangka menengah (warna putih).
- **EMA 1**: EMA periode 1 (sangat sensitif) untuk referensi internal atau alert (warna putih, disembunyikan, linewidth 4).
---
**4. Tujuan Indikator**
- **Identifikasi Tren**: Menggunakan EMA 50 dan Bollinger Bands.
- **Analisis Momentum**: Menggunakan area fill dari WMA.
- **Sinyal Trading**: Kombinasi Bollinger Bands (overbought/oversold) dan EMA 50 (arah tren).
---
**5. Cara Menggunakan**
1. **Tren**: Lihat posisi harga relatif terhadap EMA 50.
2. **Volatilitas**: Gunakan Bollinger Bands untuk level support/resistance.
3. **Momentum**: Perhatikan area fill (abu-abu gelap) untuk kekuatan bullish/bearish.
Indikator ini dirancang untuk memberikan informasi lengkap dengan tampilan yang bersih dan minimalis.

ATR PercentageAdded a horizontal line at 2%
The rationale behind is that volatility contraction is always followed by expansion. I.e., we are getting closer to a decision point where the price will continue to follow the same direction in which it breaks through.

Enhanced VSA Volume & Candle Colors with MA SelectionOverview:
This script aims to enhance the visualization of volume spikes and price action by coloring volume bars and price candles dynamically based on the volume behavior. It allows traders to customize the type of volume moving average (SMA, EMA, or VWMA) used and apply various color schemes to highlight high, low, and extreme volume conditions. Additionally, alerts are generated when extreme or low-volume conditions occur.
---------------------------------------------------------------------------------------------------------------------
Key Features:
Customizable Volume Lookback Period:
The script allows users to define the period for calculating the moving average of volume (default: 200).
Volume Multiplier Settings:
High and low volume thresholds are defined using multipliers. Users can adjust these to customize how volume is categorized (default multipliers: 1.5 for high volume, 0.5 for low volume).
Percentile-Based Extreme Volume Detection:
The script calculates a percentile threshold for extreme volume (default: 90th percentile) based on the volume data, highlighting exceptionally high volume spikes.
Moving Average Selection:
Users can choose between Simple Moving Average (SMA), Exponential Moving Average (EMA), or Volume Weighted Moving Average (VWMA) to track volume trends over the selected lookback period.
Volume-Based Price Bar Coloring:
Price bars can be colored according to the volume conditions (high, low, or extreme). This feature can be toggled on or off.
Dynamic Transparency and Color Customization:
The script allows users to set custom colors for different volume conditions (high, low, neutral, extreme) and adjusts the transparency of volume bars based on the relative size of the volume.
Alerts:
Alerts can be set for when extreme volume spikes or low volume conditions are detected.
---------------------------------------------------------------------------------------------------------------------
Script Components:
Volume Histogram Plot:
Displays the volume bars with dynamic coloring based on the volume condition (high, low, or extreme). The color of the bars adjusts for clarity, with transparency based on volume levels.
Moving Average Plot:
Plots the selected volume moving average (SMA, EMA, or VWMA) to visualize the trend of volume over the chosen lookback period.
Smoothed Average Volume (EMA of Volume):
A smoothed EMA line is plotted to provide a clear representation of volume trends over time.
Price Bar Coloring:
If enabled, price bars are colored according to the current volume condition, providing immediate visual feedback to the trader.
---------------------------------------------------------------------------------------------------------------------
How It Can Be Used:
Volume Analysis for Entry/Exit Points: Traders can use the volume conditions (high, low, and extreme) to identify potential entry or exit points. High-volume bars often signal strong market activity, while low-volume bars may indicate consolidation or indecision.
Volume Confirmation for Trend Reversal: Extreme volume spikes can sometimes precede significant price movements. Traders can monitor these spikes for potential trend reversal signals.
Customizing Alerts: Alerts based on volume conditions help traders stay updated on important volume events without constantly monitoring the chart.
Color-Coded Price Action: The dynamic coloring of price bars makes it easier to identify periods of strong or weak market participation, allowing traders to make informed decisions quickly.
---------------------------------------------------------------------------------------------------------------------
Compliance with TradingView's House Rules:
No Promotion of Financial Products: The script does not promote any specific financial instruments or products, ensuring compliance with TradingView’s content guidelines.
Clear Functionality: The script provides clear, functional analysis tools without making unsupported claims about predicting market movements.
No Automated Trading: The script does not include any automated trading or order execution features, which complies with TradingView’s policy on non-automated scripts.
This breakdown ensures clarity on the script’s purpose, features, and how it might be used by traders. It's written in a way that fits TradingView's content guidelines, keeping the focus on providing valuable analytical tools rather than making promises or promoting any financial product.

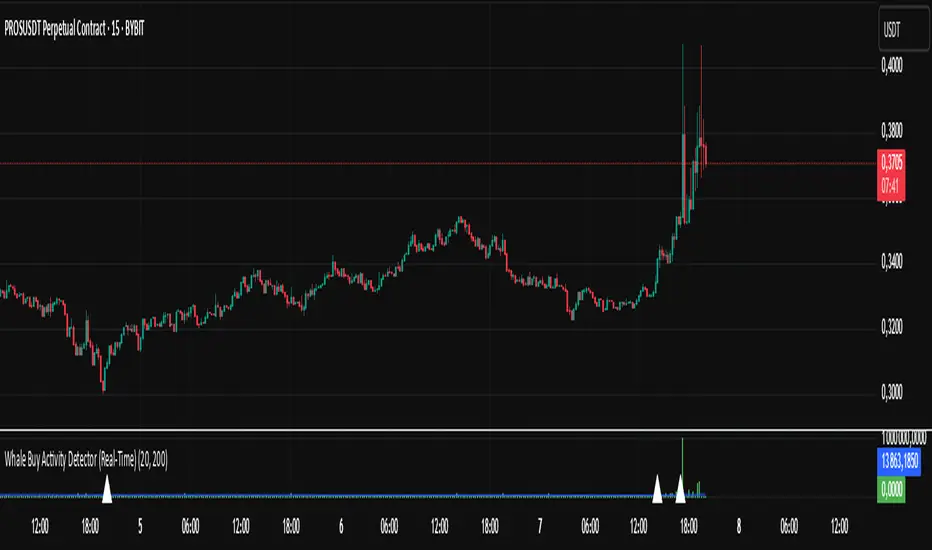
Whale Buy Activity Detector (Real-Time)Whale Buy Activity Detector (Real-Time)
This indicator helps to identify abnormal spikes in the volume of purchases, which may indicate the activity of large players ("whales"). It analyzes the volume of purchases and compares it with the average volume over a certain period of time. If the volume of purchases exceeds a set threshold, the indicator marks this as potential whale activity.
Basic parameters:
Volume Threshold (x Average): The coefficient by which the current purchase volume must exceed the average volume in order to be considered abnormal. The default value is 2.0, which means that the purchase volume should be 2 times the average volume for the selected time period. This parameter can be adjusted in the range from 1.0 and higher in increments of 0.1.
Example: If you set the value to 1.5, the indicator will mark situations when the volume of purchases exceeds the average volume by 1.5 times.
Lookback Period: The time period used to calculate the average purchase volume. The default value is 20, which means that the average purchase volume will be calculated for the last 20 candles. This parameter can be set in the range from 1 and above.Example: If you set the value to 10, the average purchase volume will be calculated for the last 10 candles.
How to use:
Buy Volume: Shows the volume of purchases on each candle. This is the volume that was sold at a price higher than the opening price of the candle.
Average Buy Volume: The average volume of purchases over a given time period (Lookback Period). This parameter helps to determine the "normal" level of purchase volume.
Whale Buy: Notes abnormal spikes in the volume of purchases, which may indicate the activity of "whales". The indicator draws a mark on the top of the candle when the purchase volume exceeds the threshold set by the Volume Threshold parameter.
Notifications:
The indicator can send notifications when an abnormal volume of purchases is detected. You can set up notifications via the TradingView menu to receive real-time alerts.
Usage example:
If you are trading in a highly volatile market, you can increase the Volume Threshold to filter out small volume spikes.
If you trade in a low-volatility market, you can reduce the Volume Threshold to capture even small anomalies.
Momentum Candle Identifier # Momentum Candle Identifier
This indicator helps traders identify significant momentum candles by analyzing candle body size relative to recent price action (think after consolidation periods). Unlike traditional volatility indicators, this tool specifically focuses on price movement captured by the candle body (open to close distance), filtering out potentially misleading wicks.
## How It Works
- The indicator calculates the average candle body size over a user-defined lookback period
- Momentum candles are identified when their body size exceeds the average by a customizable threshold multiplier
- Bullish momentum candles (close > open) are highlighted in a user defined color
- Bearish momentum candles (close < open) are highlighted in a user defined color
- A real-time information panel displays key metrics including current average body size and threshold values
## Key Features
- Focus on candle body size rather than full range (high to low)
- Custom lookback period to adapt to different timeframes
- Adjustable threshold multiplier to fine-tune sensitivity
- Customizable colors for bullish and bearish momentum candles
- Optional labels for momentum candles
- Information panel showing lookback settings, average size, and momentum candle count
## Usage Tips
- Use shorter lookback periods (3-5) for more signals in choppy markets
- Use longer lookback periods (8-20) to identify only the most significant momentum moves
- Higher threshold multipliers (2.0+) will identify only the strongest momentum candles
- Combine with trend indicators to find potential reversal or continuation signals
- Look for clusters of momentum candles to identify strong shifts in market sentiment
This indicator helps identify candles that represent significant price movement relative to recent activity, potentially signaling changes in market momentum, sentiment shifts, or the beginning of new trends.

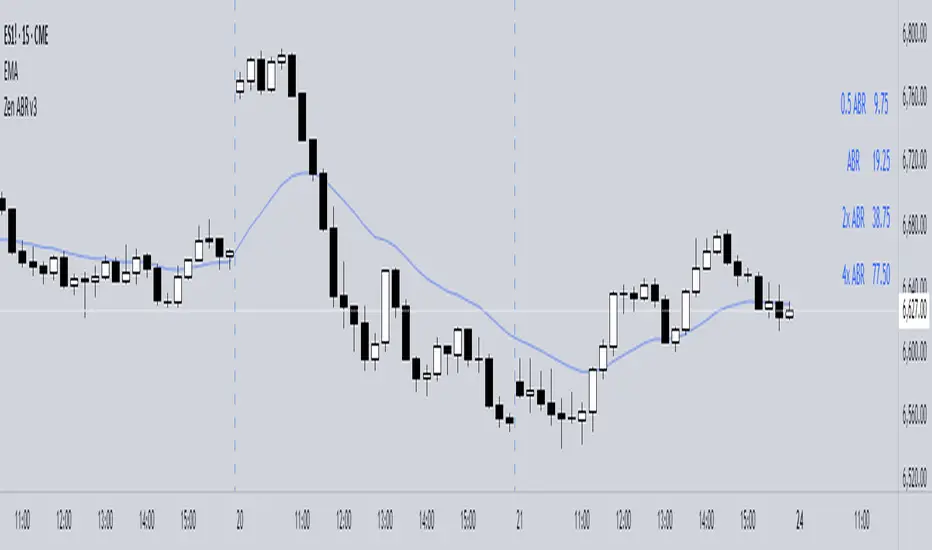
Zen ABR### **Average Bar Range (ABR) Levels** – A Simple Yet Powerful Scalping Tool
The **ABR Levels** indicator dynamically calculates the **average bar range** and plots three key levels on your chart:
✅ **0.5x ABR** – Half the average bar range
✅ **1x ABR** – The full average bar range
✅ **2x ABR** – Double the average bar range
This provides an **instant volatility gauge**, helping traders adjust position size, stop losses, and targets **based on current market conditions** rather than arbitrary numbers.
### **How It Works**
- The indicator calculates **the average range of the last 8 bars** (default setting, adjustable).
- The **ABR levels update in real time**, appearing in the **top-right corner of your chart** for easy reference.
- Works across **any instrument and timeframe** – great for scalpers and intraday traders.
### **Why Use ABR Levels?**
🚀 **Avoid oversized losses** – Trade dynamically instead of using fixed stops and targets.
📉 **Recognize shifts in market conditions** – Identify when volatility is expanding or contracting.
🎯 **Refine your entries & exits** – Use ABR levels to **scale** your positions intelligently.
### **Pro Tip:**
Never enter a trade **aiming for half-R** profits. If a trade goes badly, **you might manage it to break even or half-R**, but aiming for tiny wins will **wreck your long-term edge**.
🔹 **This script is open-source!** If you're not on TradingView, you can copy the code into any AI tool to generate it for your platform. 🚀
BTC-USDT Liquidity Trend [Ajit Pandit]his script helps traders visualize trend direction and identify liquidity zones where price might react due to past pivot levels. The color-coded candles and extended pivot lines make it easier to spot support/resistance levels and potential breakout points.
Key Features:
1. Trend Detection Using EMA
Uses two EMA calculations to determine the trend:
emaValue: Standard EMA based on length1
correction: Adjusted price movement relative to EMA
Trend: Another EMA of the corrected value
Determines bullish (signalUp) and bearish (signalDn) signals when Trend crosses emaValue.
2. Candlestick Coloring Based on Trend
Candlesticks are colored:
Uptrend → Blue (up color)
Downtrend → Pink (dn color)
Neutral → No color
3. Liquidity Zones (Pivot Highs & Lows)
Identifies pivot highs and lows using a customizable pivot length.
Draws liquidity lines:
High pivot lines (Blue, adjustable width)
Low pivot lines (Pink, adjustable width)
Extends lines indefinitely until price breaks above/below the level.
Removes broken pivot levels dynamically.

Median Volume Weighted DeviationMVWD (Median Volume Weighted Deviation)
The Median Volume-Weighted Deviation is a technical trend following indicator that overlays dynamic bands on the price chart, centered around a Volume Weighted Average Price (VWAP). By incorporating volume-weighted standard deviation and its median, it identifies potential overbought and oversold conditions, generating buy and sell signals based on price interactions with the bands. The fill color between the bands visually reflects the current signal, enhancing market sentiment analysis.
How it Works
VWAP Calculation: Computes the Volume-Weighted Average Price over a specific lookback period (n), emphasizing price levels with higher volume.
Volume Weighted Standard Deviation: Measures price dispersion around the VWAP, weighted by volume, over the same period.
Median Standard Deviation: Applies a median filter over (m) periods to smooth the stand deviation, reducing noise in volatility estimates.
Bands: Constructs upper and lower bands by adding and subtracting a multiplier (k) times the median standard deviation from the VWAP
Signals:
Buy Signal: Triggers when the closing price crosses above the upper band.
Sell Signal: Triggers when the closing price crosses below the lower band.
Inputs
Lookback (n): Number of periods for the VWAP and standard deviation calculations. Default is set to 14.
Median Standard Deviation (m): Periods for the median standard deviation. Default is set to 2.
Standard Deviation Multiplier (k): Multiplier to adjust band width. Default is set to 1.7 with a step of 0.1.
Customization
Increase the Lookback (n) for a smoother VWAP and broader perspective, or decrease the value for higher sensitivity.
Adjust Median Standard Deviation (m) to control the smoothness of the standard deviation filter.
Modify the multiplier (k) to widen or narrow the bands based on the market volatility preferences.

Daily Standard Deviation (fadi)The Daily Standard Deviation indicator uses standard deviation to map out daily price movements. Standard deviation measures how much prices stray from their average—small values mean steady trends, large ones mean wild swings. Drawing from up to 20 years of data, it plots key levels using customizable Fibonacci lines tied to that standard deviation, giving traders a snapshot of typical price behavior.
These levels align with a bell curve: about 68% of price moves stay within 1 standard deviation, 95% within roughly 2, and 99.7% within roughly 3. When prices break past the 1 StDev line, they’re outliers—only 32% of moves go that far. Prices often snap back to these lines or the average, though the reversal might not happen the same day.
How Traders Use It
If prices surge past the 1 StDev line, traders might wait for momentum to fade, then trade the pullback to that line or the average, setting a target and stop.
If prices dip below, they might buy, anticipating a bounce—sometimes a day or two later. It’s a tool to spot overstretched prices likely to revert and/or measure the odds of continuation.
Settings
Open Hour: Sets the trading day’s start (default: 18:00 EST).
Show Levels for the Last X Days: Displays levels for the specified number of days.
Based on X Period: Number of days to calculate standard deviation (e.g., 20 years ≈ 5,040 days). Larger periods smooth out daily level changes.
Mirror Levels on the Other Side: Plots symmetric positive and negative levels around the average.
Fibonacci Levels Settings: Defines which levels and line styles to show. With mirroring, negative values aren’t needed.
Overrides: Lets advanced users input custom standard deviations for specific tickers (e.g., NQ1! at 0.01296).

Pure CocaPure Coca - Trend & Mean Reversion Indicator
Overview
The Pure Coca indicator is a trend and mean reversion analysis tool designed for identifying dynamic shifts in market behavior. By leveraging Z-score calculations, this indicator captures both trend-following and mean-reverting periods, making it useful for a wide range of trading strategies.
What It Does
📉 Detects Overbought & Oversold Conditions using a Z-score framework.
🎯 Identifies Trend vs. Mean Reversion Phases by analyzing the deviation of price from its historical average.
📊 Customizable Moving Averages (EMA, SMA, VWMA, etc.) for smoothing Z-score calculations.
🔄 Adaptable to Any Timeframe – Default settings are optimized for 2D charts but can be adjusted to suit different market conditions.
How It Works
Computes a Z-score of price movements, normalized over a lookback period.
Plots upper and lower boundaries to visualize extreme price movements.
Dynamic Midlines adjust entry and exit conditions based on market shifts.
Background & Bar Coloring help traders quickly identify trading opportunities.
Key Features & Inputs
✔ Lookback Period: Adjustable period for calculating Z-score.
✔ Custom MA Smoothing: Choose from EMA, SMA, WMA, VWAP, and more.
✔ Z-Score Thresholds: Set upper and lower bounds to define overbought/oversold conditions.
✔ Trend vs. Mean Reversion Mode: Enables traders to spot momentum shifts in real-time.
✔ Bar Coloring & Background Highlights: Enhances visual clarity for decision-making.
How to Use It
Trend Trading: Enter when the Z-score crosses key levels (upper/lower boundary).
Mean Reversion: Look for reversals when price returns to the midline.
Custom Optimization: Adjust lookback periods and MA types based on market conditions.
Why It's Unique
✅ Combines Trend & Mean Reversion Analysis in one indicator.
✅ Flexible Z-score settings & MA choices for enhanced adaptability.
✅ Clear visual representation of market extremes.
Final Notes
This indicator is best suited for discretionary traders, quantitative analysts, and systematic traders looking for data-driven market insights. As with any trading tool, use in conjunction with other analysis methods for optimal results.

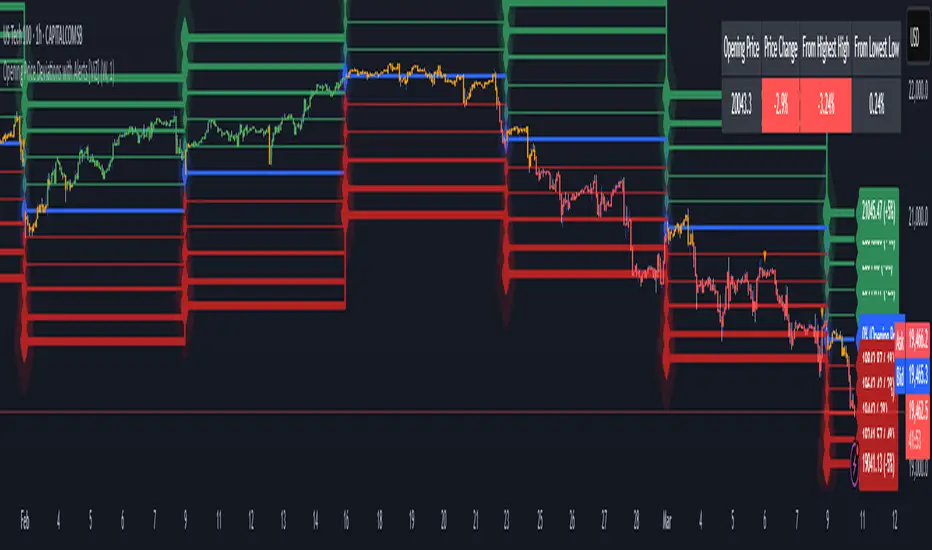
Opening Price Deviations with AlertsOverview
The Timeframe Opening Price Deviations indicator helps traders visualize how price deviates from a key reference point—the opening price of a selected timeframe (Daily, Weekly, or Monthly). It calculates upper and lower deviation levels based on a percentage step and plots these levels on the chart. This can help traders identify potential areas of support and resistance.
----------------------------------------------------------------------------------------------------------------------
How It Works
Opening Price Reference:
The script retrieves the opening price of the selected timeframe (Daily, Weekly, or Monthly).
Deviation Levels Calculation:
Five upper and lower deviation levels are calculated based on a percentage step input by the user.
Each level is determined by multiplying the opening price by (1 ± step size).
Visualization
The indicator plots the calculated levels as horizontal lines above and below the opening price.
Labels appear only on the latest bar, displaying the exact price level along with its percentage deviation from the opening price.
User has the option to turn on/off or change the bar colours. If price is within the 1st deviation lines that's considered neutral coloured orange as default. If price is above/below the first deviation levels the bar colours will be green or red.
---------------------------------------------------------------------------------------------------------------------
Potential Use Cases
Support & Resistance Zones 🟢🔴
The deviation levels can act as potential areas where price may reverse or consolidate based on historical price behaviour.
Breakout & Reversion Strategies 📈📉
If price breaks above an upper deviation level, it could indicate momentum continuation.
If price rejects from a level, it might suggest a mean reversion opportunity.
Trend Strength Analysis 🔍
The distance between the price and deviation levels can help traders assess whether a trend is strong (moving away from the opening price) or weak (hovering near the opening price).
Intraday vs. Multi-Timeframe Perspective 🕒
By selecting different timeframes (Daily, Weekly, Monthly), traders can align intraday price movements with higher timeframe reference points for added confluence.
---------------------------------------------------------------------------------------------------------------------
Customization Options
Timeframe Selection: Choose between Daily, Weekly, or Monthly opening prices.
Deviation Step (%): Adjust the step size to control the spacing between deviation levels.
Colour Bars: User Is able to change the colour of the bars.
---------------------------------------------------------------------------------------------------------------------
Alerts
This Indicator also has alerts for when price crosses above/below a deviation line. It will tell you the ticker, price and time
---------------------------------------------------------------------------------------------------------------------
Final Notes
This indicator is purely for technical analysis and should not be used as a standalone trading system. It works best when combined with price action, volume analysis, or other indicators of you're choosing to refine trade decisions.
Happy Trading! 🚀📊
---------------------------------------------------------------------------------------------------------------------
This explanation is clear, informative, and compliant with TradingView’s House Rules.
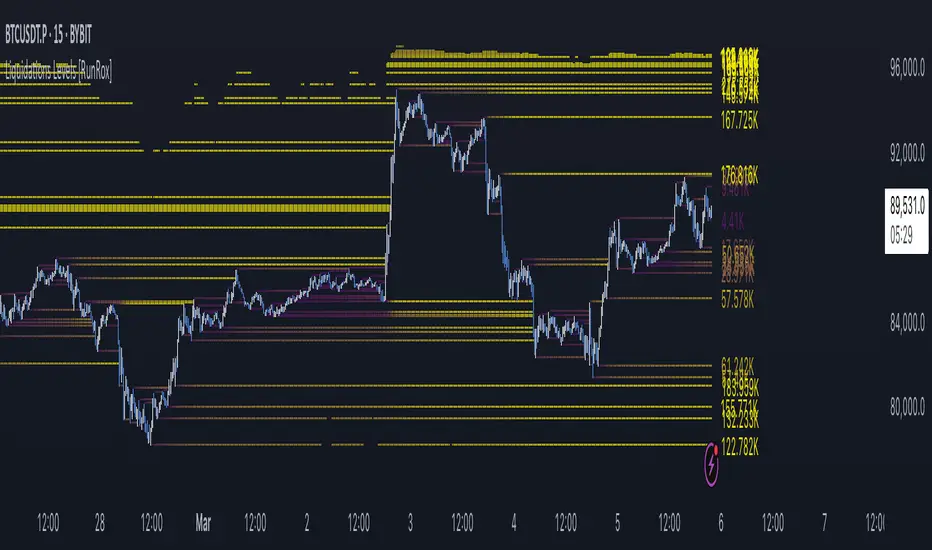
Liquidations Levels [RunRox]📈 Liquidation Levels is an indicator designed to visualize key price levels on the chart, highlighting potential reversal points where liquidity may trigger significant price movements.
Liquidity is essential in trading - price action consistently moves from one liquidity area to another. We’ve created this free indicator to help traders easily identify and visualize these liquidity zones on their charts.
📌 HOW IT WORKS
The indicator works by marking visible highs and lows, points widely recognized by traders. Because many traders commonly place their stop-loss orders beyond these visible extremes, significant liquidity accumulates behind these points. By analyzing trading volume and visible extremes, the indicator estimates areas where clusters of stop-loss orders (liquidity pools) are likely positioned, giving traders valuable insights into potential market moves.
As shown in the screenshot above, the price aggressively moved toward Sell-Side liquidity. After sweeping this liquidity level for the second time, it reversed and began targeting Buy-Side liquidity. This clearly demonstrates how price moves from one liquidity pool to another, continually seeking out liquidity to fuel its next directional move.
As shown in the screenshot, price levels with fewer anticipated trader stop-losses are indicated by less vibrant, faded colors. When the lines become more saturated and vivid, it signals that sufficient liquidity - in the form of clustered stop-losses has accumulated, potentially attracting price movement toward these areas.
⚙️ SETTINGS
🔹 Period – Increasing this setting makes the marked highs and lows more significant, filtering out minor price swings.
🔹 Low Volume – Select the color displayed for low-liquidity levels.
🔹 High Volume – Select the color displayed for high-liquidity levels.
🔹 Levels to Display – Choose between 1 and 15 nearest liquidity levels to be shown on the chart.
🔹 Volume Sensitivity – Adjust the sensitivity of the indicator to volume data on the chart.
🔹 Show Volume – Enable or disable the display of volume values next to each liquidity level.
🔹 Max Age – Limits displayed liquidity levels to those not older than the specified number of bars.
✅ HOW TO USE
One method of using this indicator is demonstrated in the screenshot above.
Price reached a high-liquidity level and showed an initial reaction. We then waited for a second confirmation - a liquidity sweep followed by a clear market structure break - to enter the trade.
Our target is set at the liquidity accumulated below, with the stop-loss placed behind the manipulation high responsible for the liquidity sweep.
By following this approach, you can effectively identify trading opportunities using this indicator.
🔶 We’ve made every effort to create an indicator that’s as simple and user-friendly as possible. We’ll continue to improve and enhance it based on your feedback and suggestions in the future.
VIX:VIX3M RatioThe VIX/VIX3M Ratio indicator compares the short-term (1-month) volatility index (VIX) to the medium-term (3-month) volatility index (VIX3M). This ratio provides insights into the market's volatility expectations across different time horizons.
Key Interpretations:
Ratio > 1: Short-term volatility expectations are higher than 3-month expectations
Ratio = 1: Short-term and medium-term volatility expectations are aligned
Ratio < 1: Medium-term volatility expectations are higher than short-term expectations
Potential Trading Insights:
A rising ratio may indicate increasing near-term market uncertainty
Significant deviations from 1.0 can signal potential market stress or changing risk perceptions
Traders use this to gauge the term structure of market volatility

Crypto Market Session Guide with Local TimeMaster the Markets with the Ultimate Trading Session Indicator
Timing is everything in trading. Knowing when liquidity is at its peak and when market sessions overlap can make all the difference in your strategy. This Market Session Guide Indicator helps you navigate the trading day with real-time session tracking, countdown timers, and local time adjustments—giving you a clear edge in the market.
Key Features
Live Session Tracking – Instantly see which trading session is active: Asian, European, US, or the high-volatility EU-US overlap.
Automatic Local Time Conversion – No need to convert UTC manually—session times adjust automatically based on your TradingView exchange settings.
Daylight Saving Time Adjustments – The US market opening and closing times are automatically adjusted for summer and winter shifts.
Countdown Timer for Session Close – Know exactly when the current session will end so you can time your trades effectively.
Next Market Opening Display – Always be prepared by knowing which market opens next and at what exact time in your local timezone.
Clear Visual Guide – A structured table in the top-right of your chart provides all essential session details without cluttering your screen.
How It Works
This indicator tracks the three main trading sessions:
Asian Session (Tokyo, Sydney): 00:00 - 09:00 UTC
European Session (London, Frankfurt): 07:00 - 16:00 UTC
US Session (New York, Chicago): 13:30 - 22:00 UTC (adjusts automatically for Daylight Saving Time)
EU-US Overlap: 12:00 - 16:00 UTC, the most volatile period of the trading day
It also highlights when a session is about to close and when the next one will begin, ensuring you are always aware of liquidity shifts in the market.
Why You Need This Indicator
Optimized for Forex, Crypto, and Indices – Helps traders align their strategies with the most active market hours.
Ideal for Scalping and Day Trading – Enter trades during peak volatility to maximize opportunities.
Eliminates Guesswork – Stop manually tracking time zones and market schedules—everything updates dynamically for you.
Upgrade Your Trading Strategy Today
This indicator simplifies market timing, ensuring you're always trading when liquidity and volatility are at their highest. Whether you're trading Forex, Crypto, or Stocks, knowing when markets open and close is essential for making informed decisions.
Try it out, and if you find it useful, consider sharing it with other traders. Your feedback is always welcome!

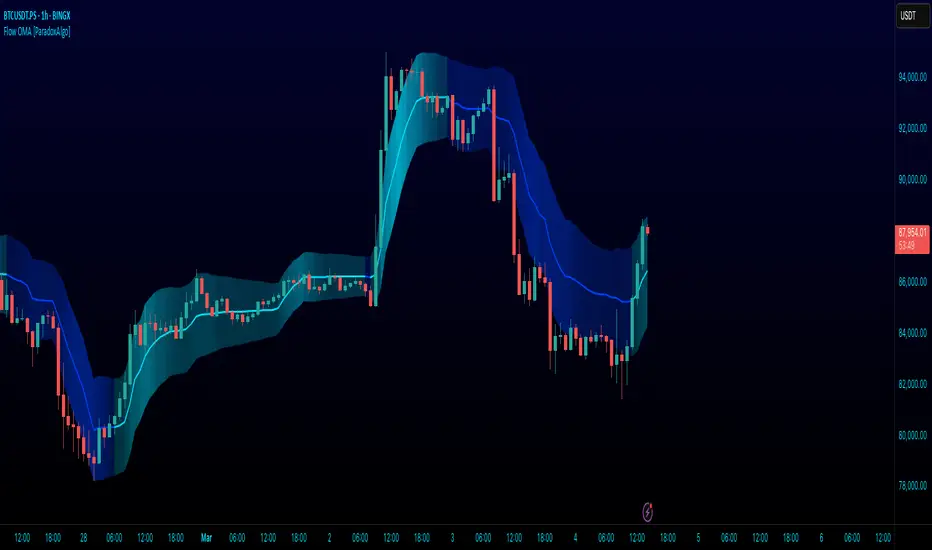
Flow Optimized Moving AverageOverview
The Flow Optimized Moving Average (Flow OMA) is an advanced adaptive moving average designed to dynamically adjust smoothing factors based on market efficiency and volatility. By integrating the Efficiency Ratio (ER) with an Adaptive Moving Average (AMA) and leveraging ATR-based bands, this indicator provides traders with a refined tool for identifying trend direction, strength, and potential reversal zones.
Key Features
Adaptive Moving Average (AMA)
Adjusts to price action based on the Efficiency Ratio (ER), reducing lag in trending markets while smoothing noise in ranging conditions.
Efficiency Ratio (ER)
Measures the effectiveness of price movement over a defined lookback period.
Helps in dynamically adjusting the smoothing constant of the AMA.
ATR-Based Volatility Bands
Creates upper and lower dynamic bands based on the Average True Range (ATR).
Expands in high volatility and contracts in low volatility, providing traders with a contextual understanding of price action.
Slope-Based Trend Strength
Normalizes the moving average slope relative to ATR.
Generates a trend strength score, which influences band opacity, making strong trends visually distinguishable.
Dynamic Color Coding
Bullish Trends: Cyan/Turquoise (#00e2ff)
Bearish Trends: Blue (#003ff5)
Neutral Trends: Gray
The transparency of the bands dynamically adjusts based on trend strength.
Fill Zone Effect
The area between the ATR bands is filled with a gradient-like effect, giving a clear visual representation of trend strength and transitions.
Indicator Components
Inputs (User Settings)
ER Lookback Period: Defines how many bars are used in the Efficiency Ratio calculation (default: 10).
Fast & Slow Periods: Control the sensitivity of the Adaptive Moving Average (default: 2 & 30).
ATR Period: Defines the lookback for Average True Range (default: 14).
Band Multiplier: Determines the width of ATR-based bands (default: 1.5).
Slope Average Period: Smooths trend slope for more stable trend assessment (default: 5).
Efficiency Ratio Calculation
Measures how effectively price moves in a straight line compared to its total movement.
A higher ER value suggests strong trend momentum, while a lower value implies consolidation.
Adaptive Moving Average (AMA)
Dynamically adjusts its smoothing factor based on ER.
Uses a smoothing constant that ranges between the fastest and slowest specified values.
Volatility-Based Bands
Constructed using the ATR multiplier.
Expand and contract dynamically in response to market volatility.
Trend Strength & Direction
Computed using the normalized slope of AMA against ATR.
Positive slope = Bullish trend, Negative slope = Bearish trend.
Visual Enhancements
Colored Adaptive MA Line: Changes based on trend direction.
ATR Bands with Gradient Fill: Visual representation of market conditions.
Dynamic Opacity: Highlights trend strength through transparency.
How to Use the Flow OMA Indicator
Trend Identification
When the Adaptive MA is rising and colored cyan, a bullish trend is in play.
When the Adaptive MA is falling and colored blue, a bearish trend is present.
Trend Strength Assessment
A stronger trend results in more opaque band fills, indicating a clear directional bias.
Weaker trends or consolidations result in fainter fills, signaling a loss of momentum.
Reversal Signals
If price touches the upper band in a bullish move and starts reversing, it can indicate potential profit-taking areas.
If price approaches the lower band in a bearish move and rebounds, a short-term reversal may be imminent.
Volatility Insights
Narrow bands indicate low volatility and possible breakout conditions.
Wider bands suggest increased volatility, warning traders of potential price swings.
Best Practices
✅ Combine with Other Indicators
Use RSI, MACD, or Volume Profile for confirmation before executing trades.
✅ Apply to Multiple Timeframes
Works effectively in higher timeframes (1H, 4H, Daily) for trend trading.
Can be utilized in lower timeframes (5m, 15m) for scalping setups.
✅ Adjust Parameters Based on Asset Volatility
Increase ATR Period for stocks with high volatility.
Reduce ATR Multiplier for forex pairs to avoid excessive band width.
The Flow Optimized Moving Average (Flow OMA) is a powerful trend-following tool designed for both swing and intraday traders. Its adaptive nature allows it to efficiently track trends while minimizing false signals. By incorporating dynamic volatility bands and trend-sensitive color coding, this indicator enhances traders' ability to read price action effectively. Whether used standalone or in combination with other indicators, Flow OMA provides a significant edge in trend analysis.
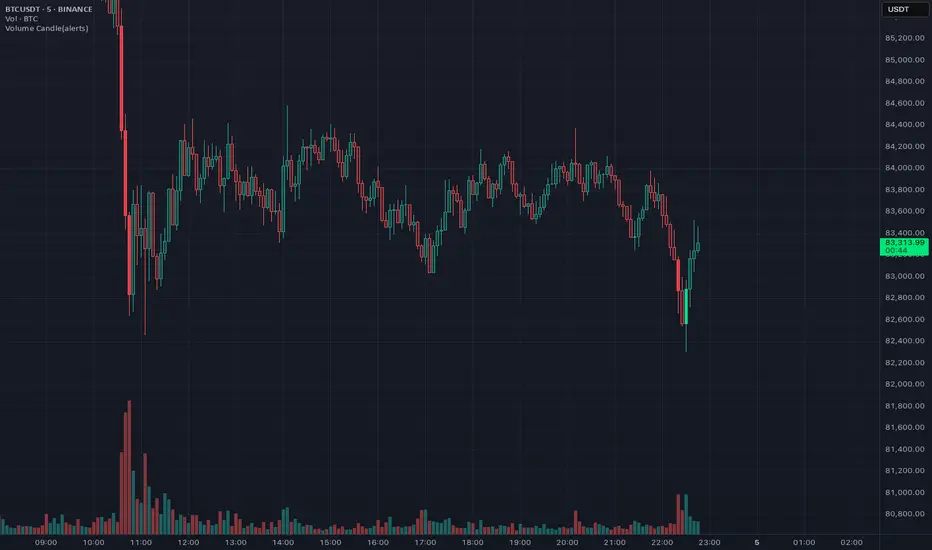
Volume Candle(alerts)This indicator highlights candles with unusually high trading volume by comparing the current volume to an EMA-based threshold. It helps identify significant volume spikes, which may indicate strong market movements.
Big Volume Detection
Compares the current volume to an EMA of past volume.
A candle is marked as "Big Volume" if the current volume exceeds the EMA by a specified multiple.
Color-Coded Candles
Big Volume & Bullish → Lime Green
Big Volume & Bearish → Red
Regular Bullish → Faded Lime (80% transparent)
Regular Bearish → Faded Red (80% transparent)
Alert System
Big Up or Down Volume → Triggers an alert when high volume occurs.
Big Up Volume → Triggers an alert for high-volume bullish candles.
Big Down Volume → Triggers an alert for high-volume bearish candles.
Customizable Settings
Period → EMA period for volume comparison (Default: 30)
Big Volume Multiple → Volume multiplier threshold for detection (Default: 3)
Use Cases
Spot unusual volume surges before major price moves
Confirm strong buying or selling pressure
Identify potential breakout zones
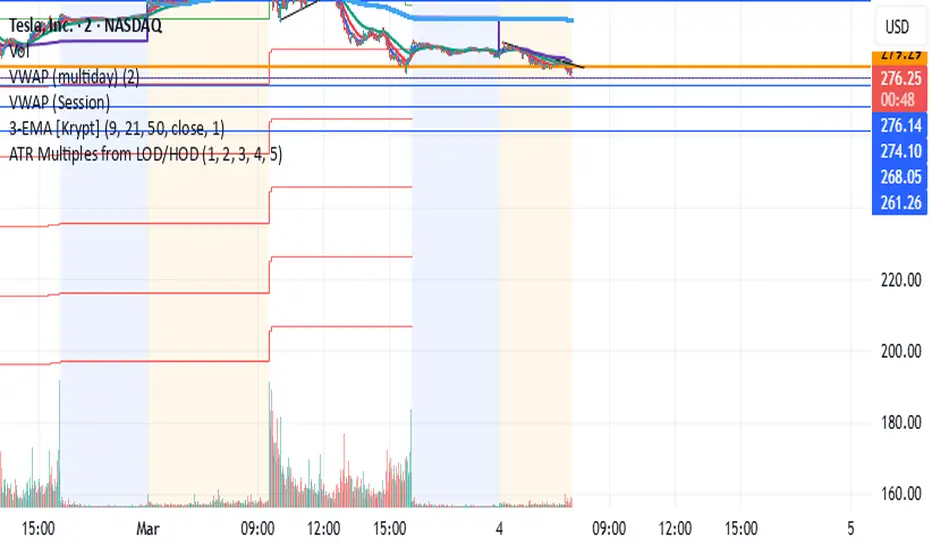
ATR Multiples from LOD/HODAn indicator that plots ATR (Average True Range) multiples from the current Low of Day (LOD) and High of Day (HOD). The indicator should:
Calculate the Low of Day (LOD) and High of Day (HOD) dynamically for the current trading session.
Use the ATR (Average True Range), with a customizable length, as the base measurement.
Plot multiple levels above the LOD and below the HOD, based on user-defined ATR multiples (e.g., 1x ATR, 2x ATR, 3x ATR, etc.).
Customizable Inputs:
ATR Length
ATR Multiples (Up to 5 levels)
Line color and style for each level
Display the ATR multiples on the chart as horizontal lines extending throughout the trading session.
QSL Upside/DownsideThe QSL Upside/Downside Indicator helps traders estimate potential gains and losses using Conditional Value at Risk (cVaR), a statistical measure that assesses both downside risk and upside potential beyond standard volatility. Instead of fixed timeframes (daily, weekly, etc.), traders can set a custom lookback period (in days) to analyze market behavior over their preferred time frame.
How It Works
The indicator calculates cVaR over the chosen period to determine how much an investment could move up or down based on past price behavior. It does this by:
• Mean Return – The average price movement over the period.
• Standard Deviation – Measures price fluctuations from the average.
• cVaR Confidence Interval (95%) – Estimates worst-case losses, meaning the downside projection reflects the worst 5% of expected losses.
• Upside Potential (Best 5%) – Instead of only considering risk, this indicator also calculates the potential upside by measuring returns in the top 5% of past price movements.
This provides a more complete view of what traders can expect—both in terms of risk and potential reward.
Key Features
✅ Custom Lookback Period – Set any number of days to analyze.
✅ cVaR Calculation (95% Confidence Interval) – Identifies extreme downside risks.
✅ Upside Potential (Best 5%) – Estimates how much an investment could rise in a best-case scenario.
✅ Clear Table Display – Quickly see projected best and worst-case portfolio values.
Understanding Probabilities: Upside & Downside Potential
Most traders focus on risk, but it’s equally important to understand potential gains. This indicator provides a probability-based view of expected market moves:
• 95% Confidence Interval (Downside cVaR) – There’s a 5% chance that losses could exceed this level.
• 95% Confidence Interval (Upside cVaR) – There’s a 5% chance that gains could be greater than this level.
• The remaining 90% of expected returns fall between these two extremes.
By knowing both potential losses and gains, traders can make more balanced, data-driven decisions rather than only focusing on worst-case scenarios.
Why Use This Indicator?
🔹 Better Risk & Reward Assessment – Understand both downside risk and upside potential.
🔹 More Realistic Market Projections – Uses probabilities instead of simple historical averages.
🔹 Flexible & Customizable – Works with any asset and any time period.
With this tool, QSL members can strategically plan trades, knowing the expected best and worst-case outcomes with a 95% probability range. 🚀

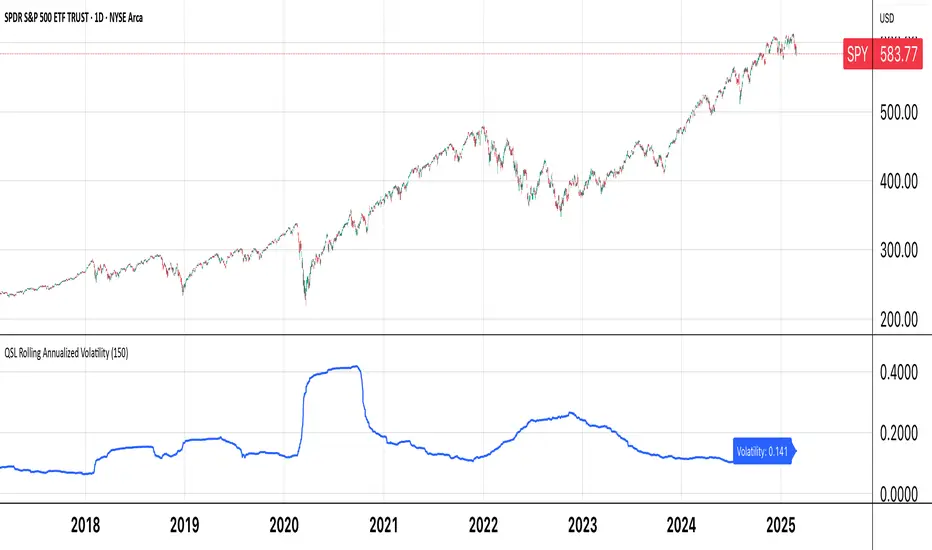
QSL Rolling Annualized VolatilityThis script calculates the rolling annualized volatility of an asset, helping traders measure how much its returns fluctuate over time. It uses logarithmic daily returns and computes the standard deviation over a custom lookback period (default: 252 trading days = 1 year) to capture historical volatility. The result is scaled to an annualized figure by multiplying by √252, making it comparable across different timeframes.
🔹 Key Features:
Customizable Lookback Period: Set in days to fit different trading strategies.
Annualized Output: Expresses volatility in yearly terms for consistency with financial models.
Rolling Calculation: Continuously updates to reflect recent market conditions.
Clear Visualization: Plots volatility as a time-series indicator and displays the latest value with a label.
This tool is ideal for risk management, position sizing, and strategy optimization in quantitative trading. 🚀
Bollinger Bands MTF & Kalman Filter | Flux Charts📈 Multi-Timeframe Kalman Filtered Bollinger Bands Indicator
Introducing our MTF Kalman Filtered Bollinger Bands – a powerful multi-timeframe Bollinger Bands (BB) indicator enhanced with Kalman filtering for superior smoothing and trend analysis. This indicator dynamically adapts Bollinger Bands across multiple timeframes while incorporating volume-based gradient transparency to highlight significant price movements. This indicator is better optimized for lower timeframes.
❓ How to Interpret the Bands & Volume Gradient:
Our indicator combines Lower Timeframe (LTF) and Higher Timeframe (HTF) Bollinger Bands to provide a comprehensive trend analysis. It applies Kalman filtering to the LTF bands, ensuring smoother, noise-reduced signals. The color gradient and relative volume-based transparency offer deeper insights into price strength.
🔹 LTF Bollinger Bands: Shorter-period bands filtered with a Kalman smoothing algorithm, reducing lag and noise.
🔹 HTF Bollinger Bands: Traditional Bollinger Bands plotted on a higher timeframe, offering macro trend analysis.
🔹 Volume Gradient Transparency: The bands adjust their opacity based on relative buy/sell volume, allowing traders to assess momentum strength.
📌 How Does It Work?
1️⃣ Multi-Timeframe Bollinger Bands Calculation
The LTF BB uses Kalman filtering for a smoother price representation, helping to reduce false signals.
The HTF BB is EMA-smoothed for improved trend clarity.
2️⃣ Adaptive Gradient Transparency
The opacity of the fill color between the bands is determined by relative buy/sell volume.
Higher buy volume = stronger bullish signal (greener bands).
Higher sell volume = stronger bearish signal (redder bands).
3️⃣ Dynamic Trend Signals & Breakouts
Buy Signal: When price breaks below the HTF lower band and LTF bands start rising.
Sell Signal: When price breaks above the HTF upper band and LTF bands start falling.
⚙️ Settings & Customization:
🛠 LTF and HTF Bollinger Bands Settings:
Multiplier: The multiplier applied to the BB to determine the upper and lower bands
Length: Define the number of bars determines the BB calculations.
Custom Timeframe Selection: Choose from predefined options (e.g., 5m, 15m, 1H, 4H, etc).
🎨 Gradient & Transparency Settings:
Bullish/Bearish Color Options: Customize colors for uptrend and downtrend conditions.
Max & Min Opacity: Adjust the transparency levels based on volume intensity.
Solid vs. Gradient Mode: Choose between a gradient fill or a solid color mode for clarity.
📌 Recommended Settings for Optimal Use:
1️⃣ Timeframe Selection (LTF -> HTF):
1 min -> 5 min
2 min -> 5 min
3 min -> 15 min
5 min -> 15 min
15 min -> 1 hr
1 hr -> 4 hr
4 hr -> 1 day
2️⃣ Multiplier: Use 2.0 for LTF and 2.25 for HTF
3️⃣Length: Use a length of 20 - 30 bars
🚀 Why Use This Indicator?
✅ Multi-Timeframe Bollinger Bands with Kalman Filtering – Ideal for traders looking for reduced lag and clearer trend signals.
✅ Volume-Based Transparency – See momentum shifts instantly with adaptive opacity.
✅ Dynamic Buy & Sell Signals – Alerts based on price action + volume trends.
✅ Customizable for Any Strategy – Adjust colors, timeframes, and filtering options for personalized trading.

Triangular Hull Moving Average + Volatility [BigBeluga]This indicator combines the Triangular Hull Moving Average (THMA) with a volatility overlay to provide a smoother trend-following tool while dynamically visualizing market volatility.
🔵 Key Features:
THMA-Based Trend Detection: The indicator applies a Triangular Hull Moving Average (THMA) to smooth price data, reducing lag while maintaining responsiveness to trend changes.
// THMA
thma(_src, _length) =>
ta.wma(ta.wma(_src,_length / 3) * 3 - ta.wma(_src, _length / 2) - ta.wma(_src, _length), _length)
Dynamic Volatility Bands: When enabled, the indicator displays wicks extending from the THMA-based candles. These bands expand and contract based on price volatility.
Trend Reversal Signals The indicator marks trend shifts using triangle-shaped signals:
- Upward triangles appear when the THMA trend shifts to bullish.
- Downward triangles appear when the THMA trend shifts to bearish.
Customizable Settings: Users can adjust the THMA length, volatility calculation period, and colors for up/down trends to fit their trading style.
Informative Dashboard: The bottom-right corner displays the current trend direction and volatility percentage, helping traders quickly assess market conditions.
🔵 Usage:
Trend Trading: The colored candles indicate whether the market is trending up or down. Traders can follow the trend direction and use trend reversals for entry or exit points.
Volatility Monitoring: When the volatility feature is enabled, the expanding or contracting wicks help visualize market momentum and potential breakout strength.
Signal Confirmation: The triangle signals can be used to confirm potential entry points when the trend shifts.
This tool is ideal for traders who want a responsive moving average with volatility insights to enhance their trend-following strategies.
