Pipstocrat Technical Patterns: EngVol, FVG & OBKey Features:
Fair Value Gaps (FVG): Highlights price imbalances where liquidity is likely to be filled.
Order Blocks (OB): Identifies key institutional buying and selling zones for potential reversals.
Wick-Based Supply & Demand (WSD): Detects areas of strong rejection for precise entry signals.
Engulfing Candle with Volume Confirmation: Marks strong reversals when supported by volume.
How to Use:
Look for rejection at OB, FVG, or WSD zones before entering a trade.
Confirm entry signals with engulfing candles backed by volume to reduce false breakouts.
Manage risk using a Risk-Reward Ratio (1:3 to 1:9) for optimal trade execution.
This indicator is ideal for traders who follow smart money concepts and want to align with institutional liquidity movements. It provides real-time visual cues for entry and exit, helping traders refine their strategy and increase their edge in the market.
Volume

EMA Ribbon + Volume Profile (Combined Indicator)I combine the Volume Profile script from kv4coins () with EMA Ribbon (inspired by @mondays_range on X).
⚠️ Only enable the buy signal plot on the total market cap chart like TOTAL, TOTAL2, TOTAL3, or OTHERS. The bigger the tier, the better the signal. This is the first version, I will update this gradually when I have time.
Always DYOR. Don't trust, verify!

MOHAMMED ALSAAB - توصية تداول ثابتة داخل اليوم (5 دقائق)تداول داخل اليوم على أساس فترة زمنية قصيرة (5 دقائق). يعتمد المؤشر على:
المؤشرات الفنية:
المتوسط المتحرك البسيط (SMA): يستخدم لتحديد الاتجاه العام للسعر.
مؤشر القوة النسبية (RSI): يستخدم للكشف عن حالات التشبع في الشراء والبيع.
إشارات الدخول:
شراء (لونق): عندما يكون السعر فوق المتوسط المتحرك و RSI تحت مستوى التشبع في الشراء.
بيع (شورت): عندما يكون السعر تحت المتوسط المتحرك و RSI فوق مستوى التشبع في البيع.
وقف الخسارة والهدف:
يتم تحديد وقف الخسارة والهدف بناءً على حركة السعر القريبة (نسبة مئوية من السعر الحالي).
عرض التوصية:
يظهر الجدول بشكل دائم أو عند تفعيل إشارة الدخول، حيث يعرض نوع الصفقة، سعر الدخول، الهدف ووقف الخسارة.
الهدف هو مساعدة المتداولين على اتخاذ قرارات تداول مستندة إلى إشارات فنية واضحة ومدعومة بالبيانات المرئية في الوقت الفعلي.

TBRSV - Trend Bias & Reversal Signals with Volatility SqueezesThe "TBRSV" indicator is designed to identify the prevailing trend direction, potential reversal points, and squeeze breakouts. It achieves this by combining several technical analysis tools:
EMA-Based Trend Bias: It uses a fast and slow Exponential Moving Average (EMA) to determine the overall trend direction. The directionalBias line visually represents this bias, with lime indicating an uptrend, red indicating a downtrend, and orange signalling a potential trend change.
Reversal Confirmation: The indicator identifies potential reversal points by looking for price action that breaks the recent trend. If the price makes a new low during an uptrend or a new high during a downtrend within a specified look back period, it considers this a reversal signal.
Reversal Signals: Confirmed reversals are marked with lime (bullish) or red (bearish) dots on the chart. These dots suggest potential entry or exit points.
Squeeze Detection: The indicator uses Bollinger Bands and Keltner Channels to identify periods of consolidation, or "squeezes," where volatility is low.
Squeeze Breakout Signals: It identifies high-volume breakouts from these squeezes. A white upward-pointing triangle signals a bullish breakout, while a white downward-pointing triangle signals a bearish breakout.
How to Best Use the Indicator
1. Determine the Trend Bias: Use the color of the directionalBias line to quickly assess the current trend.
2. Identify Potential Reversal Zones: Pay attention to the orange areas, which signal times of indecision and potential trend changes.
3. Confirmed Reversal Signals: Look for lime or red dots. These dots indicate high-probability reversal points and potential entry or exit points.
4. Squeeze Breakout Signals: Trade in the direction of the breakout.
5. Combine with Other Indicators: Enhance signals from the "Trend Bias & Reversal Signals" indicator with other tools, such as volume analysis, RSI, MACD, trend lines, or candlestick patterns.
6. Consider Trend Strength: Not all trends are equal. Adjust your trading strategy based on the strength of the trend.
7. Weighted Trade Signals: Consider using the indicator in conjunction with weighted trade signals, giving more weight to signals aligned with the trend bias.
By understanding the components of the "Trend Bias & Reversal Signals with Volume Squeezes" indicator and how they work together, you can use it to identify high-probability trading opportunities and improve your overall trading performance. Remember to adapt your approach to different market conditions and trading styles.

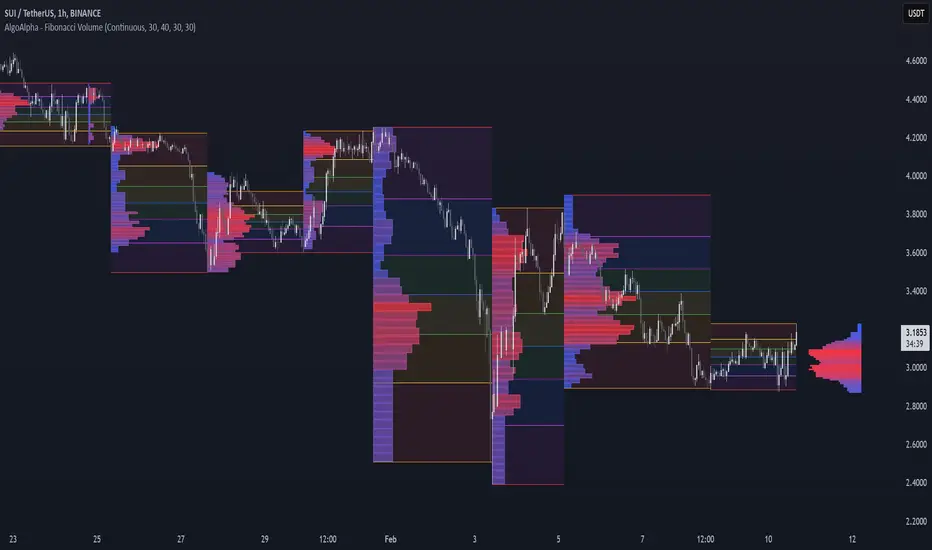
Fibonacci Volume Profiles [AlgoAlpha]Unlock a deeper understanding of price action with the Fibonacci Volume Profiles indicator by AlgoAlpha! This powerful tool blends Fibonacci retracement levels with customizable volume profiles, helping traders identify high-probability areas of support, resistance, and accumulation. Designed for both continuous dynamic levels and custom time periods, this indicator is a must-have for traders seeking confluence in market structure analysis.
🔑 Key Features
📈 Dual Mode Selection : Choose between Continuous Fibonacci levels, which adapt dynamically to pivots, or a Custom Period mode, where you set your own start and end points.
📊 Integrated Volume Profile : Visualize volume distributions at key Fibonacci retracement levels, revealing areas of strong buying/selling interest.
🎨 Customizable Colors & Transparency : Adjust Fibonacci level colors, fill zones, and profile transparency for a visually clear experience.
🔍 Profile Resolution & Scaling : Control the number of price levels and width of the volume profile for detailed market insights.
🛠 Extendable Levels : Optionally extend Fibonacci levels to the right of the chart for better visualization of future price interaction.
📌 How to Use
Add the Indicator: Click on the star icon to add it to your favorites and apply it to your TradingView chart.
Analyze The Market: Observe how price interacts with Fibonacci levels alongside the volume profile to confirm support/resistance zones. Switch between custom range or continuous mode to align the tool with your trading style.
⚙️ How It Works
The indicator calculates pivot highs/lows dynamically (or uses user-defined time periods) to plot Fibonacci retracement levels. It then builds a volume profile by analyzing historical volume data, grouping it into price bins to highlight volume-heavy zones. The Point of Control (PoC) is identified as the level with the highest traded volume, acting as a key price magnet. The color-coded Fibonacci levels help traders spot retracement zones, while the volume profile confirms strength or weakness in those areas.
AI Volume Trend Indicator_Finpire🔍 Introduction
The AI Volume Trend Indicator is a powerful tool designed to help traders detect breakout opportunities, institutional accumulation, and distribution in the stock market. This indicator identifies volume contraction, liquidity levels, and On-Balance Volume (OBV) trends, providing insights into potential breakouts and trend reversals.
Perfect for traders who follow Mark Minervini’s SEPA Strategy, Wyckoff Volume Analysis, and Institutional Accumulation Concepts. 🚀
📊 Key Features
1️⃣ Volume Contraction (Breakout Alert)
🔹 Identifies low volume contractions where current volume is < 75% of the 50-day average volume.
🔹 Breakouts often occur after a period of volume contraction, making this a key filter for traders.
🔹 Yellow Triangle (🔼) appears below volume bars when contraction is detected.
2️⃣ Institutional Accumulation & Distribution
📈 Green Circle (🟢) - Institutional Buying (Accumulation)
🔹 OBV (On-Balance Volume) is rising, and liquidity is high.
🔹 Suggests big players are accumulating shares in preparation for a breakout.
📉 Red Cross (❌) - Institutional Selling (Distribution)
🔹 OBV is declining, and liquidity is high.
🔹 Indicates institutional selling pressure, signaling potential trend weakness or reversal.
3️⃣ Volume Bar Coloring for Easy Trend Recognition
✅ Green Bars: Strong institutional accumulation (bullish trend).
✅ Red Bars: Distribution phase (potential selling pressure).
✅ Orange Bars: Volume contraction detected (possible breakout setup).
✅ Gray Bars: Neutral volume behavior.
📢 Alerts & Notifications
💡 Set custom alerts to be notified when:
🔸 Volume contraction is detected (Breakout Watch Alert)
🔸 Institutional buying is occurring (Accumulation Alert)
🔸 Institutional selling is detected (Distribution Alert)
These alerts ensure you never miss a key trade setup! 🚀
📌 How to Use
1️⃣ Apply this indicator on any stock or crypto chart.
2️⃣ Look for Yellow Triangles (🔼) below volume bars to find breakout setups.
3️⃣ Watch for Green Circles (🟢) at the top of bars to spot institutional accumulation.
4️⃣ Be cautious when Red Crosses (❌) appear, signaling distribution.
5️⃣ Set alerts to automate trading decisions.
⚡ Ideal For:
✅ Breakout Traders
✅ Trend Followers looking for institutional support
✅ Swing Traders & Position Traders who want high-probability setups
✅ Crypto & Forex Traders applying volume-based strategies
🔗 Add to Your Trading Toolkit Today!
This AI-powered volume trend indicator simplifies volume analysis and helps identify high-probability trades with institutional backing. 🚀
💬 Let us know your feedback & improvements! Happy Trading! 🔥
🚀 #TradingView #VolumeAnalysis #Minervini #BreakoutTrading #InstitutionalFlow #StockMarket #CryptoTrading #WyckoffMethod

Anti-Humanity KDJ + Big whale indicator原作者:© blackcat1402
L2 KDJ with Whale Pump Detector 是一个结合 KDJ 震荡指标 与 鲸鱼资金动向检测 的交易指标,旨在帮助交易者识别市场趋势反转点,并捕捉机构或大资金(“鲸鱼”)的进场信号。该指标主要通过 KDJ 计算市场超买超卖状态,并结合 OBV 资金流动分析 及 鲸鱼资金流入检测(Whale Pump),辅助判断买卖时机。
鲸鱼入场检测(Whale Pump Detector)
通过 最低价波动分析、加权移动均值(WMA) 及 ATR 波动幅度计算,检测是否存在大资金介入迹象。
以 柱状图(Histogram) 形式绘制鲸鱼买入信号,并提供冷却期(Cool Down)以减少噪音。
KDJ 震荡指标
计算 RSV(未成熟随机值)后,通过 平滑加权均值(XSA 计算) 生成 K(快线)、D(慢线) 及 J(超买超卖线)。
当 J 线上穿特定阈值时,提示 买入(Buy Alert),反之提示 卖出(Sell Alert)。
OBV 资金流向确认
采用 OBV 指标(成交量累积动量)确认趋势。
仅当 OBV 显示资金流入时,鲸鱼入场信号才有效,避免误判。
多周期趋势确认
结合 日线(D)最低价数据 进行多周期趋势确认,提高信号可靠性。
交易信号与警报
当 KDJ 触发买入/卖出信号,背景颜色改变,并弹出警报(Alert)。
自动生成 B(买入)/S(卖出)标签 以直观显示信号位置。

RSI, Stochastic, and Volume Combined by joegtec v3.1RSI and Stochastic Combined by joegtec v3.1
-rsi , it can remove from graph
-sto , it can remove from graph
-volume , it can remove from graph
this version for test by joegtec

The Up or Down Indicator (TUDI)The Up or Down Indicator
This indicator provides a comprehensive view of trend direction, strength, potential breakout opportunities, as well as trend reversals, helping traders quickly assess the market's overall bias and identify potential entry points.
Key Features:
Directional Bias Line: A color-coded line (seafoam green for uptrend, coral red for downtrend, and orange for transition) that visually represents the current trend direction. The saturation of the color indicates the strength or momentum of the trend.
Confirmation Dots: Seafoam green dots appear at the bottom of the chart to confirm potential bullish moves, while coral red dots appear at the top to confirm potential bearish moves. The saturation of the dot colors indicates the momentum.
Background Color: A subtle seafoam green or coral red background shading provides an additional visual cue for the overall trend direction.
Squeeze Arrows: White arrows (upward and downward pointing) appear when a squeeze (Bollinger Bands inside Keltner Channels) and high volume are detected, suggesting a potential breakout. Upward arrows indicate potential long breakouts, while downward arrows indicate potential short breakouts.
How to Use:
Follow these steps to effectively use the Up or Down Indicator:
1. Identify the Primary Trend: Use the Directional Bias Line to determine the overall trend direction.
- Seafoam green = Uptrend (stronger as the green becomes more saturated)
- Coral red = Downtrend (stronger as the red becomes more saturated)
- Orange = Caution, Potential Trend Change (suggesting you should tighten stops or wait for further confirmation)
2. Watch for Confirmation Signals: Look for Confirmation Dots to confirm potential bullish or bearish moves.
- Increasing saturation in dots = Growing momentum
3. Anticipate Breakouts: Use Squeeze Arrows to anticipate potential breakouts.
- Upward arrow during uptrend = Potential strong continuation
- Downward arrow during downtrend = Potential strong continuation
4. Confirm Signals: Always consider the overall market context and use other indicators or analysis techniques to confirm signals before making any trading decisions.
Disclaimer:
This indicator is for informational purposes only and should not be used as the sole basis for making trading decisions. Trading involves risk, and past performance is not indicative of future results. Always conduct thorough research and consult with a qualified financial advisor before making any investment decisions.

SCAE MJ VolSpikeCustom indicator named "SCAE MJ VolSpike." It combines multiple technical analysis tools, including EMAs (Exponential Moving Averages), KDJ, MACD, and volume spike detection, to generate buy/sell signals and overbought/oversold alerts. Below is a breakdown of the script's functionality:
Key Components of the Script
1. Input Parameters:
- Users can customize the periods for KDJ, MACD, lookback, and volume spike thresholds.
- Parameters include:
- P1, P2, P3 for KDJ periods.
- SHORT, LONG, M for MACD periods.
- N for the lookback period.
- volume_spike_buy_multiplier, volume_spike_pullback_multiplier and volume_spike_sell_multiplier for volume spike thresholds.
- volume_ma_period for the volume moving average.
2. EMA Calculations:
- The script calculates EMAs for periods 5, 9, 21, 42, and 200.
- These EMAs are plotted on the chart with different colors for visualization.
3. KDJ Calculation:
- The KDJ indicator is calculated using the formula:
- RSV (Raw Stochastic Value) = (close - lowest(low, P1)) / (highest(high, P1) - lowest(low, P1)) * 100
- K = SMA of RSV over P2 periods.
- D = SMA of K over P3 periods.
- J = 3 * K - 2 * D.
4. MACD Calculation:
- The MACD is calculated as:
- DIF = EMA(close, SHORT) - EMA(close, LONG).
- DEA = EMA(DIF, M).
- MACD = (DIF - DEA) * 2.
5. Normalization and Scaling:
- The script normalizes the KDJ and MACD values to align them on a similar scale for comparison.
- This ensures that the indicators can be used together effectively.
6. Volume Spike Detection:
- A volume spike is detected when the current volume exceeds the moving average of volume (volume_ma) plus a multiple of the standard deviation (volume_std).
- Two thresholds are used:
- volume_spike_buy_threshold and volume_spike_sell_threshold for significant spikes.
- volume_spike_pullback_threshold for pullback conditions.
7. Buy/Sell Conditions:
- Buy Signal:
- Triggered when:
- DIF crosses above DEA.
- Volume exceeds the spike threshold.
- Price is above the 9 EMA and 200 EMA.
- Alternatively, a buy signal is triggered during a pullback if the price is above the 21 EMA but below the 200 EMA.
- Sell Signal:
- Triggered when:
- DIF crosses below DEA.
- Volume exceeds the spike threshold.
- Price is below the 9 EMA but above the 21 EMA.
- Overbought/Oversold Conditions:
- Overbought: J_new > 90.
- Oversold: J_new < -90.
8. Plotting and Alerts:
- Buy/sell signals are plotted as arrows on the chart.
- Alerts are set up for:
- Buy signals.
- Pullback signals.
- Sell signals.
- Overbought/oversold conditions.
How to Use the Indicator
1. Add the script to a TradingView chart.
2. Customize the input parameters as needed.
3. Look for buy/sell signals indicated by arrows on the chart.
4. Use the alerts to get notified of trading opportunities.
Example Use Case
- Buy Signal: When the MACD (DIF) crosses above the signal line (DEA) and volume spikes, a green "B" arrow appears below the price bar.
- Sell Signal: When the MACD crosses below the signal line and volume spikes, a red "S" arrow appears above the price bar.
- Overbought/Oversold: Yellow arrows indicate potential reversal points when the KDJ indicator is in overbought or oversold territory.
This script is a tool for traders who want to combine multiple indicators into a single, cohesive strategy. It can be further customized to suit specific trading styles or asset classes.

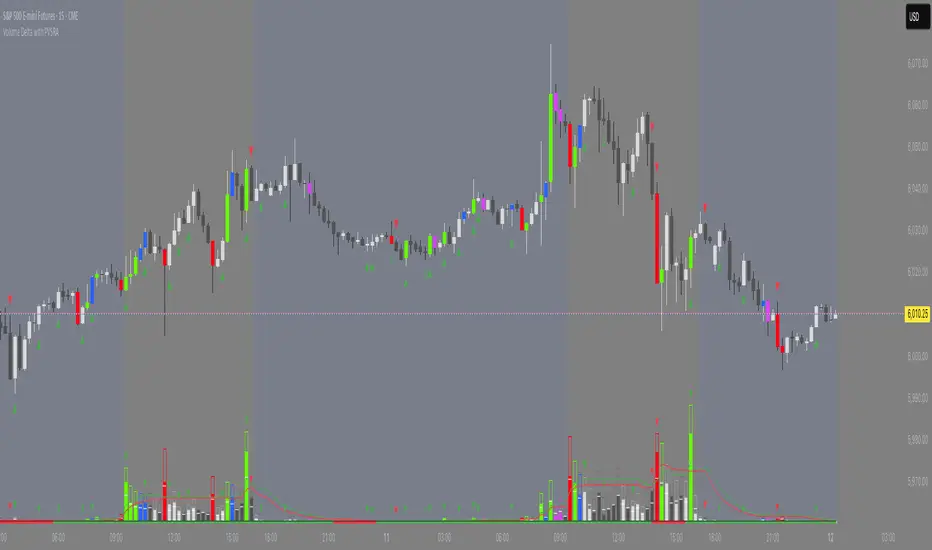
Volume Delta with PVSRAVolume Delta with PVSRA
Volume Delta with PVSRA is an advanced volume indicator that dissects each bar’s volume into its directional components using higher resolution data. It visually distinguishes between buying and selling volume, so that for a bullish candle the bottom portion represents buying volume and for a bearish candle it represents selling volume. A dot is plotted at the 50% mark of the candle’s total volume, serving as a clear reference point.
Key Features:
Directional Volume Breakdown:
The indicator calculates the delta volume by analyzing lower timeframe data. The bottom portion of a bullish candle (displayed in green) represents buying volume, while that of a bearish candle (displayed in red) represents selling volume.
PVSRA Analysis:
Using Price-Volume Spread Range Analysis, the indicator compares the current volume to the 10-bar average. When volume is significantly higher (using thresholds of 150% and 200%), the candle borders are highlighted in custom colors, indicating medium or strong volume conditions.
Volume Moving Averages:
Three moving averages are plotted:
Total Volume MA (yellow): Tracks overall volume.
Buying Volume MA (green) and Selling Volume MA (red): These are re-centered around the total volume MA. A crossover of the green over the red typically signals rising buying pressure, while the opposite indicates increasing selling pressure.
Scalable Volume Bars:
The indicator scales the volume bars to provide optimal visualization on your chart.
Setup Instructions:
For best results, open your chart settings, navigate to the Canvas tab, and set the bottom margin to 0%. This ensures the indicator displays like a standard volume indicator without any unwanted gaps at the bottom.
Customize the various settings—including colors, border opacity, and moving average parameters—to suit your trading style.
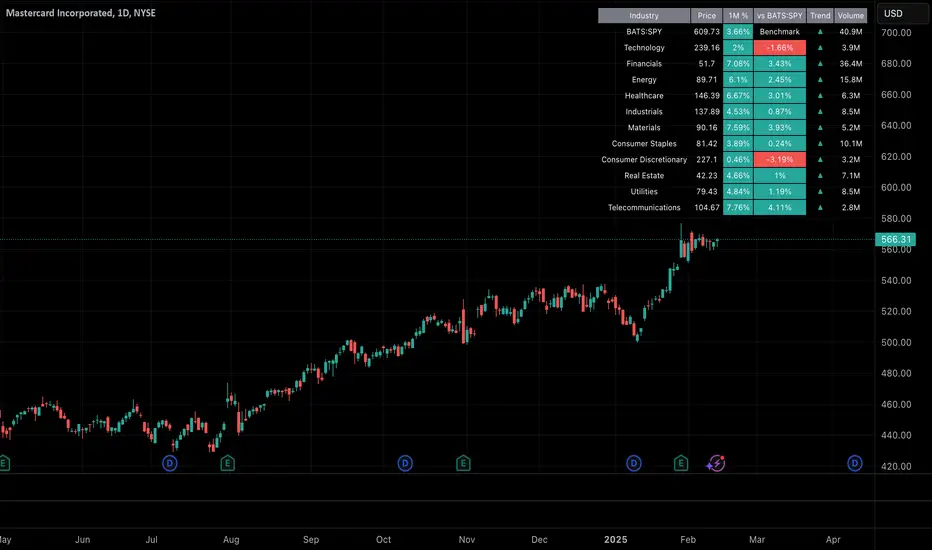
Industry Indices ComparisonA dynamic industry sector performance comparison indicator that helps traders and investors track relative strength across different market sectors in real-time.
- Compares up to 5 industry sector ETFs against a benchmark index (default: SPY)
- Displays key metrics including:
* Performance % over selected timeframe
* Relative performance vs benchmark
* Trend direction (▲ up, ▼ down, − neutral)
* Volume in millions (M) of shares traded
- Configurable timeframes: 1D, 1W, 1M, and 3M comparisons
- Color-coded performance indicators (green for outperformance, red for underperformance)
- Customizable table position and text size for optimal chart placement
The indicator helps identify:
1. Sector rotation patterns through relative performance
2. Leading and lagging sectors vs the broader market
3. Volume trends across different sectors
For traders, if you are considering two equally good setups, then choosing the setup belonging to a currently strong sector could be beneficial.
Strat SRSI, MACD, Volume, VolatilitéCette stratégie combine plusieurs indicateurs pour détecter des opportunités de trading :
Meilleurs résultats en 1D
MACD Normalisé : Utilisé pour repérer les croisements entre la ligne MACD et la ligne de signal.
Stoch RSI Normalisé : Détecte les conditions de surachat et de survente.
WVAD Normalisé (Accumulation/Distribution) : Évalue la pression d'achat ou de vente via le volume et les prix.
ATR : Mesure la volatilité pour éviter les faux signaux en conditions de faible volatilité.
Conditions d'achat :
Croisement haussier du MACD normalisé OU Stoch RSI inférieur à 0,3.
Volume supérieur à la moyenne.
WVAD indiquant une pression d'achat.
Volatilité suffisante selon l’ATR.
Conditions de vente :
Croisement baissier du MACD normalisé OU Stoch RSI supérieur à 0,6.
WVAD indiquant une pression de vente.
Volatilité suffisante selon l’ATR.
Gestion des positions :
Entrée : Un ordre long est ouvert lorsque les conditions d'achat sont remplies.
Sortie : La position est clôturée lorsque les conditions de vente sont déclenchées.
Cette stratégie vise à maximiser les entrées en tendance et à minimiser les faux signaux grâce à des filtres basés sur le volume et la volatilité.

Moving Volume DensityMoving Volume Density (MVD) is a custom TradingView indicator written in Pine Script™ (version 6) that blends volume analysis with price range data to offer a unique perspective on market dynamics. By measuring the total volume over a specified period and relating it to the price range during the same interval, this indicator provides valuable insights into the concentration of trading activity relative to price movement.
Key Features:
User-Defined Period: The indicator uses an input period (default 20 bars) to calculate both the total volume and the price range. This flexibility allows you to tailor the analysis to your preferred timeframe.
Volume Calculation: It computes the sum of the volume over the defined period, capturing the cumulative trading activity.
Price Range Determination: The indicator identifies the highest high and the lowest low within the period, calculating the price range (difference between the two). This range serves as the denominator in the density calculation.
Volume Density Computation: Volume Density is derived by dividing the total volume by the price range. This metric reveals how concentrated the volume is within the observed price movement. To prevent division errors, the calculation returns 'NA' when the price range is zero.
Visual Representation: The resulting Volume Density is plotted as a line on a separate sub-window, making it easy to compare with other indicators or overlay your analysis.
「Moving Volume Density (MVD) インジケーター」は、Pine Script™(バージョン6)で作成されたカスタムインジケーターです。出来高の分析と、指定期間内の高値・安値による価格レンジの情報を組み合わせることで、市場のダイナミクスに対する独自の視点を提供します。指定された期間内の合計出来高とその期間内の価格レンジの比率から、価格変動に対する出来高の集中度を示す指標となります。
主な特徴:
ユーザー定義の期間: インジケーターは、入力された期間(デフォルトは20本のバー)を基に、合計出来高と価格レンジ(最高値と最安値の差)の両方を計算します。これにより、ご自身の分析に合わせた柔軟な設定が可能です。
出来高の計算: 指定期間内の全出来高を合計することで、累積的な取引活動を把握します。
価格レンジの算出: 期間内の最高値と最安値を取得し、その差を価格レンジとして算出。このレンジは、出来高密度の計算における分母として使用されます。
出来高密度の計算: 合計出来高を価格レンジで割ることで、出来高がどれだけ価格変動内に集中しているかを示す「出来高密度」を求めます。なお、価格レンジがゼロの場合はゼロ除算を避けるため「NA」を返す設計となっています。
視覚的な表現: 計算結果はサブウィンドウにラインとしてプロットされ、他のインジケーターとの併用や比較が容易に行えます。

Engulfing Pattern with Volume and EMAs
**Strategy Overview:
This strategy combines price action (Engulfing patterns), volume analysis, trend confirmation (EMAs), and noise reduction (ATR filter) to generate high-probability trading signals.
Engulfing Pattern with Volume, EMAs, and Market Noise Filter**
This strategy identifies bullish and bearish Engulfing candlestick patterns, combined with volume analysis, moving averages (EMAs), and a market noise filter to generate trading signals.
**Key Components:**
1. **Engulfing Pattern Detection:**
- **Bullish Engulfing**: A green candle completely engulfs the previous red candle.
- **Bearish Engulfing**: A red candle completely engulfs the previous green candle.
2. **Volume Filter:**
- Signals are validated only if the current volume is higher than the 20-period Simple Moving Average (SMA) of volume.
3. **EMA Indicators:**
- Three EMAs are plotted: 50-period (blue), 89-period (orange), and 200-period (red).
- These EMAs help identify the trend direction and provide additional confirmation.
4. **Market Noise Filter:**
- Uses the Average True Range (ATR) to filter out insignificant price movements.
- A signal is considered valid only if the price movement (absolute difference between open and close) is greater than 0.5 times the 14-period ATR.
**Trading Signals:**
**Buy Signal**:
- Bullish Engulfing pattern + High volume (above SMA 20) + Significant price movement (filtered by ATR).
- Plotted as a green "BUY" label below the candle.
**Sell Signal**:
- Bearish Engulfing pattern + High volume (above SMA 20) + Significant price movement (filtered by ATR).
- Plotted as a red "SELL" label above the candle.
**Customization:**
- Users can adjust EMA lengths, volume SMA period, and ATR multiplier to suit their trading preferences.


Volume Data Customized TimeframeThe "Volume Data Customized Timeframe" (VolData CTF) indicator provides traders with an enhanced volume analysis tool that aggregates buy and sell volume over a user-defined timeframe. It enables a comparative assessment of bullish and bearish volume trends, offering deeper insights into market sentiment. The indicator features a customizable display table with user-selectable themes and positioning, providing essential volume metrics for improved trading decisions.
1. Introduction:
The "Volume Data Customized Timeframe" indicator is designed to help traders analyze volume trends across different timeframes. It allows users to customize the period for volume calculations, view the ratio of selling to buying volume, and present the data in a user-friendly table format.
2. Features:
Selectable timeframe for volume analysis (default: chart timeframe)
Calculation of bullish (buy) and bearish (sell) volume
Customizable table size, theme, and positioning
Displays key volume metrics:
Total Buy Volume
Total Sell Volume
Sell/Buy Volume Ratio
Analysis period in minutes, days, weeks, or months
3. Indicator Inputs:
Average Volume Lookback (n): Number of bars used to calculate volume statistics.
Select Timeframe: Custom timeframe for volume calculations (leave empty to use the chart's timeframe).
Table Size: Choose from Small, Medium, or Big to adjust text size.
Table Theme: Choose between Light and Dark themes.
Table Position: Place the table in any corner of the chart (top-left, top-right, bottom-left, bottom-right).
4. How It Works:
The indicator retrieves volume data for the selected timeframe.
It aggregates bullish and bearish volume based on the lookback period.
The sell-to-buy volume ratio is calculated and color-coded (green for bullish dominance, red for bearish dominance).
The volume statistics are displayed in a customizable table for easy reference.
5. Interpretation:
Δ BUY VOL: Represents the total volume of bullish (up-closing) bars within the lookback period.
Δ SELL VOL: Represents the total volume of bearish (down-closing) bars within the lookback period.
Δ SELL/Δ BUY: The ratio of bearish to bullish volume; values above 1 indicate more selling pressure, while values below 1 indicate buying dominance.
Period (M/D/W/M): Displays the selected timeframe for volume aggregation.

Price Volume Trend Oscillator AlertsA simple smoothed PVT oscillator with adjustable high and low thresholds and an exponential average thrown in.
Gives entry and exit signals when PVT (orange) crosses EMA (blue) or PVT crosses midline for the more cautious.
Look for divergences for beetter results.
Alerts for everything; threshold crosses, ema crosses and midline crosses.
Experimenting with settings might improve (or worsen) results!
Never rely on one indicator.
Good luck!

VANTAIChỉ báo sức mạnh khối lượng
Chỉ báo MCDX+RSI+SMA được thiết kế để giúp các nhà đầu tư tiến hành phân tích sâu hơn về xu hướng thị trường bằng cách kết hợp nhiều yếu tố kỹ thuật vào một biểu đồ duy nhất. Sự tích hợp các chỉ báo phổ biến như RSI, SMA và RSI ngẫu nhiên này cung cấp cho các nhà đầu tư cái nhìn toàn diện về các biến động của thị trường, đặc biệt là trong việc phân biệt giữa "Banker" và "Hot Money"—đại diện cho dòng vốn lớn và nhỏ.
1. **RSI cho Banker và Hot Money:**
- **RSI (Chỉ số sức mạnh tương đối)** là một bộ dao động động lượng đo tốc độ và sự thay đổi của các biến động giá, cho biết tình trạng mua quá mức hoặc bán quá mức. Trong chỉ báo này, có hai đường RSI riêng biệt được cấu hình cho Banker (vốn lớn) và Hot Money (vốn nhỏ).
- Các nhà đầu tư có thể điều chỉnh các thông số như chu kỳ tính toán RSI, mức cơ sở và độ nhạy cho từng loại dòng vốn, mang lại sự linh hoạt để thích ứng với các điều kiện thị trường khác nhau.
2. **Đường trung bình động (MA) của RSI:**
- Chỉ báo này sử dụng hai loại Đường trung bình động phổ biến: **SMA (Đường trung bình động đơn giản)** và **EMA (Đường trung bình động hàm mũ)**. Những loại này giúp làm mịn các tín hiệu RSI cho Banker, cung cấp góc nhìn rõ ràng hơn về xu hướng dài hạn của vốn lớn trên thị trường.
- Các nhà đầu tư có thể chọn loại và chu kỳ của MA, cho phép họ tối ưu hóa chỉ báo cho phong cách giao dịch của mình.
3. **RSI ngẫu nhiên:**
- **RSI ngẫu nhiên** được kết hợp để theo dõi các điều kiện mua quá mức và bán quá mức trong một khung thời gian cụ thể. Các tham số liên quan đến %K và %D của Stochastic cũng có thể được điều chỉnh để tinh chỉnh độ chính xác của phân tích tín hiệu thị trường.
- Một tính năng đáng chú ý là việc chuẩn hóa %K và %D trên thang điểm 0-20, khiến các đường này tương thích với các biểu đồ RSI khác, do đó mang lại sự nhất quán trong việc đánh giá sức mạnh của thị trường.
4. **Mức quá mua và quá bán:**
- Chỉ báo bao gồm các đường tham chiếu cho mức quá mua và quá bán, hỗ trợ nhà đầu tư xác định các vùng đảo chiều tiềm năng trên thị trường. Điều này giúp tránh mua ở mức giá quá cao hoặc bán ở mức giá quá thấp.

Demo GPT - Trend Trader StrategyIt is a great strategy in 30 mins time frame, you can use it to algo trading

Cryptelo - Multi-Indicator Trend Shift DetectorThis "Multi-Indicator Trend Shift Detector" combines four key technical indicators—RSI, Money Flow Index (MFI), VWAP, and MACD—to pinpoint potential trend reversals. It works by:
RSI & MFI: Evaluating momentum, where values above 50 suggest bullish strength and below 50 indicate bearish pressure.
VWAP: Providing a daily average price reference that resets each day, helping to gauge if the price is trading above (bullish) or below (bearish) its volume-weighted average.
MACD: Confirming momentum through the relationship between the MACD line and its signal line.
When all these conditions align, the indicator identifies a trend shift and plots an arrow on the chart, making it easier for traders to spot entry or exit opportunities.

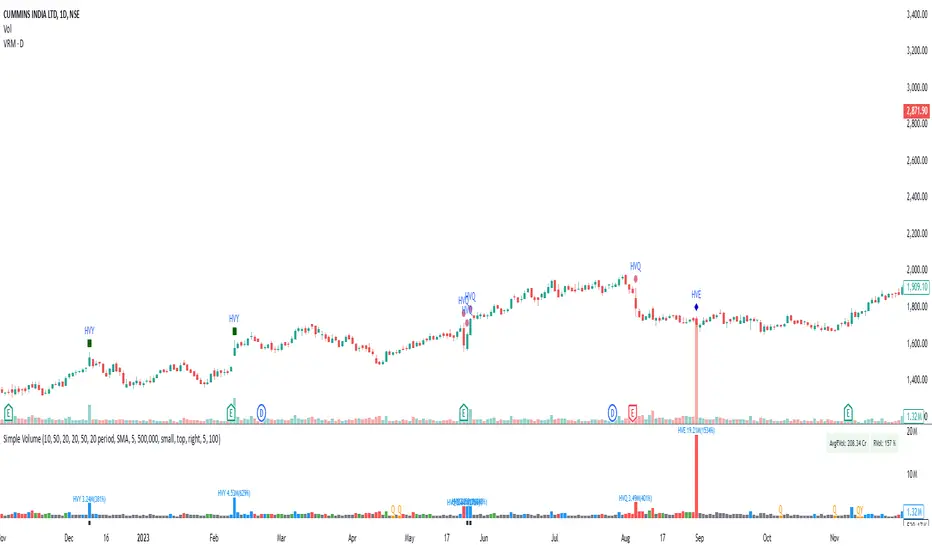
Valorous VolumesIndicator to mark the significant Volumes:
HVE: Checks if the current volume sets a new overall record.
HVY: Checks if the current volume equals the highest volume over the past one year.
HVQ: Checks if the current volume equals the highest volume over the past three months.
Chaikin Money Flow with EnhancementsFading Color Zones: Adds visual fading color fills between the CMF line and the zero line (green for bullish, red for bearish) to highlight momentum shifts.
Cross Detection: Tracks and stores price and CMF values when the CMF crosses above or below the zero line.
Average Line: Introduces a moving average of the CMF (configurable length) plotted in purple for trend analysis.
Improved Plotting: Ensures the CMF line is always fully visible and uses thicker lines for better clarity.
