SPXL shortAfter SPY quick Up, there might be downside move.
Short entry 159
Stop 163,
Target 130, 100
Risk management is much more important than a good entry point.
I am not a PRO trader.
In my trading plan, the Max Risk of each short term trade should be less than 1% of an account.
Trade ideas

SPXL – Bullish Structure Reclaim in ProgressNice setup right here — this multi-timeframe view of SPXL (S&P 500 3x Bull ETF) paints a compelling story, especially with how clean that 0.382 level at $126.23 is holding across multiple frames.
⚡SPXL – Bullish Structure Reclaim in Progress
Don’t miss what’s happening on this chart.
📍Price just reclaimed the 0.382 Fib level ($126.23) and is now flirting with resistance at $128.01, right under the 0.5 zone ($138.27) on the higher time frame.
👁 Here’s what I’m watching:
4H shows bullish continuation and stair-stepping toward the diagonal resistance.
15D and 4D show clean higher lows forming.
Macro support is locked in between $115.84–$122.02, giving us a nice demand zone.
⚠️ $138.27–$150.30 is the next key region — and if this momentum holds, we may see a full retrace back to the previous high ($189.26) long-term.
🎯 Trade plan:
Holding above $126.23 keeps this bullish.
If we retest $122–$115 and bounce, it could offer a high-R setup.
📚 Remember: zooming out brings clarity. Structure leads, candles follow.

We have 3 reasons to here
1. There is a megaphone pattern almost finished (A).
2. A broadening wedge is forming at a high level (B).
3. Another broadening wedge is nearing completion (C).
So, what I think is that Trump will announce something interesting to end the commercial conflict with everyone.
We will see a market recovery period and a new high.
Right now it looks bad, but it's not too bad.

Opening (IRA): SPXL March 21st 154 Covered Call... for a 151.04 debit.
Comments: Selling the -84 call against shares to emulate the delta metrics of a 16 delta short put, but with the built-in defense of the short call. (In all honesty, this is just an attempt to keep my theta/net liquidity ratio above .05, which is kind of the minimum of where I like to have it).
Metrics:
Buying Power Effect/Break Even: 151.04/share
Max Profit: 3.96
ROC at Max: 1.96%
50% Max: 1.98
ROC at 50% Max: .98

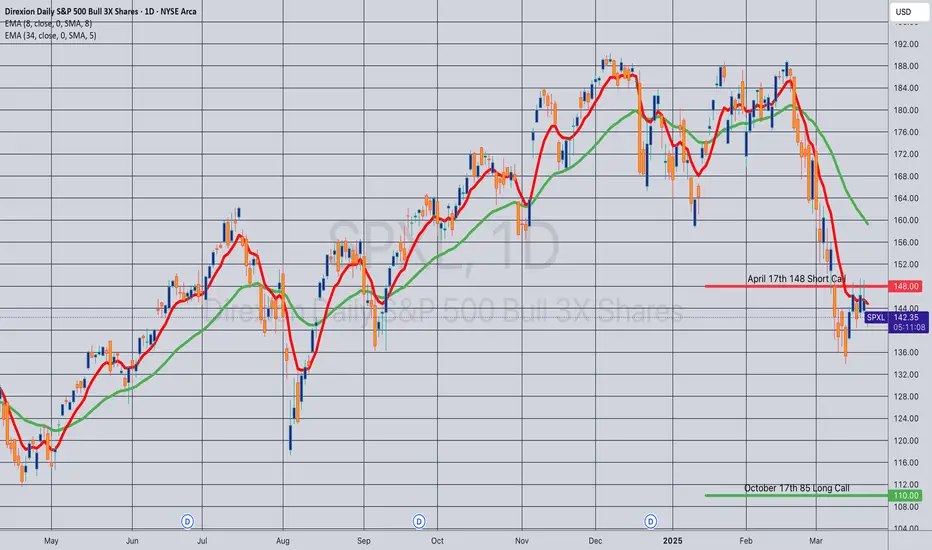
Opening (IRA): SPXL April 17th 148/October 17th 85 LCD*... for a 56.84 debit.
Comments: Looking to be a little bit more buying power efficient here ... . Buying the back month 90 delta and selling the front month that pays for all the extrinsic of the long.
Metrics:
Buying Power Effect: 56.84
Break Even: 141.84
Max Profit: 6.16
ROC at Max: 10.84%
50% Max: 3.08
ROC at 50% Max: 5.42%
Will generally look to take profit on the setup as a unit at 50% max, roll short call out at 50% max.
* -- Long Call Diagonal.
SPXL , 2025 Trades LOG Just noting all my price action entry's and exits in the comments at the end of every day and result , perhaps a logic explanation too on why I bought or sold ....
This or TQQQ is a great alternative to something like futures that is much more scalable .
My goal is to update this every day as a log .
All trades taken on 5M , price action trades , not indicators , except volume .

15% Correction Starting Why Look TNXGuys I believe tops in 608 I am know 100% short
SPXL 171 Target 70. It wont be straight down
we will have relief rally in between just watch charts

SPXL - SPX - Were not done yetOn the SPXL I can see using TA plus fibs that it looks like another leg up is coming. Usually things don't top at the 1.4 fib but continue to the 1.618 fib. Doomers are out in full force which happens at every local bottom. Yes we are getting up here but doesn't mean we can't go higher yet and looking at my TA in addition to other stocks they all look bottomed out and ready for a move higher to keep the bull trend in tack. Yes yields are moving higher but stocks have moved higher with yields before... I don't see a top till end of January at earliest but learning more towards March/April. If BTC can continue up from here that would cement that timeframe for me. Lets see what happens.

Top is in I am know Short SPXL 181.50 NVDA 148.62 long SOXS18.96The video explains TA wise we have topped
Be doing video updates daily show how transfer from that SPXL long 28% to know catch short.

SPXL bouncing at .618 & .5 retrace area BOUNCE?MODs have suggested that I provide more detail about the picks I make.
Sorry. I'm not as verbose as y'all, and I don't like things to be complicated.
My trading plan is very simple.
I buy or sell at top & bottom of parallel channels.
I confirm when price hits Fibonacci levels.
Bonus if a TTM Squeeze in in play.
I hold until target is reached or end of year, when I can book a loss.
So...
Here's why I'm picking this symbol to do the thing.
Price at bottom of channel (periods 52 39 & 26)
Stochastic Momentum Index (SMI) near oversold level
VBSM popped negative
Price at near.618 and .5 Fibonacci level
In at $159.7
Target is $173 or channel top
Stop loss is $153

Long SPXL @ 140 Target 175Look daily chart holding the 100 day ma
look stoch on bottom turning up
Vol need watch not good more selling buying
watch next few days. It going to be volatile going into election
as we head higher with sell offs do not get scared out longs on these pull backs. Look how we gave half that back like chart said it would good swing trade long know. Have trailing stop in place. Will add when we get above the 50 day ma 147.10

weekly distribution gainthe daily market may top out again, but for now as long as we are above VAH consolidation levels the reversal trend may remain intact.
the ability of this market to recover fully is still very much in question, but for now the daily levels in major equities are reading a technical squeeze.
the daily trend could still retrace to VAH, and very well may sell off POC or 4hr value gap areas according to market structure.

short SPXLsince its leveraged taking small target
patterns 1 to 5 have completed, while ABC correction is in progress according to Elliott Wave Theory. The impending downtrend is likely due to profit-taking amidst overbought conditions, coupled with weakening investor sentiment and potential market corrections, signaling a short-term bearish outlook.

The reduction target is $60According to the butterfly pattern, a decline is looming with a target of $ 60, where there will be an excellent point for further overshooting.

SPXL 2HR Return to MeanLooking like this next couple of weeks can be green again. Following that I do expect November and December to be bearish for the SPX indices. Good Luck!
SPXL SPXS. The Direxion Daily S&P 500® Bull and Bear 3X Shares seek daily investment results, before fees and expenses, of 300%, or 300% of the inverse (or opposite), of the performance of the S&P 500® Index. There is no guarantee the funds will meet their stated investment objectives.

SPXL: Bearish Deep Crab with PPO Confirmation at HOP LevelThis is the 3x Leveraged ETF for the SPY, and at the moment we have a 3 Line Strike with a PPO Confirmation Arrow at the HOP level of a Bearish Deep Crab with Bearish RSI Divergence.
If this plays out, I think the SPXL will at least make a 0.618 Retrace of the range, but it could go as deep as 100% or even more.

SPXL - Rising Trend Channel [MID -TERM]🔹POSITIVE signal from the rectangle formation by a break up through the resistance at 86.23 and next resistance 113.
🔹Between support at 75 and resistance at 95.
🔹Technically positive for the medium long term.
Chart Pattern;
🔹DT - Double Top | BEARISH | 🔴
🔹DB - Double Bottom | BULLISH | 🟢
🔹HNS - Head & Shoulder | BEARISH | 🔴
🔹REC - Rectangle | 🔵
🔹iHNS - inverse head & Shoulder | BULLISH | 🟢
Verify it first and believe later.
WavePoint ❤️

Long SPXL 80.65look at the sideways action and broke up and out boom.
look Daily stoch turning over look vol getting less.
I sold 3/4 @ 89.20 keeping 1/4 on. support 82. Waiting to
add.
I see Nice 10% correction coming
Stop on SPXL is 78.95

SPXL Weekly Break outI have been DCAing into SPXL and TQQQ the last 3 months. 5% left to allocate for these accounts and will DCA that the next 3 weeks presumably into any pull backs.
We got the MA 200 break out folks. Holding this trade for at least 1 year.

guess what? this is a bull marketYes, it's true, believe it, today the only one structure that could take us down has been broken, it was a raising wedge crossing the symmetrical triangle, so, every stock that you buy and fall could recover making new market gurus.

$SPXL putbought June 23rd $82 put for $1.60
I expect a general market correction.
I intend to close the position before expiration.


