Long trade
📌 Trade Journal Entry – ETHBTC
🔻 First Trade (Sell-side)
Date/Time: Thursday, 25th Sept 2025 – 4:00 PM
Session: LND to NY PM
Entry: 0.037180
Profit Level (TP): 0.03003 (+19.23%)
Stop Level (SL): 0.037644 (-1.24%)
RR: 15.54
Outcome:
Trade closed on Friday, 26th Sept 2025 at 9:30 AM
Final TP: 0.036
Related coins

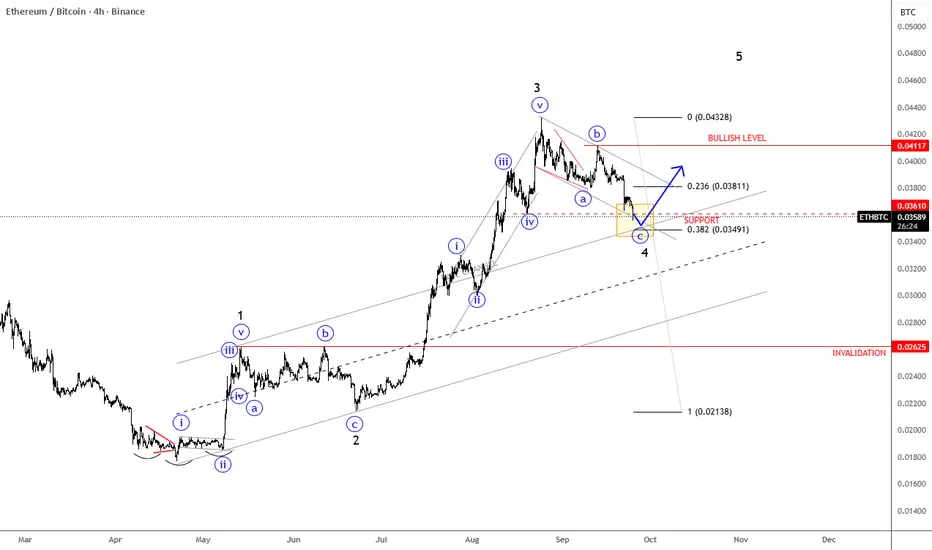
ETHBTC Has A TextBook Bullish PatternETHBTC Has A TextBook Bullish Pattern, as we see an ongoing five-wave bullish impulse by Elliott Wave model
ETHBTC pair is slowed down after a massive extension higher into wave 3, and it's right now testing important 0.035 - 0.034 support zone within an abc correction for wave 4. It's also tradi
Short trade
Pair: ETH/BTC
Direction: Sell-side trade
Date: Tuesday, 23rd September 2025
Session: LDN to Tokyo Session PM
Entry: 0.037818
Profit Level (TP): 0.030306 (-19.26%)
Stop Level (SL): 0.038284 (-1.24%)
Risk-Reward (RR): 15.57
Wyckoff Narrative
Distribution Phase: Price exhibited signs of distributio

ETHBTC LongThe BAT harmonic pattern suggests a promising upward trajectory for ETHBTC. This pattern begins at the $0.39 level, aligning with the critical 0.886 Fibonacci retracement level. From here, the price is anticipated to climb, with potential target points identified at TP1 and TP2.

ETH/BTC (1W)ETH/BTC (1W)
ETH/BTC is turning previous resistance into new support on the weekly timeframe.

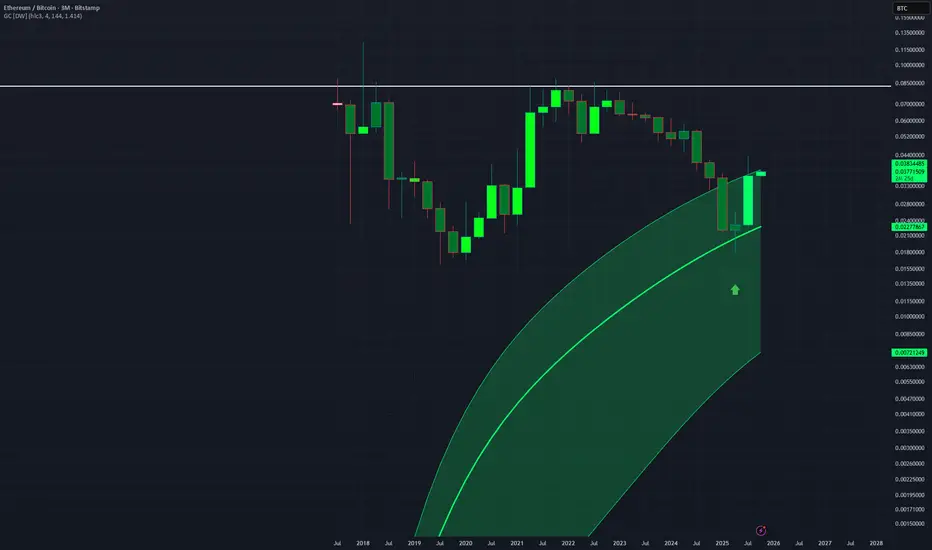
ETHBTC - Strong 3Month ReversalETHBTC has found its footing on the middle of this Gaussian Channel indicator.
From here likely it will continue to a top at the white horizontal line.
hopefully like 0.08
Very bullish on ETHUSD and altcoins
ETHBTC Technical WeeklyThe most prominent feature is a clear Inverse Head and Shoulders (H&S) pattern. This is a classic bullish reversal pattern that forms after a downtrend, signaling a potential shift towards an upward trend.
The thick red descending trendline from the top of the chart indicates the long-term downtren

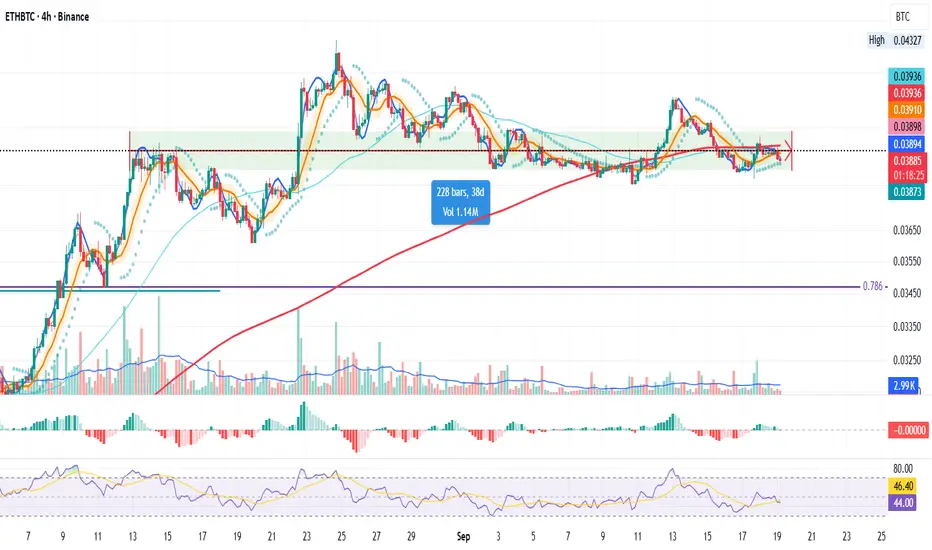
ETH SERIES | Part 2 – ETH/BTC (4H)
Same 40-day window as ETH/USDT, but here price looks worse:
Still under the 200MA
About to lose the green support zone
This confirms my no-long stance on ETH/USDT.
Short is tempting, but staying cool & pressure-free.
Next episode → ETH/SOL for more context.
Always take profits and manage ri
ETHBTC break of resistance from 2022! With todays push upwards BINANCE:ETHBTC finally broke the downward resistance since - get this - September 2022. This is huge IF it materializes. What do I mean?
In the daily and every other timeframe we can expect a continuation of some sort if the day closes above the resistance - which is in
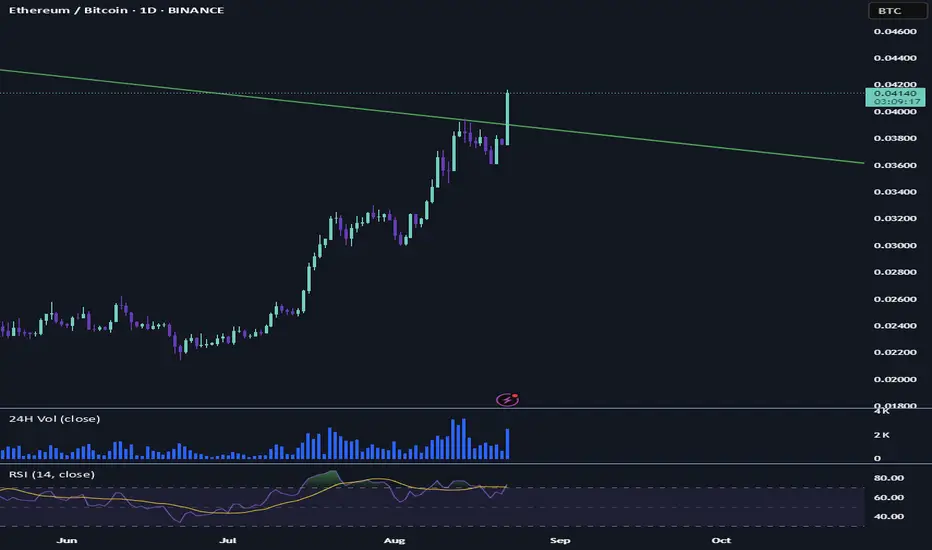
ETH/BTC pullback seems to be over ETH/BTC pullback seems to be over 🚀
The downtrend line has been broken and a new move is starting.
Key levels ahead will confirm if this momentum is sustainable.

See all ideas
Summarizing what the indicators are suggesting.
Oscillators
Neutral
SellBuy
Strong sellStrong buy
Strong sellSellNeutralBuyStrong buy
Oscillators
Neutral
SellBuy
Strong sellStrong buy
Strong sellSellNeutralBuyStrong buy
Summary
Neutral
SellBuy
Strong sellStrong buy
Strong sellSellNeutralBuyStrong buy
Summary
Neutral
SellBuy
Strong sellStrong buy
Strong sellSellNeutralBuyStrong buy
Summary
Neutral
SellBuy
Strong sellStrong buy
Strong sellSellNeutralBuyStrong buy
Moving Averages
Neutral
SellBuy
Strong sellStrong buy
Strong sellSellNeutralBuyStrong buy
Moving Averages
Neutral
SellBuy
Strong sellStrong buy
Strong sellSellNeutralBuyStrong buy
Displays a symbol's price movements over previous years to identify recurring trends.