
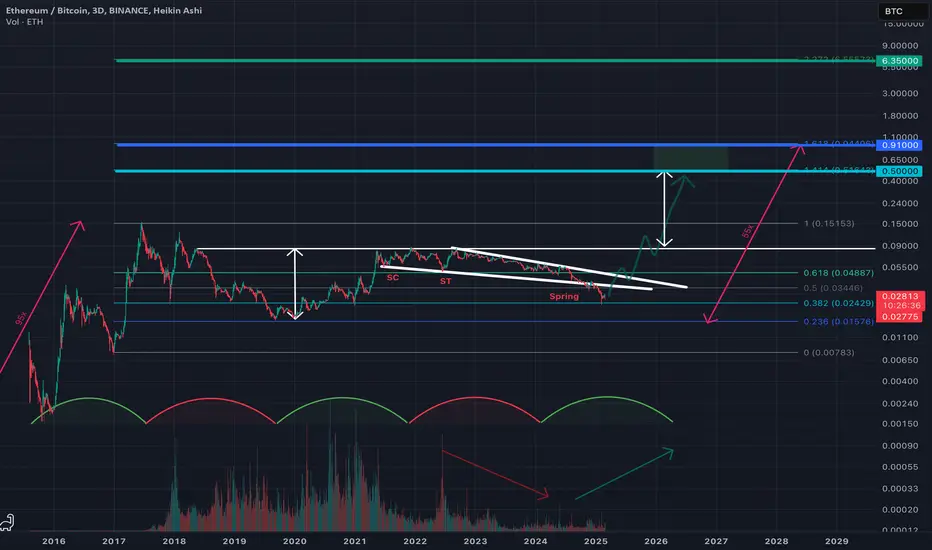
Ethereum - Wyckoff Events and PhasesThe dominance of Bitcoin is growing. When Bitcoin is growing - altcoins are growing less or without rising. Bitcoin falls - alts fall even more.
Paired with ETHBTC, we see a Wyckoff Distribution Schematic #2. We are currently in Phase D. The price is approaching a support zone. Most likely, there wi

ETH BTC set to rally>Jpow has got to come in dovish on Fed meeting this week ~POW GOES TO QE
> We could see a nice run to 0.05
>If Jpow comes Hawkish it will trigger another ~10% drop from here which will be short-lived.
> Overall Bullish for now
>Bigger players are suppressing eth
>Wait till the start of Feb to see a

Ethereum Ready To Beat Bitcoin?The Ethereum/Bitcoin daily chart is showing a notable bullish divergence, with price making lower lows while RSI is making higher lows. This is a classic reversal signal, especially as it emerges from oversold territory.
Volume also confirms growing interest, as buyers stepped in aggressively on t


altcoin season 18 MarchLet's check when it started altcoin rally in 2019 after 4 week TD9 signal and wavetrend signal in weekly chart
same pattern we see now , we triggered TD9 Last week and also triggerede wavetrend now it is time wait altcoin signal will start After end of March

ETHBTC x ETHDBINANCE:ETHBTC and CRYPTOCAP:ETH.D Test December 2017 Lows Ahead of Altseason!
Ethereum Bitcoin pair and Ethereum dominance rsi are at historic lows, which is the most plausible area for a bounce!

ETHBTC - 2 ETH may soon buy 1 BTCBINANCE:ETHBTC is one of the most hated trades on the market right now. And based on price action from recent months and years - definitely for good reason. Ethereum is being viewed as a stale rust-bucket compared to the superior monetary properties of Bitcoin and the younger exuberance found in So
normal chart We were in a good, normal correction. If the market is not manipulated, we can exit the correction.

ETH/BTCETH/BTC showing seller exhaustion on this most recent capitulation and is at the PCZ of a bullish informal M-shape harmonic structure.
This looks like an easy to manage risk area, further confirmation would be preferred but this chart generally acts like more of an oscillator than a traded asset.

See all ideas
Summarizing what the indicators are suggesting.
Oscillators
Neutral
SellBuy
Strong sellStrong buy
Strong sellSellNeutralBuyStrong buy
Oscillators
Neutral
SellBuy
Strong sellStrong buy
Strong sellSellNeutralBuyStrong buy
Summary
Neutral
SellBuy
Strong sellStrong buy
Strong sellSellNeutralBuyStrong buy
Summary
Neutral
SellBuy
Strong sellStrong buy
Strong sellSellNeutralBuyStrong buy
Summary
Neutral
SellBuy
Strong sellStrong buy
Strong sellSellNeutralBuyStrong buy
Moving Averages
Neutral
SellBuy
Strong sellStrong buy
Strong sellSellNeutralBuyStrong buy
Moving Averages
Neutral
SellBuy
Strong sellStrong buy
Strong sellSellNeutralBuyStrong buy
Displays a symbol's price movements over previous years to identify recurring trends.