$QQQ - we are closeSince the beginning of 2023, NASDAQ:QQQ has bounced every time it retests the uptrend line. Look at how the 200DMA tracks along that trendline.
The RSI is at a level where it has bounced previously. We are close to a relief rally. 👀
QQQ trade ideas

QQQ relief bounce on the cardsNASDAQ:QQQ is at a critical level which will lend itself to a relief bounce in the coming weeks.
Note: This is not a trade recommendation do your own due diligence.

NASDAQ: Correction or Crash?!If this Monthly Chart for March holds then the NASDAQ:QQQ is COOKED!
Next Level: $450
Crash level: $370-$400 🥶
- Breaking out of WCB Trend
- Volume is WAY less than 202 Market Crash (Can get worse)
- Breaking out of Bullish Channel
- Topping tail wicks
Not financial advice

Get Out Your Shovels, It's Time To Load UpHappy market selloff everyone! It's about time we got some action.
It's been interesting to see which sectors are selling off, and surprising perhaps nobody, it's mostly high-priced SaaS, consumer finance / gambling names, and meme stocks.
Of note - private equity investment managers, which have presumably seen much higher-than-average financial stress as a result of the tariffs:
- Private Equity (ARES, TPG, KKR, APO, BN, BX)
- Airlines (ALK, DAL, UAL, GEV, AAL)
- SaaS (PLTR, S, NET, TTD)
- Meme / Retail (TSLA, MSTR)
- Sportsbooks / Brokers (FLUT, IBKR, HOOD, DKNG)
- B2C Network Platforms (SPOT, RBLX, GRAB)
- Consumer Credit (SYF, DFS, AFRM, SNV, COF, ALLY)
- Socials (PINS, RDDT)
- Big Banks (GS, MS, JPM, C, TFC)
Anyway, given that the market is now notably oversold by a few common readings, including the oscillator above and CNN's Fear & Greed index, we think it's time to begin scooping up shares in the broader indices, and especially in oversold stocks you may like, including GRAB, SOFI, RDDT, and TTD.
The market is still expensive, but this selloff reeks of a 'blip', and not a longer-term fundamental change in market momentum, positioning, and sentiment. To see that, we'd expect to see a crack in support levels around QQQ $420.
Best of luck out there!

The Nasdaq-100 Since The Crash StartedHere's a line chart of the Nasdaq-100 ETF QQQ since the recent plunge started. It has been relentless selling. While I could tell you all about the 10% correction and all that other jazz, I just want to share this line chart that is essentially going straight down.
I think there are essentially three ways to play this:
1. Do you wait for one capitulation event and then dive in? If so, when does that begin? Start your research process.
2. Does one place a pair trade of sorts for both crazy downside insurance BUT also a quick upside pop. There has not been a rally at all off this crash and as they often observe, the biggest bounces happen after the worst drops.
3. Keep playing the downward trend until otherwise noted. My only concern here is that I keep asking myself: have I missed the down move?
I am watching closely and am wondering when or if a rebound arrives and how to play it. If you have any trade ideas in mind based on this plunge, please comment them below!

Nasdaq100 - Where could we go?NASDAQ:QQQ
If we lose this Bullish Channel then here are the levels...
Level 1: $445-$450
Level 2: $385-$400
Not financial advice

QQQ: Trend's 3 Frames of ReferenceTrend's Three Frames of Reference:
The Fibonacci channels in the chart are constructed based on the COVID low (March 2020) and the 2023 low, with a projection that aligns with the late 2021 top as a key reference point. This approach sets the direction of the Fibonacci channels in an upward-sloping trajectory, capturing the broader bullish trend while identifying key areas of support and resistance.
The trend structure follows a long-term ascending Fibonacci framework, where the lower blue regions (0.786, 0.618 levels) represent historical support zones, aligning with past market corrections.
The mid-range levels (0.5, 0.382) act as consolidation zones where price action frequently stabilizes before continuing its trend.
The uppermost red-orange zones (0.236 and above) highlight overextension zones, aligning with the late 2021 high, where the market previously faced strong resistance before entering a corrective phase in 2022.
By using the COVID low and the 2023 low as anchors, the Fibonacci channels effectively map the market’s trajectory and provide insight into potential future movements. The alignment with the late 2021 top further reinforces these levels as critical points for potential price reactions, making this an effective tool.
In this alternative Fibonacci channel configuration, the direction is adjusted to align with a steeper bullish trajectory, possibly emphasizing a different perspective on trend structure and momentum. The key anchors for the Fibonacci channels remain rooted in the 2023 low and recent higher highs, creating a more aggressively inclined channel structure.
This Fibonacci channel configuration differs from the previous ones by focusing on a shorter-term structure with a narrower range and downward-sloping alignment. It is anchored from the recent 2023 low to the subsequent high, with Fibonacci retracement levels applied to identify key support and resistance zones. Leaving this trend configuration is a signal that price goes for bigger range movement.
By utilizing three Fibonacci channel references, this method enhances price forecasting accuracy, confirms key support/resistance areas, and adapts to different trading styles. The combination of macro, momentum, and retracement-based analysis ensures that both investors and traders can make informed decisions based on multi-frame confluence zones.
Long-term investors should watch Configuration 1 for sustainable support levels. Momentum traders can rely on Configuration 2 for buying dips near 0.5 and selling near 0.236. Short-term traders should focus on Configuration 3 for managing pullbacks and breakout confirmations.

QQQ: Capacity of the PullbackThis chart presents a Fibonacci channel projection based on key swing points, including a Higher High, Higher Low, an All-Time High (ATH), and a current Lower Low.
The levels of Fibonacci channel that market should abide by for the nearest future, are defined by: HL & LL - sets direction (fib 0 line); applied to ATH (fib 1 line). The derived fib ratios help to anticipate future price movements acting as key resistance where the pullback (reaction to prior impulsive bearish wave) might reach in respect to its structural capacity. B&W dashed line indicates a potential inflection point where the price could either reverse or extend further into supply zones.

QQQ / NDX: Also a potential dead cat bounce like SPX?I examine the Qs and provide some key levels to watch.

Stock Market Forecast | TSLA NVDA AAPL AMZN META MSFTStock Market Forecast | NASDAQ:QQQ AMEX:SPY
Mag 7 Forecast | NASDAQ:TSLA NASDAQ:NVDA AAPL AMZN META MSFT GOOGL

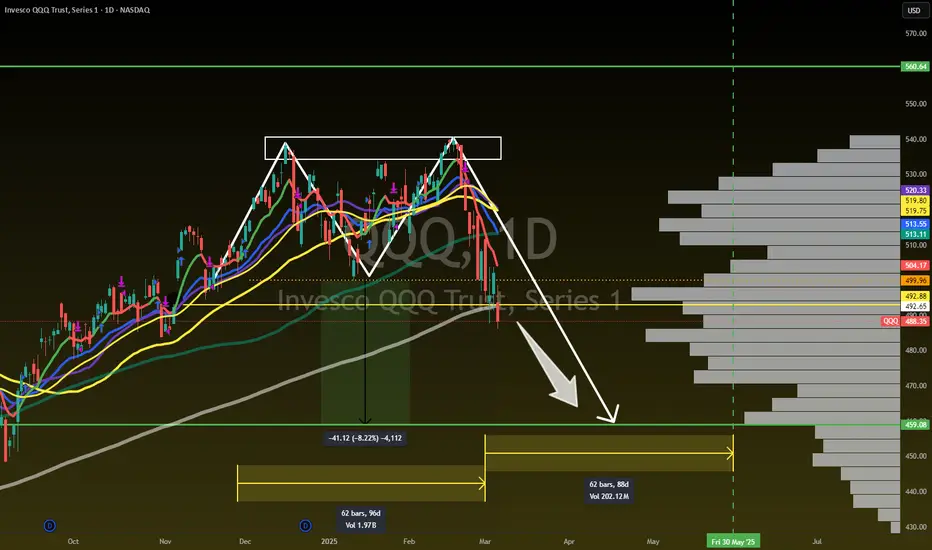
The Double Top is in on QQQNASDAQ:QQQ - DOUBLE TOP 🗻🗻
No Denying it NOW!
Measured Move is $459 by 30May
Not financial advice
Qqq
So ..
Keep things simple.. Qqq has support at 468-470.. below that support at 450 comes...
Qqq 1st resistance is at 477, over 477 and 483 comes. ..
The technicals say we should bounce up to 483-485 if Jolts come in decent today..
The bad news is Until post Opex we are in a Bearish seasonality..
The structure on one of the biggest sectors XLC (Meta,NFLX) tells me that the selling isn't done and we could see
450 by end of April..
Overall Qqq Top was in like posted back in Dec..
Here's Qqq weekly chart log scale..
Notice it only broke this once in 16yrs and that was because of the stimulus liquidity..
Now zoom in here and notice the 2 red
arrows
the first Arrow was back in July when QQQ tagged that weekly resistance, price corrected but they bought it up for the sake of distribution.. the evidence of that distribution is on your RSI weekly chart. Look at your RSI and notice How it's has diverged as price went higher also notice How NVDA and MSFT pretty much traded sideways since last July. Lastly JPM pretty much said that they liquidated most of their tech longs last summer.
Notice the blue line ? That was our uptrend from 2022 lows, that uptrend combined with the weekly channel has made a rising wedge. We broke that rising wedge last week but I think in April we will rally back up to retest it around 510-515 before a sell in May event that takes us to the bottom of this channel Around 400..
The bigger picture is this, the channel of 16yrs support has never been broken so if you do get that 400 price this summer it will likely be a buying event like what happened at 2022 lows.
I don't think Qqq makes a new high until 400 is tested .
But to focus on today's trade, wait until Jolts numbers are released, if we push over 477 then they will melt this back up to 483.. if we flush then don't short this until you see 467 cause it could be a trap.. below 468 and you short this to 462 then 450.. The WEEKLY 50 SMA is at 485 so it will take CPI to get over that
Had to post this for my friends since X is down 😂 .. I'll update here

QQQ - Double Top BreakdownQQQ has formed a double top, a classic bearish reversal pattern indicating potential trend exhaustion. The price has broken below the neckline, confirming the pattern and signaling further downside. If selling pressure continues, we could see a move toward the target zone.
This breakdown suggests that bulls are losing momentum, and unless QQQ can reclaim the neckline, the bearish bias remains intact. However, false breakdowns can occur, so it's important to watch for a potential retest of the neckline before further downside.
📊 Key Levels:
🔵 Entry: Breakdown confirmation below support
🔴 Stop Loss: 524.65 🔻 (Invalidation level if price reclaims this zone)
🟢 Target: 458.59 ✅ (Measured move from the pattern)
🔎 Watch for:
📌 A retest of the neckline as resistance
📌 Increased volume confirming the breakdown
📌 Possible continuation if sellers remain in control
This setup presents a strong risk-to-reward opportunity for bears, but staying cautious of any reversals is key.

A Pseudoscience called Technical analysis!Pseudoscience is characterized as a system of theories or beliefs that are presented as scientific but lack the rigors and foundations of the scientific method. It often uses scientific-sounding language while being rooted in unsubstantiated claims or cultural beliefs, and it can be misleading and harmful.
My Evolution as a Market Analyst
Early Success on TradingView
In 2020-2021, I established myself as a leading analyst on the TradingView platform, becoming the top-rated contributor for equities and high-volume tickers including TSLA, AAPL, AMZN, ARKK, COIN, RIOT, WKHS, PLTR, NIO, and Bitcoin.
Educational Background
My journey began fifteen years ago with a comprehensive study of technical analysis methodologies. I immersed myself in seminal works including:
"Technical Analysis of Financial Markets" by John J. Murphy
"Japanese Candlestick Charting Techniques" by Steve Nison
"Trading with the Andrews Pitchfork" by Glenn Wilson
"Elliott Wave - Fibonacci High Probability Trading" by Jared Sanders
Professional Recognition
While my initial goal in publishing analyses on TradingView was personal performance tracking, industry recognition came unexpectedly. Within three months, I ranked among the platform's top six contributors, advancing to the highest-rated position by the fourth month.
This visibility led to multiple partnership offers from brokerages and cryptocurrency projects, including Tiger Broker (NASDAQ: TIGR), all of which I declined to maintain independence.
Client Development
Following requests from followers, I established a contribution system to support ongoing analysis. My work attracted institutional attention, including a hedge fund managing hundreds of millions in assets that engaged me for educational services.
I developed a customized curriculum delivered via virtual platforms, maintaining a rigorous teaching schedule that ultimately revealed limitations in traditional technical analysis approaches—confirming Richard Feynman's observation that "When one teaches, two learn."
Methodological Evolution
This realization prompted a strategic pivot. I paused teaching to focus on skill development, particularly in programming and data analytics. I integrated advanced concepts including:
Game theory applications
Quantitative analysis frameworks
Behavioral finance principles
AI Integration
The emergence of accessible AI models represented a significant advancement for my practice. I leveraged Gemini (formerly Bard), ChatGPT, and Claude to enhance my options trading system, developing proprietary metrics to identify market inefficiencies in derivatives pricing.
Current Approach
Today, I operate as a substantially transformed analyst with a modernized market perspective. While my analytical methods employ sophisticated quantitative techniques, I continue presenting findings in traditional visual formats to accommodate audience preferences—a phenomenon explained by patternicity.
Understanding Cognitive Biases in Trading
Patternicity
A concept introduced by Michael Shermer describes our tendency to identify meaningful patterns within random noise
Highlights humanity's inherent drive to impose order on chaotic information
Significantly impacts decision-making processes as our minds actively seek connections, sometimes where none exist
Apophenia
The broader tendency to perceive connections between unrelated phenomena
First defined by German neurologist Klaus Conrad in 1958 as "unmotivated seeing of connections"
While common in everyday cognition, extreme manifestations can indicate psychological concerns
Trading in the AI Era
For market participants continuing to rely exclusively on traditional technical analysis methodologies—pattern trading, Elliott Wave theory, harmonic patterns, or price action systems—I offer this perspective: these approaches alone are increasingly insufficient for achieving consistent market outperformance in today's technology-driven environment.

QQQ Trading Opportunity! BUY!
My dear friends,
QQQ looks like it will make a good move, and here are the details:
The market is trading on 491.81 pivot level.
Bias - Bullish
Technical Indicators: Supper Trend generates a clear long signal while Pivot Point HL is currently determining the overall Bullish trend of the market.
Goal - 509.46
About Used Indicators:
Pivot points are a great way to identify areas of support and resistance, but they work best when combined with other kinds of technical analysis
———————————
WISH YOU ALL LUCK

Nasdaq short-term long: Bounce off Trendline, RSI DivergenceIn summary, I think that there is a good odds that Nasdaq will rebound in the short-term because it has bounced off a 2-year trendline and RSI has diverged with price. Using QQQ to gauge volume, I can also see that there is a healthy volume to support a reversal. However, take note that as of now, I will still consider this to be a corrective wave up and not a major trend reversal to the upside. Meaning, the major trend is still down.

QQQ - Do what you will. Looks like we hit the first Fib level, but at least another to go but we certainly could see a dead cat bounce here. GLTA.

Rising Channel - QQQ's Here is a good reason why we saw a bounce on the charts today after a really bearish week on the QQQ's.

$QQQ - Trading Levels for March 12 2025
30min 35EMA IS the level to watch. Looks like QQQ is trying to find support there.
I did just sell 482/487 bear call spreads - that is a 5 dollar wide spread.
Bear gap at the top of the trading range. If you’re thinking of that spread let me suggest 1.75 as the first entry - then 2.25 if we keep moving up.

QQQ long term trend is down with short-term relief rallyI am guessing a bit more downside before we see a relief rally. The AI bubble is starting to unwind, and that falling knife is sharp. I am patiently waiting for some version of a short-term bottom. You can see in the chart that price is has several key support lines within near reach. I would expect testing and hopefully finding some support in the coming days. If it is like the COVID bubble unwind, then we could see a strong reverse rally out of this range. However, I think it is pretty clear QQQ is in correction with a convincing loss of the 200 day SMA.

QQQ .618 I have now moved to a FULL LONG CALLS The low has dropped into the crash cycle due the week of 3/10 to 3/13 .We now have a large ABC decline down to .618 At the low .I will now look for a min of three weeks of Upside MIN . Time to be LONG is NOW . best of trades WAVETIMER

NASDAQ: Buy the Dip; Hold the Grip
Tech:
Dip to horizontal support + 50% fib + TL
Normal drop and expect a rally or sideways market

$QQQ Analysis, Key Levels & Targets for March 6th 2025
WEEKLY 35EMA. Put that level on the weekly chart and you’ll know exactly where the battle ground is today. You can see it running through the last few trading sessions.
I have 487 as support - and if this breaks the next support is at 448.
