G&S ratio - where are we ?The Gold and Silver ratio is a key parameter in order to determine whether we are in a precious metals bull market and especially in a raging bull where Silver over performs Gold.
The recent Silver surge and slight overperformance of Silver relative to Gold could indicate that we are about to enter
About GOLD/SILVER RATIO
The Gold-Silver Ratio represents how many ounces of silver it takes to buy a single ounce of gold. Today the ratio floats, since gold and silver prices are adjusted daily by market forces, but this wasn't always the case. The ratio has been permanently set at different times in history - and at different places - by governments seeking monetary stability.
Trading the Gold-Silver Ratio makes sense for those worried about devaluation, deflation and currency replacement. Precious metals have a proven record of maintaining their value in the face of any contingency that might threaten the worth of a nation's fiat currency.
Trading the Gold-Silver Ratio makes sense for those worried about devaluation, deflation and currency replacement. Precious metals have a proven record of maintaining their value in the face of any contingency that might threaten the worth of a nation's fiat currency.

GSR Update October 9th 2025I created this chart 4 months ago to track two FIB Timing 3 zones as inflection points to predict a meaningful move in silver.
We are now at the 2011 resistance level point at the same time as the long term FIB timing zone where the line intersect.
If this resistance level breaks the GSR should dr

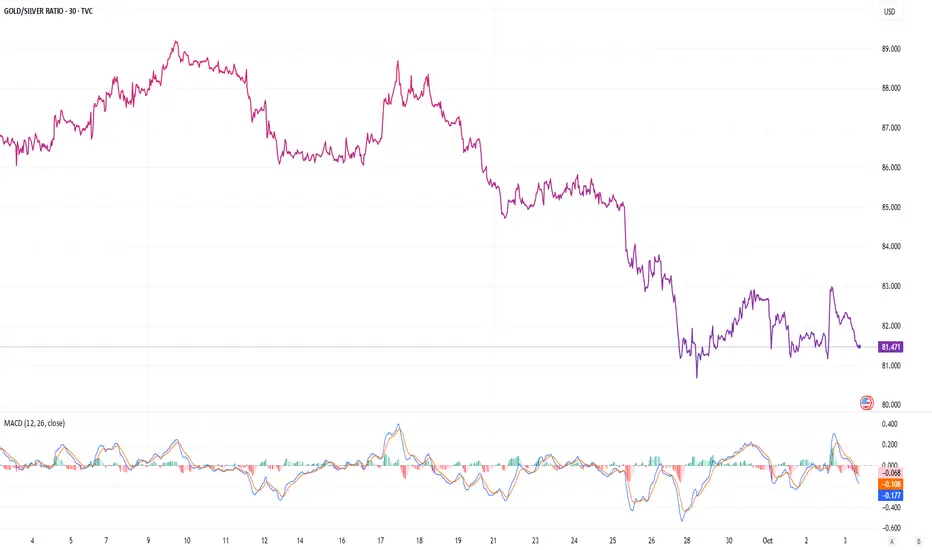
Capture Relative Moves: Gold vs. Silver
The gold-to-silver ratio is trading around 81. Although that’s already a decline, it previously fell to around 64 in 2021 and 2016, and even to 31 in 2011. Each time the ratio drops, it typically marks a peak in silver prices during an uptrend.
Therefore, now is just the beginning of a new dow
Gold and silver break records: what is behind the price increaseTVC:GOLD TVC:SILVER
Gold recently broke historical records, exceeding $3,850 per ounce, and silver later followed suit, reaching a maximum of $47 per troy ounce.
At first glance, it may seem that this is a signal for investors to urgently increase the share of precious metals in their portfolios
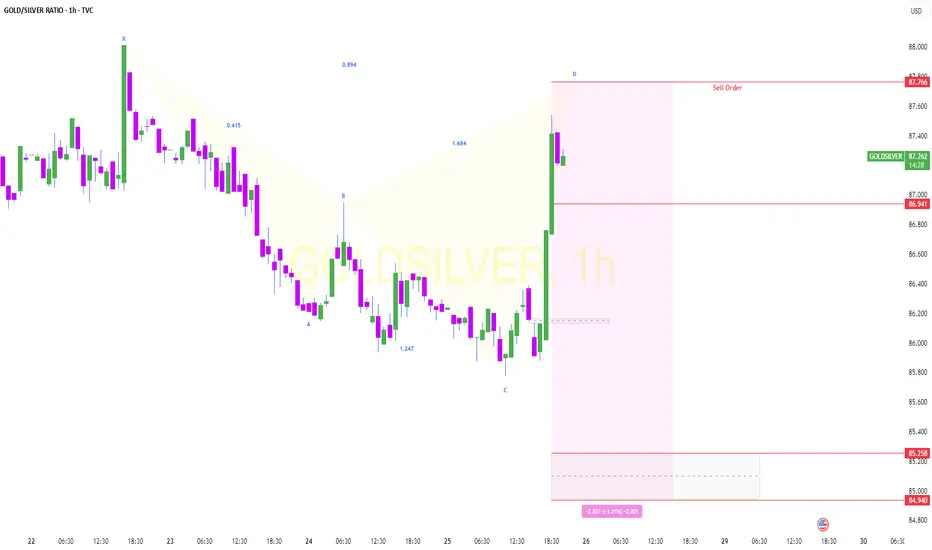
GOLDSIL LongThe likelihood of the GoldSilver bat breaking out of the wedge formed by the drawn trendlines suggests a potential increase in the index in the future.

GOLDSILVER Short .GOLDSILVER Index may fall from 87.77 towards target (order block zone), based on shark pattern.
Gold/Silver Ratio to 72 Minimum - Imminent Silver BreakoutGoldSilver Ratio is following a clear pattern of behavior. We can expect a return to mean conservatively hitting 72 at a minimum. This puts silver at $46-58 if Gold doesn't move higher. I think we will see silver 5-10X over the next few years. Easy 25-50% in the short term (6-12 months).
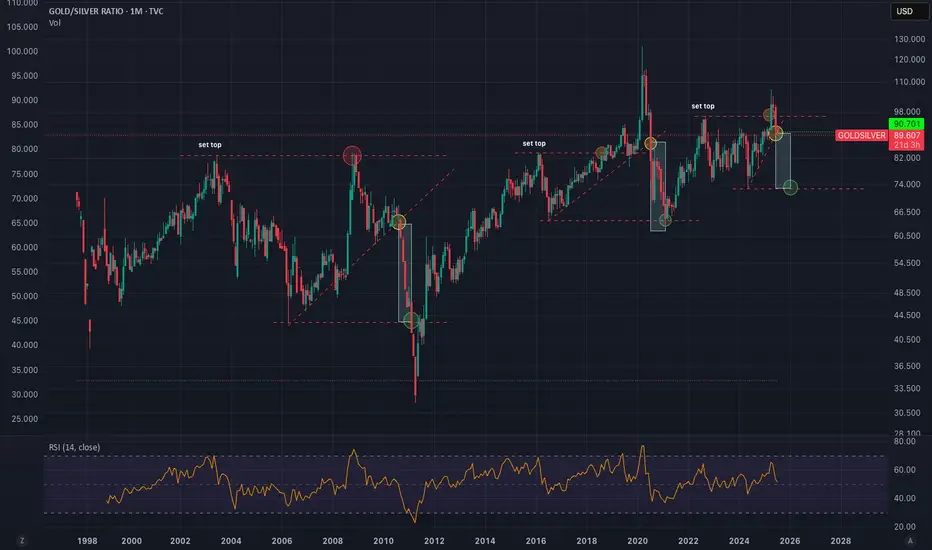
GSR Update July 8th 2025I am expecting the GSR to return to the medium doted line in the near future with the divergence of the short term FIB time zone 3 coinciding with the long term FIB time zone 3. This will bring the silver chart at the bottom up closer to the medium dotted line. Fingers Crossed!

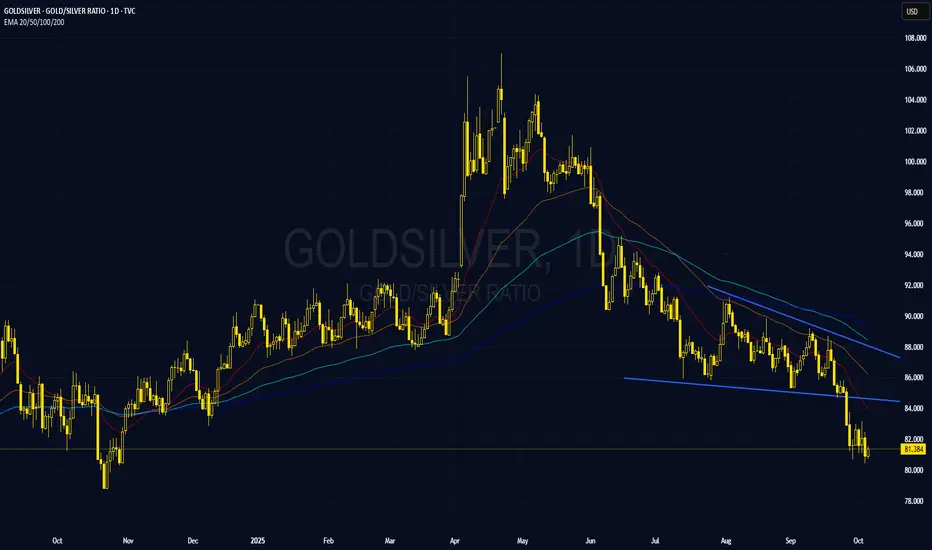
GOLD/SIlver Ratio Signals Risk On Gold/Silver ratio represents the appetite for risk
Stronger gold means risk off and vice versa
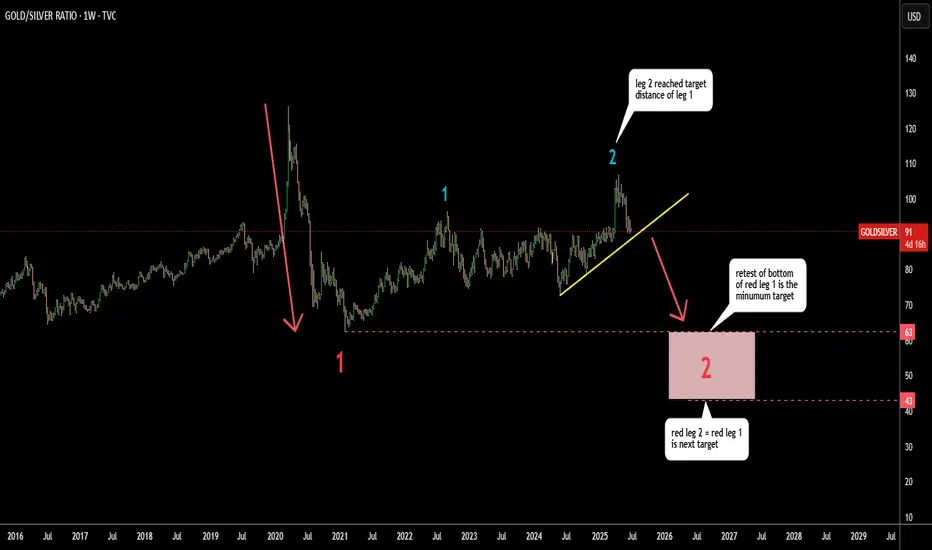
In spring, the ratio had hit the target for leg 2 (blue) within
large consolidation that took over 4 years to emerge
It travelled the equal distance of leg 1 (blue) and then reversed.
The next step migh
3-Year Range Broken — Gold/Silver Ratio Retesting Critical ZoneContext:
For more than three years, the Gold/Silver ratio traded within a predictable range between approximately 79 and 92. This provided consistent opportunities to rotate between metals: buying Gold when the ratio approached the bottom of the range, and favoring Silver when Gold became relativel

See all ideas
Summarizing what the indicators are suggesting.
Oscillators
Neutral
SellBuy
Strong sellStrong buy
Strong sellSellNeutralBuyStrong buy
Oscillators
Neutral
SellBuy
Strong sellStrong buy
Strong sellSellNeutralBuyStrong buy
Summary
Neutral
SellBuy
Strong sellStrong buy
Strong sellSellNeutralBuyStrong buy
Summary
Neutral
SellBuy
Strong sellStrong buy
Strong sellSellNeutralBuyStrong buy
Summary
Neutral
SellBuy
Strong sellStrong buy
Strong sellSellNeutralBuyStrong buy
Moving Averages
Neutral
SellBuy
Strong sellStrong buy
Strong sellSellNeutralBuyStrong buy
Moving Averages
Neutral
SellBuy
Strong sellStrong buy
Strong sellSellNeutralBuyStrong buy
Displays a symbol's price movements over previous years to identify recurring trends.