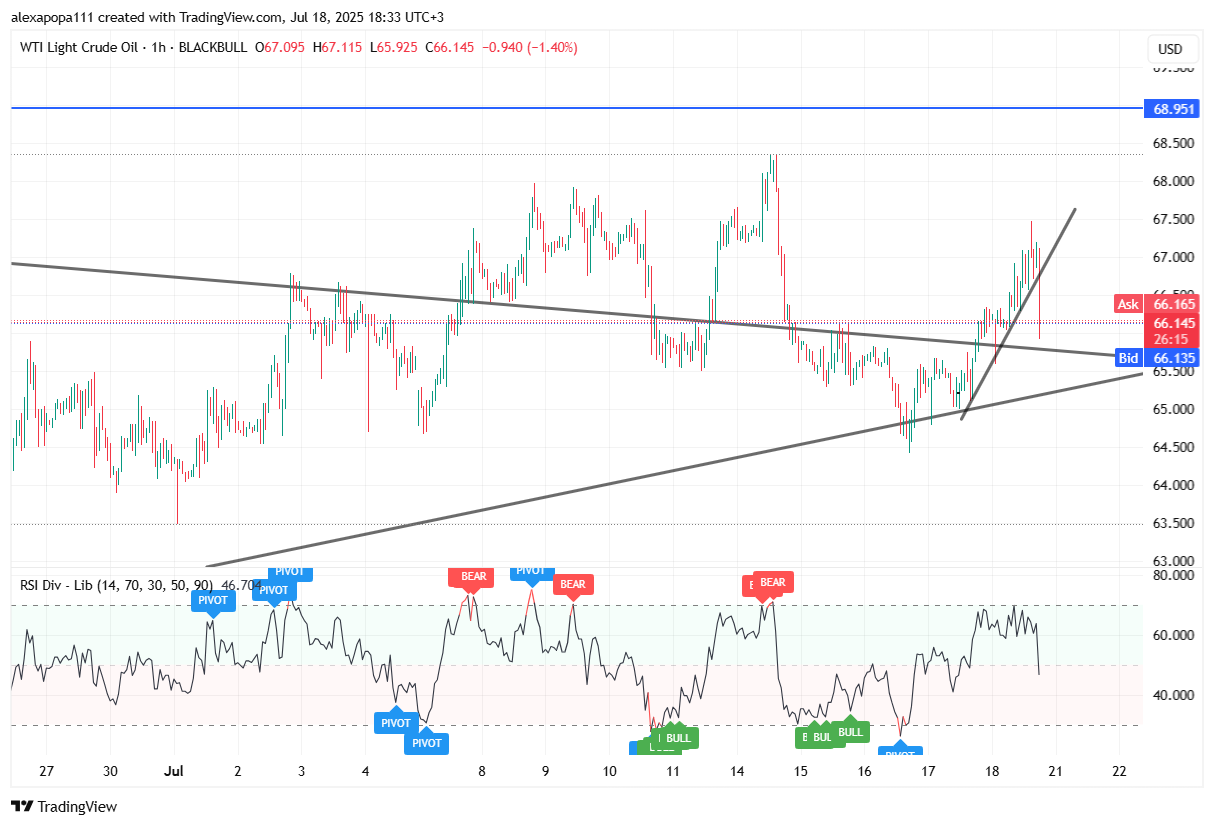
Just a thought looking at the charts I think we might have a bullish gap down on Monday. Meaning we might see a gap down but buy orders could cover shorts leading to another bullish run. This is not a financial advice. I can see this happening as there is a bearish CRT on the 2D Timeframe and 12H timeframe and a bullish BOS fair value gap around 65.80 on the 12 hour timeframe frame.
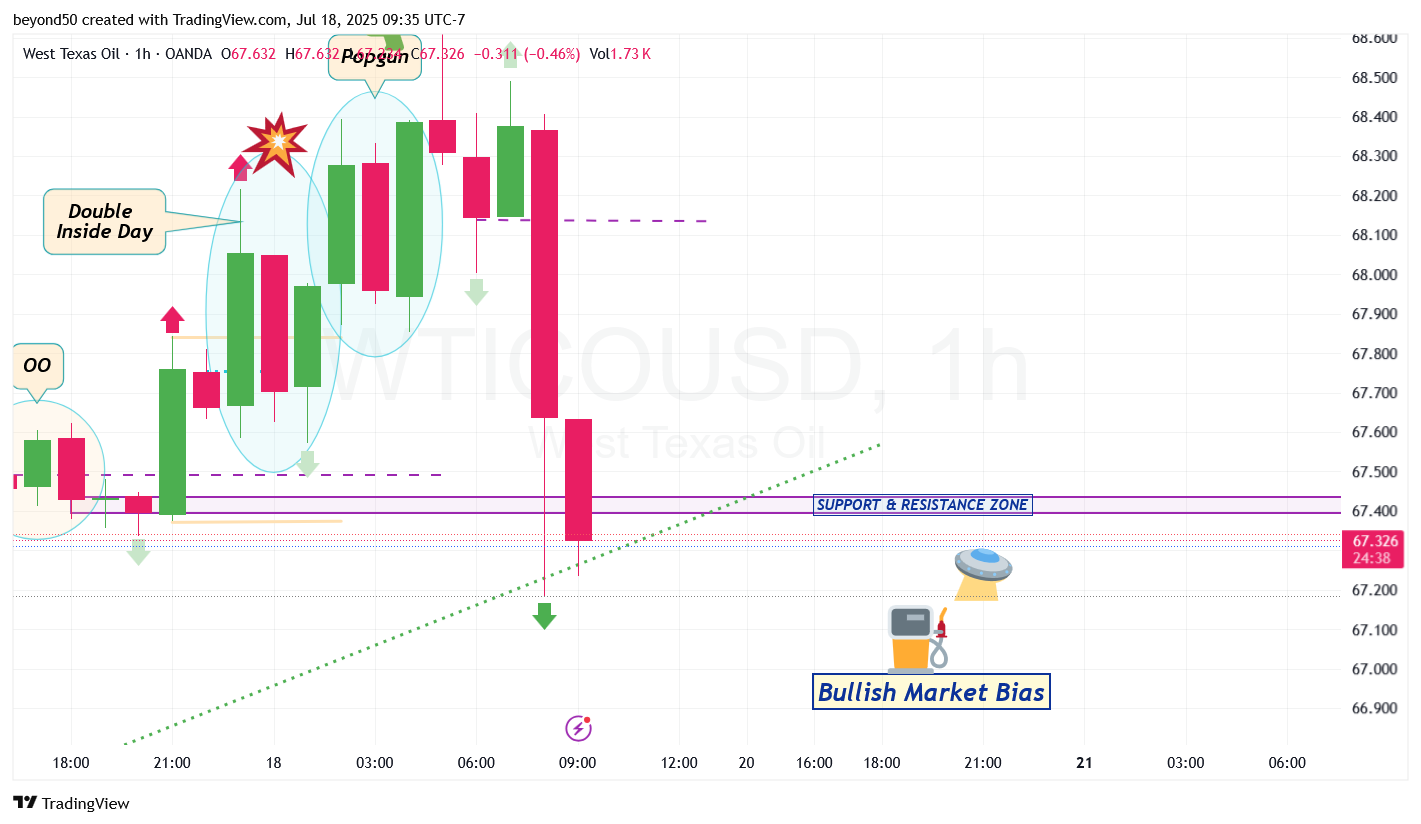
We tested the opening of previous 12H bearish candle (67.60) and rejected so it might drop further on Sunday evening ahead of Monday session towards the Bullish order block also around 65.40-65.80 before it loads up for another run
If you want to adjust pricing to
Have a great weekend and Happy Friday!! 🙏🏽