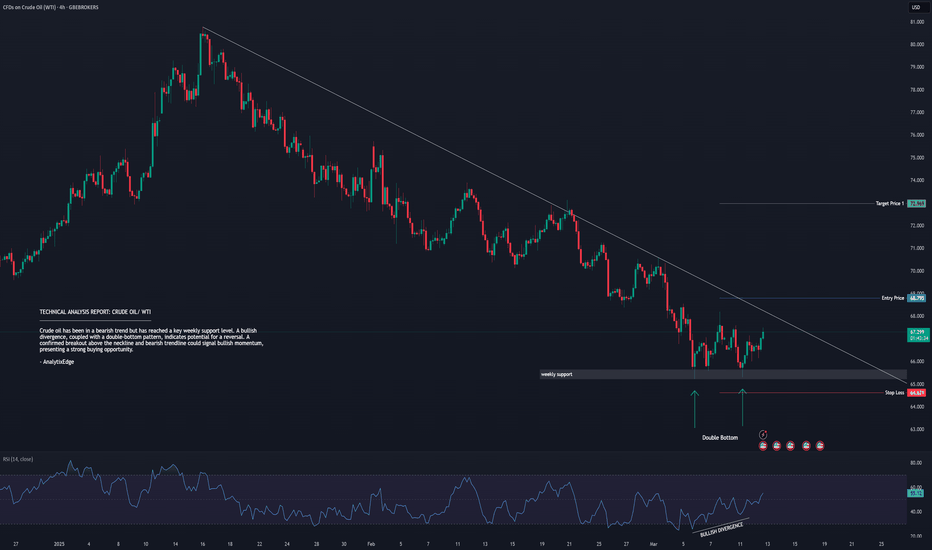
Crude oil has been in a bearish trend but has reached a key weekly support level. A bullish divergence, coupled with a double-bottom pattern, indicates potential for a reversal. A confirmed breakout above the neckline and bearish trendline could signal bullish momentum, presenting a strong buying opportunity.
Wheat prices are in a bullish trend, consistently forming higher highs with no signs of divergence. A potential retracement after the latest high may present a strong buying opportunity. As the uptrend is expected to continue, it is advisable to safeguard the previous higher low.
Copper (XCU) remains bullish, with a retracement offering a buy opportunity at the 0.5 or 0.618 Fibonacci levels—if no divergence forms. Watch for bullish confirmation signals and set stop-losses below 0.618 or recent lows. If divergence appears, exit or avoid new positions. Upside targets: previous highs and Fibonacci extensions (1.272 or 1.618).
The GBPAUD pair is in a **strong bearish trend**, with price retracing to a **key Fibonacci resistance level**. The absence of bullish divergence reinforces the bearish bias. A confirmed **lower high formation** would signal continuation of the downtrend, offering a high-probability **short opportunity**. Monitor price action for confirmation of trend persistence.
The GBPNZD pair, previously entrenched in a bearish trend, has exhibited signs of weakening downward momentum, marked by the emergence of bullish divergence. A decisive break above the prior lower high (LH) could signal a potential trend reversal, shifting the bias toward bullish territory. This view is further reinforced by the formation of a double-bottom...
EURUSD is maintaining its bullish momentum within an ascending channel. A potential buying opportunity may arise if the price retraces to the 0.618 Fibonacci level, provided no divergence is observed. The setup appears favorable for a long position.
AUDCAD is trending bullish on the 1-hour timeframe, moving steadily within an ascending channel. No significant bearish divergence is observed, indicating potential for further upward momentum. A buy opportunity may emerge at the 0.618 Fibonacci retracement level.
NZDCAD shows potential for bullish continuation after a bearish rally, with a bullish divergence double bottom pattern and a break of its neckline. The price has broken a long-term trendline and formed a higher high without divergence, now moving in an ascending channel. A buy opportunity may arise at the lower boundary of the channel, around the 0.618 Fibonacci...
NZDCHF is trading within an ascending channel, indicating a bullish structure with no signs of bearish divergence. The current price is retracing to establish a higher low, which aligns with the trend's continuation toward a new higher high. This presents a favorable buying opportunity, with risk management focused on protecting the prior higher low.
The NASDAQ, after enduring bearish pressure, is beginning to exhibit signs of bullish momentum at a significant daily support level. A combination of technical signals, including a bullish divergence, the completion of an ABCD pattern, and the formation of a bullish inverted head-and-shoulders pattern, points toward a potential reversal. A confirmed breakout above...
The Hang Seng Index has demonstrated strong bullish momentum, adhering closely to its trendline throughout its rally. Following this upward trajectory, the price has undergone a significant retracement, finding support near the critical 0.618 Fibonacci level—a key zone for potential reversals in technical analysis. This pullback has established a higher low at...
The GBP/USD pair is exhibiting strong bearish momentum, having recently broken significantly below its descending channel, indicating heightened selling pressure. As of now, no bullish divergence is observed, suggesting that the price may retrace to form a lower high. Key levels to watch for potential short entries are the 50% and 61.8% Fibonacci retracement...
GBPCAD has been in a sustained bearish trend and recently completed its AB=CD harmonic pattern, signaling a potential turning point. Additionally, the formation of bullish divergence further supports the possibility of a reversal. A break above the previous lower high at 1.77741 could indicate the emergence of a bullish trend, suggesting a shift in market sentiment.
USDCHF exhibits strong bullish momentum, having decisively broken its previous resistance level. With no signs of bearish divergence, the trend is likely to continue. A potential retracement to retest the recently broken resistance, now serving as support, could present a favorable opportunity to enter long positions.
The NASDAQ (US100) continues to display strong bullish momentum, having recently broken above its previous higher high. The price has since retraced to test this level as support, aligning with the structure of a proposed ascending channel. With no bearish signals currently evident, the index shows potential to establish a new high. *Trade responsibly and...
GBPAUD has completed its downward retracement amid strong bullish momentum. A well-defined Gartley pattern with bullish divergence at point D on the 1H timeframe, combined with daily support and the pivot point, signals a favorable buy opportunity.
The DAX40 has tested its daily support level and subsequently formed an accumulation range. Following a breakout to the upside, the price is now retesting its newly established support, presenting a promising buying opportunity.
USDJPY has been in a clear uptrend recently. However, a noticeable bearish divergence, coupled with a trendline break, suggests a potential shift toward bearish sentiment. A break of the current support level could present an excellent selling opportunity for a quick target profit.


