BigShouldersTrading
This is a bit different than my usual, it is purely a harmonic setup on a confluence of 2 h1 patterns. Pattern 1 (orange): XAD 161.8 = 111.61 BCD 361.8 = 111.61 CD @ 2.24 AB = 111.59 Pattern 2 (red): XAD 161.8 = 111.65 BCD 314 = 111.72 CD @...
Orange lines - daily wave, classic ABC continuation Green/Red lines - h1 exhaustion trading levels for the daily C point Magenta lines - m15 exhaustion trading levels for low time-frame reactions 1.1765 is the last h1 model driven reversal point for the current daily wave down. It is also closely related to a 0.236 retracement of the previous daily wave up. A...
Orange lines - daily wave, classic ABC continuation Green/Red lines - h1 exhaustion trading levels for the daily C point Magenta lines - m15 exhaustion trading levels for low time-frame reactions Our h1 expected turning point is 0.7470. We've kept on the chart the arrow for our continuation play that failed - just a reminder there's no 100% in trading. If you...
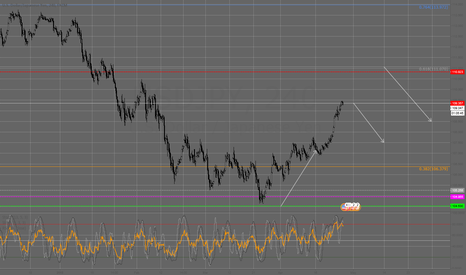
Orange lines - daily wave, classic ABC continuation Green/Red lines - h1 exhaustion trading levels for the daily C point Magenta lines - m15 exhaustion trading levels for low time-frame reactions We are watching two levels: the current reaction at 109.38 and a potential higher reversal at 110.81 in the larger 111 price area. Traders should use trading systems...
Orange lines - daily wave, classic ABC continuation Green/Red lines - h1 exhaustion trading levels for the daily C point Magenta lines - m15 exhaustion trading levels for low time-frame reactions Our h1 expected turning point is 1.1990. H1 and H4 extreme candle confirmations appear to form right now and a valid signal should follow. Similar timing to the other...
Orange lines - daily wave, classic ABC continuation Green/Red lines - h1 exhaustion trading levels for the daily C point Magenta lines - m15 exhaustion trading levels for low time-frame reactions Our h1 expected turning point is at the current price - 1.3655. However our trade logic is not met and we do not have a valid h1 trading signal yet. Similar to...
Orange lines - daily wave, classic ABC continuation Green/Red lines - h1 exhaustion trading levels for the daily C point Magenta lines - m15 exhaustion trading levels for low time-frame reactions We were initially looking at 0.7850 as a general retracement target for this up move; but same as before the last wave down has not yet been confirmed by the current...
Orange lines - daily wave, classic ABC continuation Green/Red lines - h1 exhaustion trading levels for the daily C point Magenta lines - m15 exhaustion trading levels for low time-frame reactions After the 1.4222 level failed to materialize into the larger reversal we were expecting, we came really close to an h1 trading signal on the 1.4278 test but one...
Orange lines - daily wave, classic ABC continuation Green lines - h1 exhaustion trading levels for the daily C point Magenta lines - m15 exhaustion trading levels for low time-frame reactions This was yesterday's setup, waiting for retests of red lines for new trades from this current point (1.4100). For larger context there is a similar C 0.236 point on the...
Orange lines - daily wave, classic ABC continuation Green lines - h1 exhaustion trading levels for the daily C point Magenta lines - m15 exhaustion trading levels for low time-frame reactions At a first glance this chart might seem rudimentary but it is not. As time goes by more elements will be added. For now our charts will attempt to highlight 2 important...
Orange lines - daily wave, classic ABC continuation Green lines - h1 exhaustion trading levels for the daily C point Magenta lines - m15 exhaustion trading levels for low time-frame reactions The larger context based on weekly is a 0.618 C point around 1.2600 and a large daily double top 1.2580.
Our expected market movement for this week is a short from 142.8. 142.8 represents a 1.27 extension on the XA leg of the pattern as well as a 1.618 extension extracted from m15 rsi. The 2 measurements are within a 10 pip distance. The dashed line at 143.2 is the general stop loss area. Once again this is not a blind trade, meaning we do set a sell limit order now...
At this point this is not a trade, it is an expected market movement. This is also my first published idea so I am still working out the proper presentation format. All trade expectations incorporate multiple time frame analysis. In this case the green lines represent projected levels from m15. 138.7 is the minimum where market conditions will be evaluated for a...


