BullBearInsights
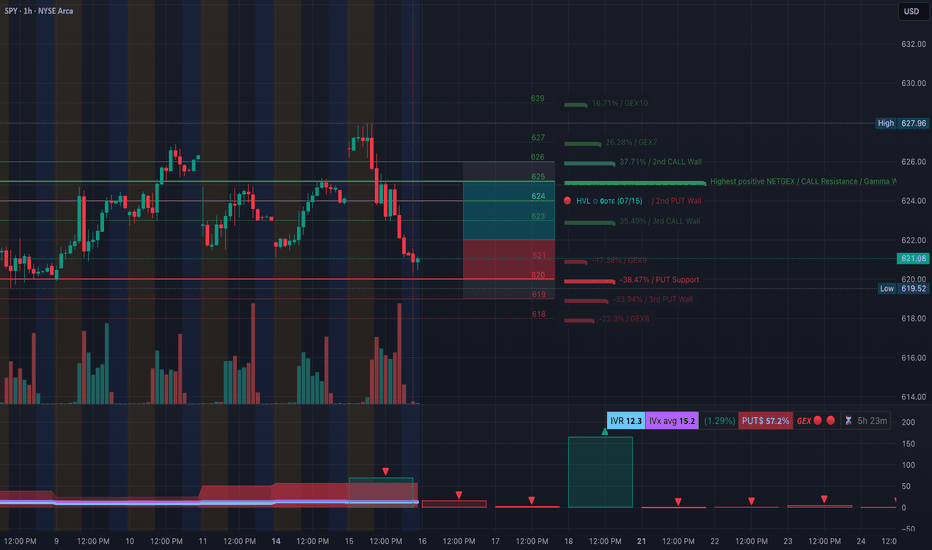
Essential🧨 GEX-Based Options Outlook: * GEX Sentiment: Negative gamma dominates (🟥 GEX 🔻), indicating elevated dealer hedging risk. * Put Wall & Support: * Major PUT Wall at 620 (⚠️ -38.47%) is being tested. * Additional downside liquidity lies below 618. * Call Resistance: * Upside resistance around 625–627, where both the 2nd CALL Wall and GEX7/8 sit. *...
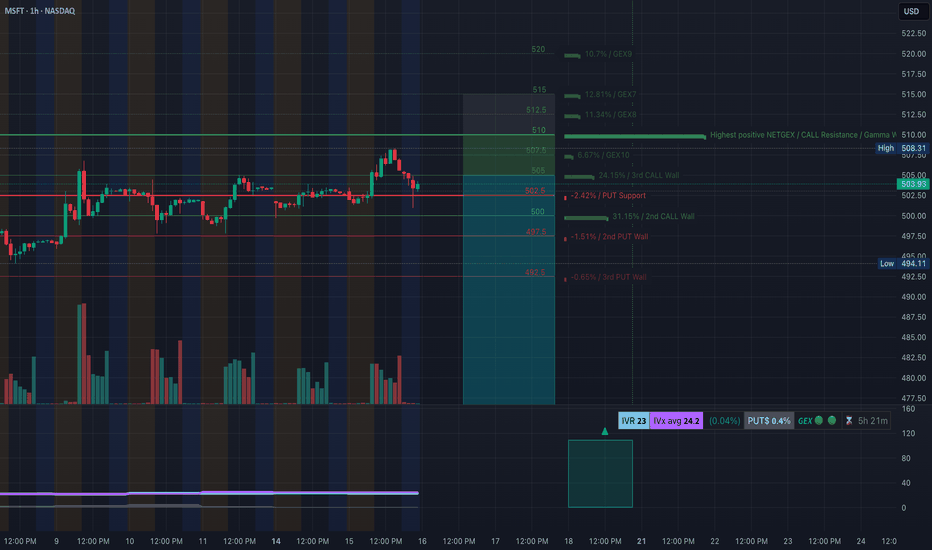
MSFT Setting Up for a Breakdown or Bounce – Key Option Levels in Play 💥 🔹 Options GEX Analysis (Tanuki GEX View): * Gamma Resistance (Call Wall): → $510 is the highest GEX level, acting as a ceiling. → $507.5 is the 3rd Call Wall and minor resistance. * PUT Walls and Gamma Support: → $502.5 = HVL (High Volume Level) → $500 = key strike with heavy Put interest →...
Technical Overview: PLTR is showing signs of a distribution top after a strong rally. The most recent 1H structure shows a Change of Character (CHoCH) just under $149 with lower highs forming and weak bullish reaction. * CHoCH confirmed under $148.50 * Price struggling inside supply zone: $148.50–$150 * Ascending trendline now broken — possible bearish drift...
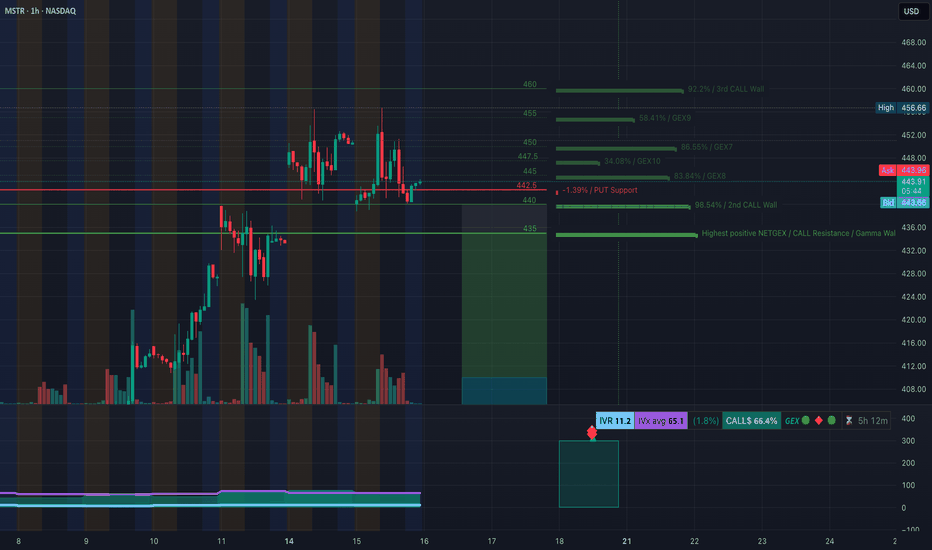
GEX + Price Structure Align for Breakout or Breakdown 🔸 🧠 GEX Levels & Options Sentiment (as of July 15, 2025) * ⚠️ Key Call Resistance Levels: • $460 (3rd Call Wall, 92.2%) • $455 (58.41%) • $447.5 (GEX10) • $444.5 (GEX7) – overhead friction * PUT Support Levels: • $442.5 (near current price) • $435 (Gamma Wall: highest positive NET GEX) * Support Structure:...
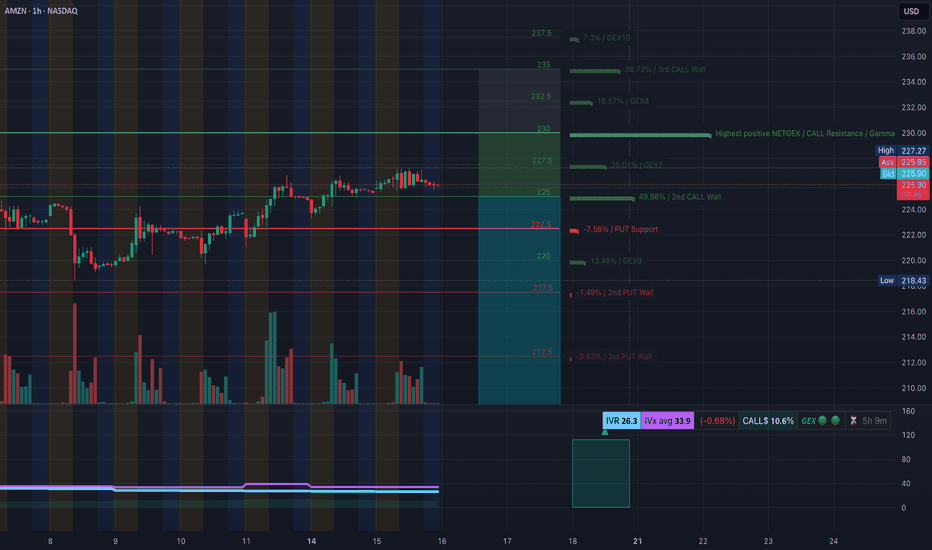
Options & Intraday Trading Setups to Watch This Week 🔍 🧠 GEX Analysis & Options Sentiment (Tanuki) * GEX Sentiment: Mildly Bullish * CALLs Volume: 10.6% → Neutral-to-Weak Bullish * IV Rank (IVR): 26.3 → Low implied volatility rank * IVx Avg: 33.9 → Neutral options environment Gamma Walls / Levels to Note: * Resistance (Call Walls): * $230 = Highest positive...
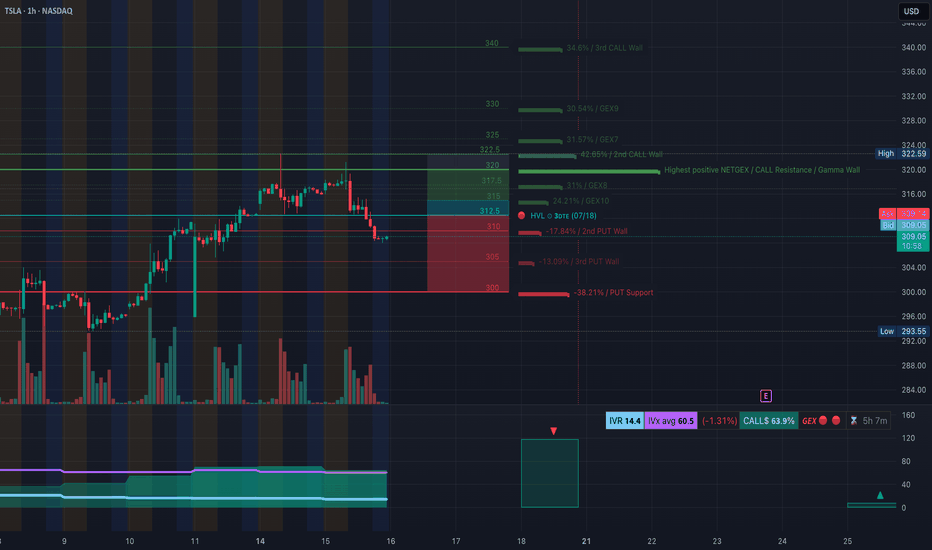
🔍 GEX Analysis (Options Sentiment) * Key Call Walls (Resistance): * $322.5: +42.65% GEX — Major resistance and 2nd Call Wall * $325 / $330: More overhead call resistance * $317.5: Minor resistance * Gamma Flip Zone (Highest Net GEX / Resistance): * Around $320–322.5, price is likely to face supply pressure from dealers hedging short calls. * PUT...
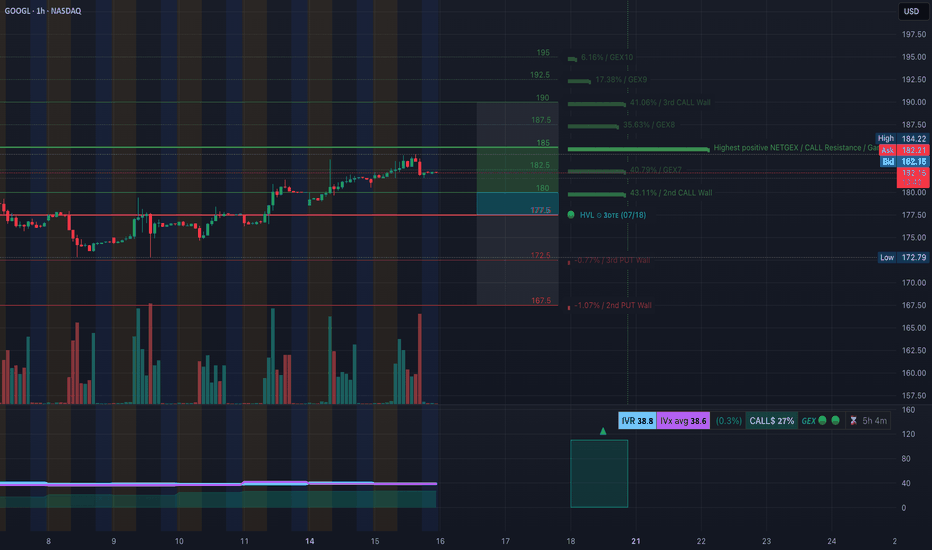
📊 GEX Sentiment & Options Outlook (Based on July 15 Data) * Key Resistance Zone: ‣ 184–185: Highest Positive NET GEX, 3rd Call Wall → Strong gamma resistance ‣ 190–192.5: Additional call wall cluster—unlikely to break without strong momentum ‣ 195: GEX10 level (top bullish magnet if a breakout triggers) * Support Zone: ‣ 180: Minor call wall, near current price ‣...
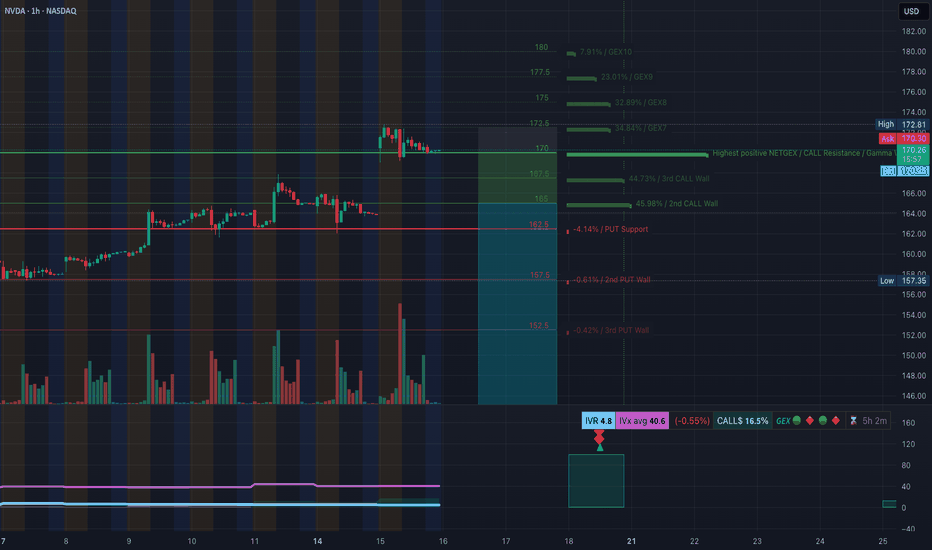
Options Flow and Technical Setup🔥 🧠 GEX & Options Flow Analysis * GEX Map Summary: * Highest Call Wall & Gamma Resistance: $172.50 * Major GEX Clusters: $175–$178 → Layered GEX zones, strong positive sentiment * PUT Support: $162.5 — This is the highest negative NetGEX zone and key downside defense * IVR: 4.8 (Low) * IVx: 40.6 (Decaying vol...
SPY: Bearish Gamma Pin Threatens Breakdown – What to Watch This Week 🧨 🔸 GEX-Based Options Sentiment (Tanuki GEX Zone) * GEX Summary: * Highest Call Wall (Resistance): 625–628 → strong resistance zone. * Highest Put Wall (Support): 618 → major gamma defense line. * GEX Flip Zone / NETGEX Support: around 620, where negative gamma begins accelerating...
🧠 GEX Analysis & Option Strategy: * Gamma Wall / Resistance: $225 * Next Major Call Walls: $227.5 → $230 → $235 * Call Side Dominance: 13.3% Calls, low IVR at 27.4, IVx avg 38.9 * Put Support: $217.5 / $213.5 * GEX Bias: Mildly bullish bias above $225 — price is floating at Gamma Wall. 🟢 Bullish Option Play: * Scenario: A breakout above $227.5 could ignite a gamma...
🔹 GEX Options Sentiment Analysis * Gamma Resistance Zone: The $180 level marks the highest positive Net GEX / Call Wall, making it a magnet and potential resistance for GOOGL. Above that: * $182.5 = 2nd Call Wall * $185 = 3rd Call Wall * $186.43 is the extreme call zone from GEX * Put Walls (Support): * $172.5 = 2nd Put Wall * $167.5 = HVL ...
🧠 GEX and Options Sentiment (TanukiTrade GEX) * GEX Zone Summary: * 📈 Call Wall 1 (503.5–506.7) → major Gamma Resistance. * 🧱 Gamma Wall (506.77) = Highest positive NETGEX — key sell zone for market makers. * 🟢 GEX Flow: Moderate call dominance (1.95%) — not yet extreme bullish. * 🟣 IVR 22.8 (low), IVX avg 25.2 – implied vol remains subdued. *...
AAPL at a Pivotal Zone! GEX & Price Action Align for Major Move 📉📈 🧠 GEX Sentiment (Options-Based Insight) * Current Price: $210.53 * GEX Zone Traps: * Below Price: * 🟥 Put Support at $205 (-11.48%) * 🔻 PUT Wall at $200 (-9.06%) — strong floor * Above Price: * 🟩 CALL Walls at: * $212.5 → 29.79% GEX7 * $215 →...
GEX Walls and Wedge Breakdown Incoming? 🔸 GEX (Gamma Exposure) Breakdown for PLTR: * Current Price: $141.99 * Key Gamma Resistance Zones: * 📍 $145.15 – Highest Net Positive GEX (Gamma Wall) * $144.58 – 2nd CALL Wall * $146 – Overhead resistance from 2nd wall cluster * Key Gamma Support Zones: * $137 – HVL & 1st Put Layer * $135 – 2nd Put Wall ...
TSLA GEX Analysis – “Call Side Dominance Nearing Critical Resistance 💥” GEX Snapshot: * Highest Positive GEX / Resistance: $320 – This is where call positioning is heaviest and likely where dealer hedging could resist further upside. * Call Walls: * $317.5 (44.18%) * $320 (High NetGEX) * $335–$340 (Intermediate resistance, weaker positioning beyond) *...
🧠 GEX Breakdown * Key Gamma Resistance (Call Wall): * $164.94 → Highest NET positive GEX (Gamma Wall) – Major resistance where market makers start hedging against further upside. * $167.89 (local high) → aligns with 1st rejection wick. * $170 → 2nd CALL Wall (67.29%) – max squeeze potential if $165 breaks with volume. * Call Side Build-up: * $167 –...
SPY Approaches Gamma Wall: Key Zones to Watch for Tomorrow’s Trade 🔥 GEX Options Sentiment Analysis: SPY is currently hovering just below the major GEX resistance zone around 624–626, where the highest positive GEX and gamma wall overlap with strong call walls (52.17% and 41.33%). This region has historically capped upside momentum, so traders should prepare for...
TSLA Caught in Tug-of-War: Key Gamma & Price Action Setups Unfolding ⚠️ 🔍 GEX (Gamma Exposure) Analysis: Tesla’s options market is highly polarized heading into the week. * Gamma Walls: Strong Call Wall near $304–$310, showing potential upside magnet if bulls regain control. Above this, the $317.5–$320 zone could trigger a gamma squeeze. * Put Walls: The...
