Aligning the bottoms of the Pi-Cycle Top Risk (PCTR)/Deflection (PCTD) indicator shows that this cycle has shown more similar behavior to the 2016-2017 cycle than the 2020-2021 cycle. So far we have had two major waves of the PCTR/PCTD, just as in the 2016-2017 cycle. The 2020-2021 cycle only had one. The third larger wave in the 2016-2017 cycle led to the...
Happy New Year! The indicators that make up the Bitcoin Swing Trade Indicator (BSTI) are bottoming in aggregate. I've been searching for nice daily swing trade indicators and have been swapping them out in the BSTI. Therefore, the BSTI has gone through changes, but it is almost ready for prime time. I'm thinking of changing out one more indicator. The solid ones...
During this current BTC cycle, major uptrends in global liquidity have corresponded to major uptrends in the market 72ish days later. The last major uptrend in liquidity is about to run its course, pause, and then downtrend. If this relationship holds, we are at or near at least a pause in the local up trend. I have my popcorn ready to see if this plays out....
While nothing is perfect, the movement of global money supply this cycle has forecasted bitcoin price movements exceptionally well. Previous cycles, money supply more overlapped than predicted, except when the 2020 massive increase in money supply led BTC price higher. The lag between global money supply highs and lows and BTC highs and lows this cycle has been...
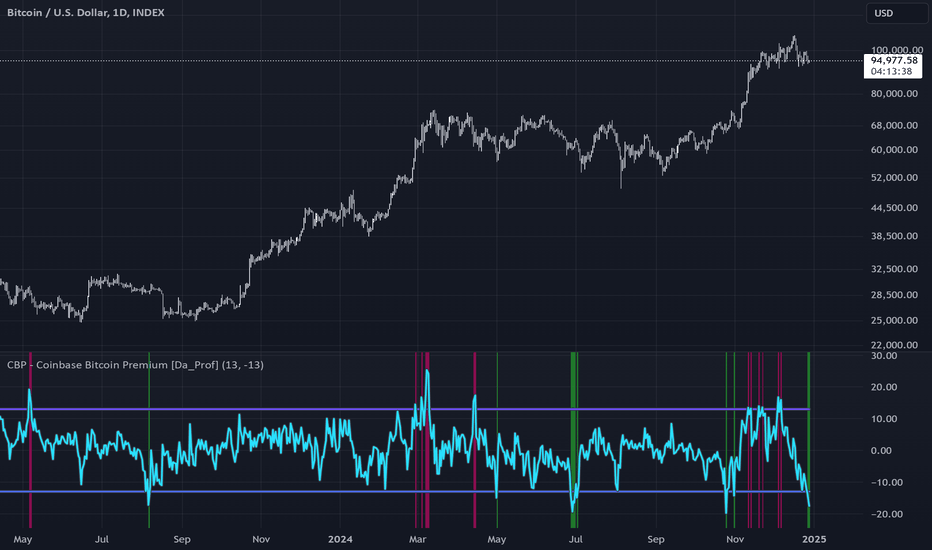
The Coinbase Premium (CBP) is currently signaling "oversold". This is an indicator which identifies extremes in the price of CRYPTOCAP:BTC on Coinbase in relation to the average of the Binance and Bybit CRYPTOCAP:BTC price. The CBP has done a pretty good job over the last few years of identifying levels of high and low risk for the price of $BTC.
Why is USDT.D so important in defining a CRYPTOCAP:BTC top? Because, when BTC is in price discovery, there is no previous price action to determine where we might expect a reaction based on price. Therefore, all we really have are fib extensions and speculation if we solely look at past CRYPTOCAP:BTC price. Fear not, USDT.D gives us previous dominance action...
The Bitcoin Swing Trade Indicator triggered a buy signal. None of the individual indicators have triggered a bottom, but the overall "risk" is below the trigger line. Note: I know it is unfair to publish this idea when the BSTI isn't available to y'all, but what are you gonna do? It isn't quite ready for prime time, but I wanted to make y'all aware of the signal.
The NUPL (Net Unrealized Profit/Loss), RP (Realized Price), and to a lesser extent, the CVDD (Coin Value Days Destroyed) are getting close to triggering. The last time a few top indicators on the BTI got close to triggering, we had a pullback. I think we see a continued rally near-term, but then a pull-back to cool off the indicators before they fully...
The Coinbase Premium Indictor shows the CBP risk is high. The previous times the CBP premium has reached these levels, CRYPTOCAP:BTC generally started a range or downtrend.
According to past cycles, there is still a lot of room to the upside for the risk metric.
The BTSI has signaled a high risk area for BTC. These can happen and price can still go up for a while until a bear deviation. The bars pattern is what happened the last time.
Similar to March 8th timeframe (i.e., the previous local top). Some BTI top indicators have started to come close to fully triggering. Currently the NUPL and Realized Price (RP) indicators are getting near a top signal. No indicator in the BTI has fully triggered yet, but it would be wise to watch the BTI closely.
The coinbase premium again signaled a "buy". See the previous times a green signal has printed on the indicator.
Hey all. Just coded a meme coin dominance indicator. Please DM me if you see any issue with it. Thoughts: If this is the meme coin super cycle (which I subscribe to), I'm thinking we go to near or over 10% MEME.D. My prediction is that once Tradingview creates the symbol for MEME.D, it will be the top :) The chart has the MEME.D indicator, BTC.D, and OTHERS.D...
The meme coin gains indicator was updated to include all the fancy new meme coins in the top 100 market cap coins. SEED_DONKEYDAN_MARKET_CAP:ORDI and NASDAQ:SATS were removed based on categorization by CoinGecko and CoinMarketCap. I used CoinMarketCap to determine the top 100. My opinion is that the indicator is much more useful now than in the previous cycle...
The Coinbase premium has been a very good "long" swing trade indicator recently. It just triggered. I'm not fading this.
Some individual indicators in the BTC Swing Trade Indicator are getting overheated. While the BTSI is not in the risk trigger zone, the RSI, NVT Golden Cross and the SOPR have flashed "sell" signals in the last couple days. Do with that what you will.
It is well-known that BTC is a child of liquidity, but I'm not sure how if people realize how much when liquidity is measured at Global Money Supply - USD adjusted (indicator by SirChub). The last two cycles and the current one are plotted. As you can tell, the relationship is strong. In recent years, rapid liquidity increases have lead increases in the BTC price....


