The weekly chart will tell us how things will probably playout in the months ahead. The double bottom has much further to run. In the immediate time-zone on a daily the dollar price is at the bottom of a triangle that it wants to have some more room. I expect the dollar will continue its climb this week.
The weekly chart attached with a bullish MACD is telling the market its buying spree is just getting started.
Hello from Australia, the XAUUSD chart which is very current, displays the daily & weekly charts of MACD & RSI (period: standard 14). Both charts are not at big overbought levels just yet, in fact, if you recall Thursday and Friday were more pullback sort of days. In fact, I would not be surprised to see some big upside moves in Gold this week because the...
www.tradingview.com The silver price has kept running today and is in resounding shape and position.
AUDJPY has seen continual bullish divergence for over 1 month now. What are your thoughts on the bullish order block in the chart from recent days and a similar price? Feel free to comment.
I bought in Long as I could see it turning about 60 hours ago even despite a rallying USD as it looked overextended. This daily chart is strong and all its timeframes are similar. The only little hurdle is some resistance it is just below. But I think it will blow through some smoke and mirrors and shoot higher.
You can see the 1Hr candles from earlier this morning NY time where the squeeze was on. I think that this Tariff' business of Donny's will include some volatile days but from my understanding & in only the past 24 hours that whole thing will actually be supportive of the Gold price and Cryptocurrency's amidst some fear sellers from time to time.
For ease of viewing I have displayed only the major structural BOS & ChoCh on this 1Hr chart of XAUUSD. The brown trail is a standard Bollinger band setting and price is captured only in the past week. See the 1,2,3 on chart. 2 major Bos in price leadup during the past week. 1 major ChoCh on 30 January. On the lower timeframe it's noted some bearish...
This chart I have displaying is the Weekly for XAUUSD, notice this is not overbought, in fact that's a nice cross up on a handy weekly chart. It's the same on the daily chart for gold and consider a look for long postions on XAUAUD & XAUGBP which are also a great Buy at the moment due to momentum swings to support higher prices and this is also despite them...
The market wanted to breakout yesterday so imagine how the pump might be today.
Bearish head n shoulders on intraday timeframes and GDP marches down on USD & smashes through the defense.
Lately, I have been a bit over Cryptocurrency, up and down and fake movements around charts, but I guess its a part of trading. I currently have only 2 position's, Doge & Hbar I had to let go earlier today. So, this new one is Stellar Lumens XLMUSD & it really is stellar, one of the biggest runners yesterday, up something like 7 or 8%. It's obedient and...
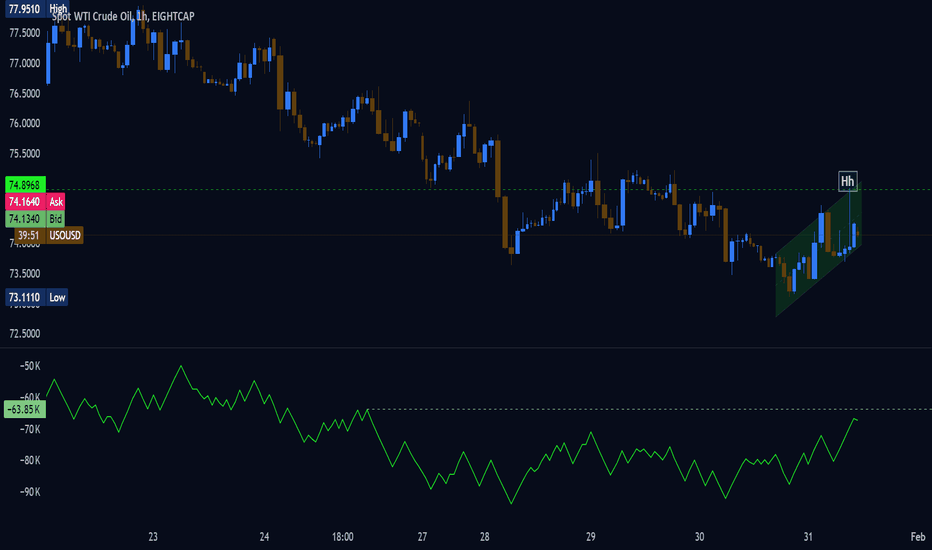
USOUSD has opened up in Asia Friday with nice volume and very early a Higher High in price. There's even a hint of a pullback in price.
The only thing I might keep a watchful eye on is the Dollar which now is also puling back but possibly moving higher soon.& hopefully I have a Buy on the daily chart soon on the oil price. What are traders thoughts about the traditional inverse relationship between oil and the dollar? What we know is that the Dollar has already made a significant move in...
I will keep this brief as it might be a Fibonacci witch-hunt. The oil bull-run commenced in April of 2020 & that commencement is flagged with a green vertical broken line. Note the Fibonacci zero-level as well from 04/2020 and a trend line extended to oil's high price made in March 2022. You will see ChartPrime's 'smart money indicator' print a green bullish...
Price here is moving in a good Uptrend. MACD ZERO LAG is so bullish . From 11:30am London open Long trade might be a, good for the Aussie currency. we seem to recover better.
We have 3 Daily candles adjacent to prior support. I like this zone. I thought Oil was going up a week ago but this i the golden moment coming into play, pull out MACD Zero Lag indicator and lets wait for Signal line have to receive an upwards and bullish cross by the Macd line. Prefer price action, hey so do I, but my Macd is like a child I care about.
Nvidia caught some smart money buying from unsuspecting panic sellers yesterday, today is a chance to get long again. Hey we all panic as traders from time to time. I offloaded some Bitcoin yesterday at a loss. I was a tad heavy in Crypto so I'm feeling lighter on my feet & I don't plan on investing or trading in it again. I did not follow Bitcoin's move down...


