This trading idea is very simple. The result is from this year using Btcusdt as the asset to be analyzed. The first thing that the system performs is the analysis of the trend using Ichimoku Kinko Hyo indicator, when the price (bars) are above the cloud and chikouspan (lagging moving average) is also above the kumo cloud, we would say that the trend is bullish....
This system is very simple when buying or selling any future at any time frame. Signal On the price chart when the price or candle is over the slope and the trend of CFB and slope is in an uptrend, it is a buy signal, inverse for sell. On oscillator momentum trader please turn on the candle color bar. when the momentum (lines) is green and the histogram...
Logic says that when the US indices fall the dollar rises. MACD NRP is giving a possible rise in the future of the dollar. It has already broken out of the weekly bearish channel and the price is supported on the basis of a possible bullish channel. we will have to wait to the next week for the buy signal confirmed
PpSIgnal has developed a MACD NRP, which uses moving averages that are more sensitive to price movement. As we can see in the weekly chart, it is very successful and can give us information prior to a market movement in lower timeframes. CORRECTION at marked Fibonacci levels Espanish PpSignal ha desarrollado un MACD NRP, que utiliza medias móviles más sensibles...
PpSIgnal has developed a MACD NRP, which uses moving averages that are more sensitive to price movement. As we can see in the weekly chart, it is very successful and can give us information prior to a market movement in lower timeframes. CORRECTION at marked Fibonacci levels
many times we wonder ... when it's time to enter here I leave you an idea ... you just need to find the trend and an entry trigger.
I can see a bull market for PANW Palo alto Networks...the volume, the trend and de volatile is coming...
The Stochastic Pop was developed by Jake Bernstein and modified by David Steckler, who wrote a corresponding article for Stocks & Commodities Magazine in August 2000. Bernstein's original Stochastic Pop is a trading strategy that identifies price pops when the Stochastic Oscillator surges above 80. Steckler modified this strategy by adding conditional filters...
BITFINEX:BTCUSDSHORTS the crypto currency is still in bearish territory ... in the image my scalping system. Using Ppsignal Btcusd Short and long oscillator.
Continued moving in a bear territory, be careful with de bullish tramp. the long and short ppsignal oscillator show us that the bear power have a control trend crypto market. atr is in a sell signal is time to wait and see
We are waiting the macd and aron cross bull signal, please look the yellow circles, and the break out of the triangle chart... atr daily time frame is in the bull territory... we will see...
As we have seen the oscillator long and short position btc, don't wrong the bear have the market. the chart ascending triangle failed.
we can see that the pair is moving in an ascending triangle. With the Ppsignal Long and short BTC oscillator and the softened atr we can determine when to enter at the right time.
Using macd MTF in weekly and daily time We can see a EWZ Brazil Buy Signal for long trade.
Normally wave 2 has support in fibonacci 61.8 so far it has not had it. Macd signal sale, ewo divergent ... will be that the market is getting ahead of that there will not be a rate cut for the moment?
Super resistance zone between the prices 12 k to 12.3 k. We detected bullish flag chart formation . Bitcoin has found a very good support in the area of 61.8 fibo to 10.5 k. from here we will waiting a new impulse to the zone of 12.3 k with volatility and volume the rally would reach up to 20 k historic maximum
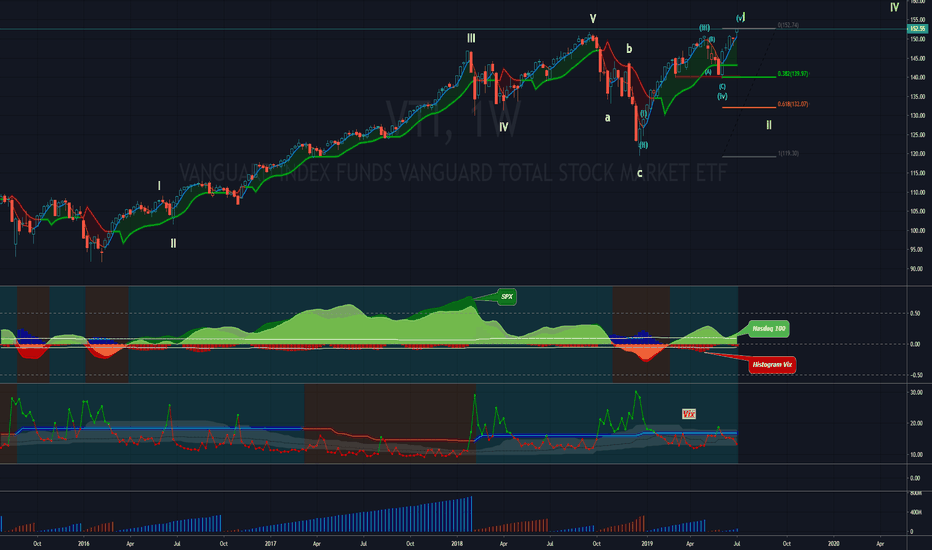
Hi all, We are here analyzing VTI one of my favorite ETFs. from the technical I can see a wave 1 elliot so we should expect a fall at least up to level 61.8 to then return to the upside


