MA is showing a peak and likely to stay bearish toward the 430 level. It's currently below the 200 MA, indicating a loss of momentum.
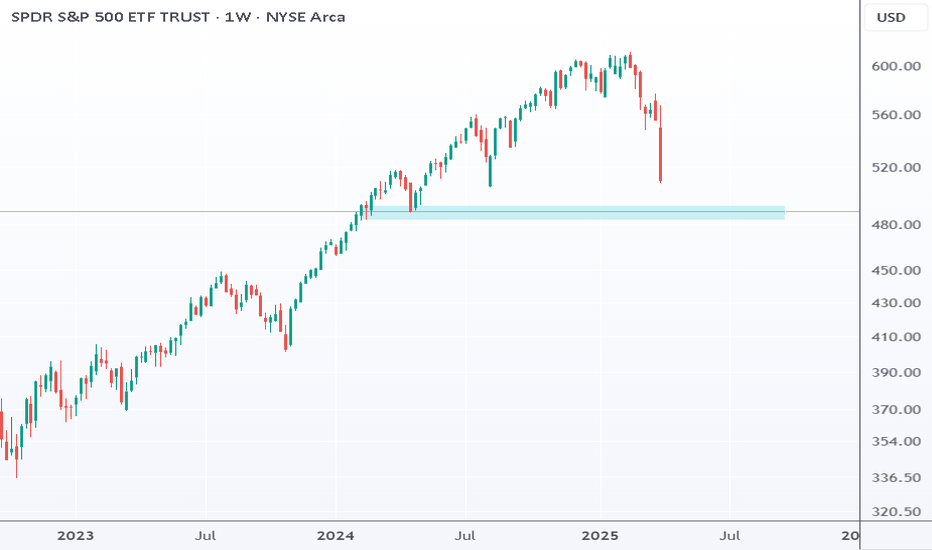
If SPY drops to 490, that's nearly a 20% decline from its 611.39 peak. The 490–500 zone may stabilize recent volatility, but if it breaks, watch 470 — a key support and 20% below last year’s close.
BRK.B is in an upward trend, but it’s approaching the upper channel resistance near $550, offering limited upside (around 3-4% from the current price of $536). Support just below $500 suggests a potential downside risk of about 10%
AAPL seems to have support around 202, where the 100-week moving average lies. Watch this level closely, as it could hint at the future trajectory.
The data speaks for itself—recent upward rallies in #QQQ haven’t changed the downward trajectory, with little sign of a meaningful upward shift. 📉 The bullish trend that began in 2023 has reversed, forming a lower high at 490 (200-day MA), signaling a major downturn.
RDDT has declined over 50% from its peak and recently dipped briefly below the key level of 104. If the stock stabilizes between 105 and 113, it could signal a potential shift from bearish to bullish momentum. As long as RDDT maintains support at 104, there remains the possibility of a new upward trend.
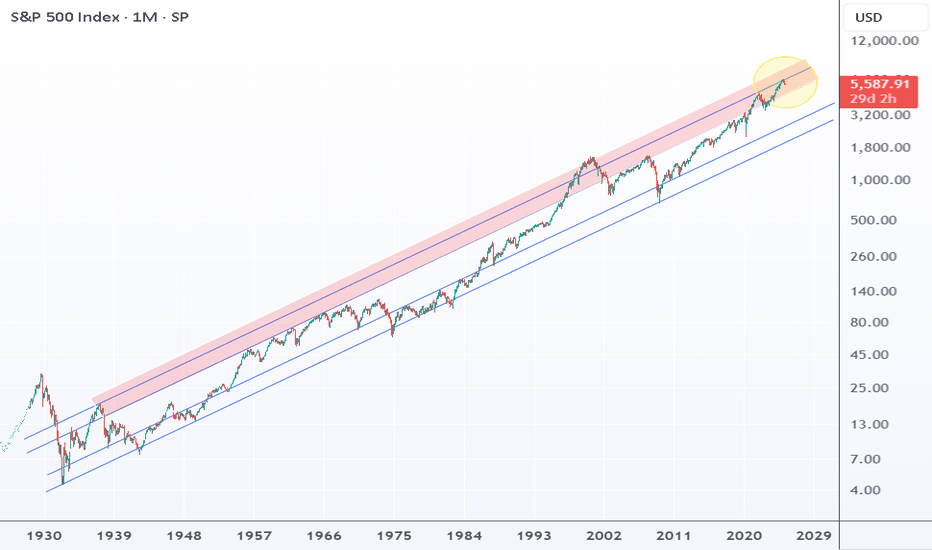
The S&P 500 is currently trading near the upper boundary of its long-term price channel, both from the 1930s and the 2009 rally. This positioning raises the question: Is the S&P 500 vulnerable at its current level? Trading near the upper channel often indicates potential resistance, suggesting that upward momentum may face challenges.
Is the recent decline an opportunity for massive upward potential? 💡 ARM stock holds strong long-term potential, as evident from past price movements. Recent quarterly data suggests the stock has been oversold, creating a possible setup for a rebound. To regain momentum, the stock needs to maintain key support between the 86 and 95 range.
In what scenario could BTC/USD reach 110,000 this quarter? To achieve this level, Bitcoin needs to stabilize within the 78,000 to 85,000 range while remaining above the crucial 75,000 to 76,000 support zone. A positive sign is that the recent downward movement from the peak of 109,000 has shown signs of exhaustion. Recent short-term price movements indicate that a...
⚡ Gold is approaching the upper channel of its upward trend and is facing potential correction. If this occurs, it could trigger a temporary reversal of around 4-5%, potentially revisiting the $3,000 level.
FNV has reached a key resistance around 158.2. There are two factors suggesting a continuation of the upward trend: Prolonged Sideways Movement: The stock has been trading sideways for an extended period, and this time, the 158.2 level is more likely to be broken. Robust Upward Momentum: The recent upward move toward the key resistance appears strong and...
RDDT stock seems to have bottomed and is likely to rebound towards the 130/140 range. If it holds the key support at 105/110, an upward trend toward its 52-week high could begin in Q2 2025.
MA stock's short-term momentum has weakened after pulling back from its all-time high of $582.23. However, its long-term and intermediate trends are still intact. The $500–$510 range, supported by the 200-day moving average, is an important support level for keeping the intermediate uptrend. If this level holds, MA stock could reach $630–$680 by the end of 2025.
The SPY ETF (SPDR S&P 500 ETF Trust) recently peaked at 613.23, reaching the upper boundary of a long-term channel that has been in place since 2009. This suggests the market is in an overbought state. Looking at historical trends suggests that the continuation of previous upward trends became unsustainable after reaching critical levels. The current correction...
FIGS' stock price has been in decline since 2021, falling from a peak of $50.40 in that year to a low of $4.30 in 2024. However, over the past year, the steep downward trend has eased, and the stock has stabilized. In the short term, FIGS has established support around $4.50, with technical patterns indicating a potential upside toward $5.05. While the risk of...
What does the recent price action on AAPL stock suggest? The recent price action on AAPL stock indicates a potential topping pattern, which may signal a bearish move toward the support zone between $180 and $195. This pattern suggests that selling pressure could increase, leading to a possible decline within this range. What is the worst-case scenario for AAPL...
What does the QQQ graph tell us about the current situation? The QQQ is not trending upward within the channel that began in 2023 and is currently in a correction phase. The recent decline has weakened the previous momentum, making a significant short-term upward price movement less likely. Does this correction damage the overall long-term upward trend that...
RDDT stock is in a correction phase, down more than 50% from its high of 230.41. The stock is now approaching a support level between 102 and 104, which could help the price rise in the short term. If this support holds, the stock could move toward the 130–135 range.


