I can't be the only one seeing this short opportunity on USDJPY. Sharp 3.8RR Breaker Block, Inducement and Order BLOCK entry confluence
Hi traders, It's been a long while since I shared my trade objectives here. NOT/USDT looks bullish as it just broke out from a 4H descending wedge and retested the resistance line as a newly formed support. Trade parameters are seen on the chart. Let's make some money together.
I bet you can't ignore this sweet 17R trade plan. I expect the price to hold this level and pump from there, a break below is a clear invalidation. This price has shown to be a major interest in demand. Liquidity at this level will be mopped up immediately and the price will bounce from here. Let's expect BAND at $2+ soon. Don't ignore this trade. I am LONG on...
Hey Traders, Here is my latest analysis on BTCUSDT. The most likely scenario has been shown on the chart. Other information and possible entry points are highlighted too. Don't ignore this timely update.
BTCUSDT,1D Hello traders, here is my latest analysis on #btc. BTC was first trading in a rising wedge (bearish pattern), later consolidated within $27,500 - $32500 and dropped further to ranging between $18k-$22k. Price may consolidate here for long or break lower.🔥 If you love my analysis, you will be my follower. Thank you!.
Hello traders, DODOUSDT 1D analysis ALTS are super cheap now. Price has been trading within a falling channel for a year now. Accumulation is crazy and the price is resisting further downside by trading within a very tight range. Don't miss this incoming LAMBO for any reason. 🚀 SixtusGlobal
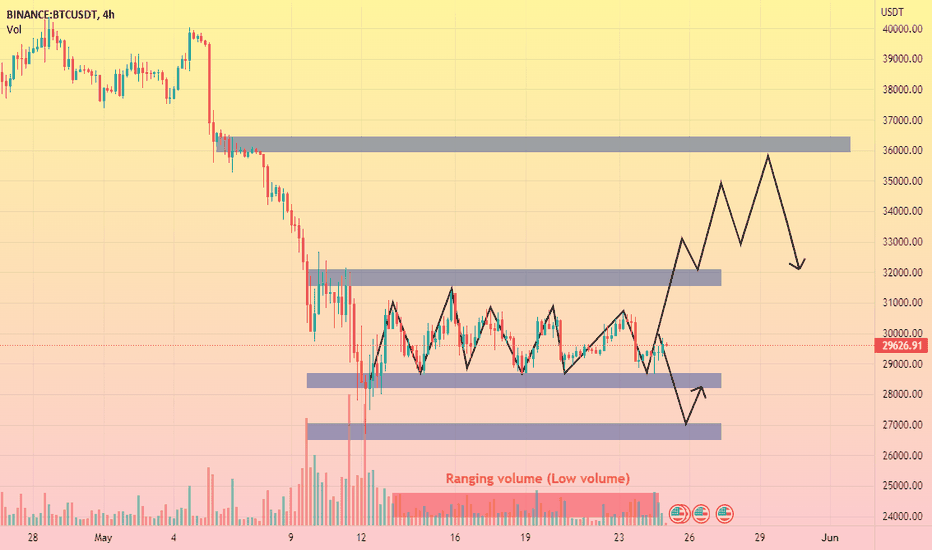
Hello traders, this is SixtusGlobal, and here is my new BTC idea. BTC price is presently ranging between $28k and $31k. This level is a very critical POC that must, at least hold the price for further upside movement before price eventually collapse. I have highlighted the first resistance at $32k and the second at $36k. Volume is considerably low and perfect for...
Hey traders, Whether you're team bull or bear, you have to admit that both $50k and $30k is possible at the moment. However, $37k level is very relevant and an important POC (point of control) for price. If BTC must go up from here to $50k+, it might have to gather momentum at $37k level. Support at $37k must hold to prevent price slippering to $33k. In my...
BTC is in a bear flag as shown in the chart. Flag patterns depict trend continuation and in the case of a bear flag - a downtrend continuation. If the support line at $37k is broken, then the narrative is a completely bearish scenario. $30k is the price in sight for the bears. Keep a close eye as price trades in this flag. Happy Trading!.
Scenario 1 is a bullish scenario while 2 is the opposite. Watch closely the price action at the resistant line of the falling channel. What's your view?.
$ICP is in an uptrend. Expect big moves to the upside if the highlighted support level holds. The high trading volume also supports this move. The major demand zone is at $28. See you at the top.
Hey, This is my short-term analysis. $50k+ is now, don't short. If the support can hold then expect a smooth and small rally to the top. I may be wrong though (if the price doesn't hold above the level shown on the chart. Kindly leave a comment below.
Price trading within a bullish flag pattern. Should be a big move to the upside But price action at the support level still looks weak. If price breaks and trades below support, say "HELLO" to $38k?. If you agree, give this idea a like and comment.
BTC broke the trendline impulsively (bearish breakdown). On a micro view, the bulls can only gain confidence if it bounces to the trendline level. BTC is now trading in a major support zone. If this level holds, it will go further up to the previous resistant level of (52K). If it doesn't, expect to see lower lows. This idea will be updated as time passes by.
Get set for a massive gain from this pair. Zoom out the chart on 1D TF and see the prolonged accumulation. IMO, it's breaking the descending triangle to the top. Buy now or miss the pump.
SUSHI/USDT is good for a long position here. Risk/Reward ratio is 1:2 The chart is clear and shows we are trading at the second major support and the bounce from the trendline support is to be noted. Price is already at the lower band and RSI is bouncing off from support. What do you think?. kindly share your opinion in the comment section. Like if you agree with...
Hello everyone. BTC is faced with massive correction for the second time in this bull run. The correction is still ongoing. How soon till BTC recover? Are you of the opinion that March would be a bearish month for the crypto market?. Trade safe! SixtusGlobal 📈
Hello everyone, After long accumulation, XEM is currently in an uptrend. The ascending trend support line is holding. MA cross is bullish Buy now or buy within rotated rectangle Sell target is also shown in the chart Trade safe! Sixtus Global


