Descending channel formation SL- 1.09 TP - 1.045
Hidden bullish divergence and expanding triangle pattern This is a follow up from my previous trade; the markets have failed to break below the key level of 1.05. Due to the change in market structure, the new trade idea is the one presented. And thank you those who liked my previous trade idea which broke out of the wedge pattern successfully. Good luck! TP -...
SL - 1.08 TP - 1.05 *Not financial advice, merely an opinion*
As it can be seen from the chart, GBPJPY broke a critical resistance price level which has since then been retested. Evidently, it has successfully retested that level which has now become a strong level of support. In conjunction with the break and retest of the key level, GBPJPY has broken out of a bullish falling wedge pattern, increasing the probability of...
As can be seen from the chart price has failed to break yesterdays high. Assuming this rejection follows through then this trade can potentially be extremely rewarding. Moreover, a descending channel has clearly formed on the lower time frames indicating a possible continuation to the down side. The previous idea ought to be disregarded due to the change in market...
As can be seen from the chart, the price rejected the trend line with a perfect hammer candle upon breaking out. This has given rise to a potential buy trade on GBPJPY. Multiple time frame analysis has been conducted to ensure the trade has minimum drawdown before potentially flying to the up side. *NOT FINANCIAL ADVICE, MERELY AN OPINION*
This is an update to my previous post, where GBPJPY rejected off of the trend line and proceeded to fall. Now what we see is a retest of a critical price level which could soon be an amazing sell trade, given the fact there has also been a rejection off of the Fibonacci level. The TP would remain the same as my previous post. More importantly, having multiple...
It appears GBPJPY has failed to break the previous high presented on the chart. And given the recent break of the ascending channel, it seems there is a good sell opportunity. Further confirming this sell bias, there has been a retest of the channel pattern with a clear rejection, giving the opportunity to enter a great R:R trade. *NOT FINANCIAL ADVICE, MERELY AN OPINION*
Evidently GBPJPY has broken the channel that formed. The channel was then subsequently retested and rejected from successfully; for this reason, I believe a short from the current price to the 4 hour support level would be highly probable. More importantly, confirmation of this bearish bias can be seen on the daily time frame, where a rejection from a key price...
As we can see, GBPJPY has been bullish for the past week. However, it is apparent price has been following the ascending channel presented, here. Assuming price continues to respect this channel then it would appear to be a very good R:R trade even if the channel was not broken as the chart shows. *NOT FINANCIAL ADVICE, MERELY AN OPINION*
As you can see from my previous analysis, I prefer multiple confluences on the chart as this gives a better opportunity to be accurate when trading. From the chart I see a Head and shoulder pattern and assuming this is correct then it may go the distance of the size of the head of the pattern, as it does usually with most H&S patterns. The most surprising aspect...
Similar to my previous analysis on EURUSD which has nearly reached its profit target, this analysis too is based on multiple time frames. On the weekly chart there is a rejection off a strong yearly price area, and on the daily a hammer candle seems to be forming. On the 4 hour time frame there is a clear H&S pattern. The reason why the potential profit is very...
It seems EURUSD has been in a down trend on the 4 hour time frame and on the daily, and a bearish hammer candle has formed on the weekly chart. There also seems to be a nearly 50% retracement that has occurred within the channel, which is a good indication that it may continue to go in to the direction of the trend. Assuming it does fall, then it can be said it is...
It is evident from the chart a clear support level has been established, but not only that, it has been respected. On that basis, it can be said it is likely PLTR will continue up for the foreseeable future. *NOT FINANCIAL ADVISE, MERELY AN OPINION*
There was a clear downtrend on USDCAD which may have broken out, thus confirming there is potential for a bull run to occur to the above mentioned take profit level. *NOT FINANCIAL ADVISE* MERELY AN OPINION.
It is evident from the chart there is a breakout of a descending channel, and to confirm this breakout consolidation has occurred above the trend line and a bullish divergence on 3 hour time frame has formed. Therefore potentially allowing for a good R:R trade like all the other ideas i have previously posted. *NOT FINANCIAL ADVISE* MERELY AN OPINION
Presuming GBPJPY remains bullish upon market open there will be the completion of a head and shoulder pattern which could be an indication of a potential bull run with a good R:R. Also to further clarify this potential bull run there is a inverted hammer candle on the weekly time frame. *NOT FINANCIAL ADVISE* - MERELY AN OPINION.
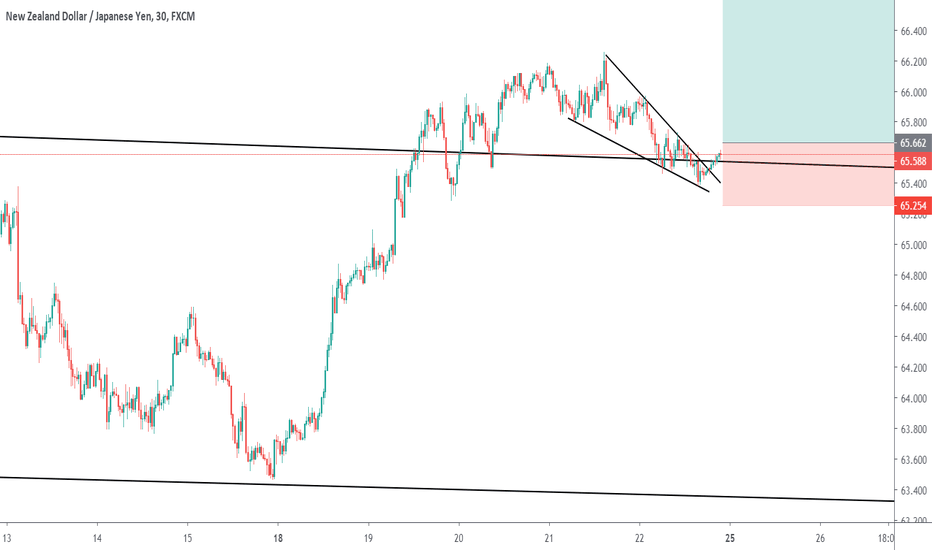
Falling wedge has formed.


