WILLIAM-Trader88
Base on the wave count analysis on the chart, DXY is currently on the last leg of the ending diagonal wave and the price action suggest that the dollar index might make a final push to the top at 99.00 region before reversing. We will continue to monitor closely.
Dow Jones May make one more attempt for a sell off and after which it may rebound at 61.8% of the Fibonacci retracement level. Do keep a look out for the market movement
Dollar mid term view is engaging in a 3 waves corrective pattern (WXY). We may see dollar correcting itself in near term as the market is showing bearish divergence and the bigger X wave formation.
Gold's long term trend may be in a long term bullish trend.
3M general trend is still bullish but in order for a greater rally ahead, the market is currently showing signs of bearish correction. - RSI showing strong bearish divergence. - two potential demand zone spotted at 38.2% and 61.8% of the Fibonacci retracement.
Microsoft has the potential to hit another bullish rally as there is a potential ascending triangle set up. But the stop loss gonna be tight!
Base on the Cycle wave count of the Elliott wave, the market might be heading for an ABC correction. As such, I'm Bullish for now. But only for a short while. As you can see that the current 5 waves broke the low of the the previous bullish rally and as such, i believe that the current bearish 5 waves down are the leading waves.
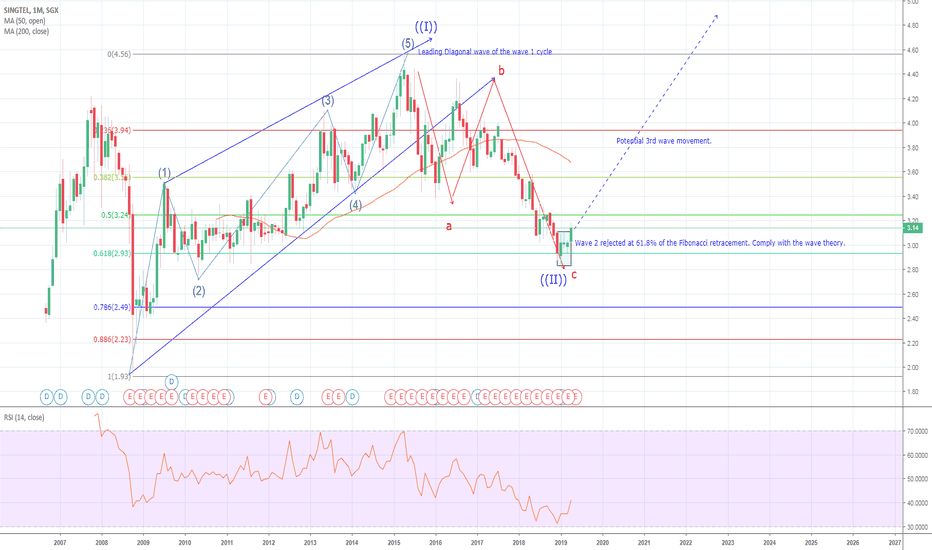
Singtel may be staging for a super bull rally as it is currently in the 3rd wave of the bull.
USDSGD has been on a ranging mode despite of a death cross indicated in the chart. If price is able to reject the 61.8& or 1.3500 zone, we will consider longing the stock as it is approaching the key resistance level.
Starhub has been on a downward trend and the current 3rd wave is yet to complete as indicated by the Fibonacci extension. Once the market hit 1.22 region highlighted in the chart, a short bullish correction might happen. So stay tunne
Clearbridge manage to breaks the previous high point towards the end of last week and although it had a correction at the start of this week, the market quickly rebound and attempt to reach for the high point last week. However, the market met some resistance and hence it might retreat to the zones highlighted. Remember to look out for any reversal pattern in...
EURUSD on a bigger picture is in bearish correction and although the Euro may seem to be the weakest among all, I believe that the Euro will have a short rally because the Dollar is currently on a retreat as the dollar bull is currently overheated. - Falling wedge pattern has been spotted. - Prices has been testing the 61.8% of the Fibonacci level twice. -...
Despite Dow entered into a short bear market with the formation of a potential evening star pattern within the supply zone and the 88.6% of the Fibonacci retracement, Dow's long term view remain bullish with 26000 psychological support in line and the golden cross formation still remain intact. RSI is not in overbought zone as well.
EURUSD has defies all odds to come back even more bullish this week. The bullish pennant is a great example of the continuing bull runs for the next round.
NASDAQ has been a raging bull index ever since it broke of the 6000 mark. Now? It's even more bullish and it even has a gap. So the question is will the market revisit the 61.8-78.6% of the Fibonacci retracement level? My view is that it's highly probable.


