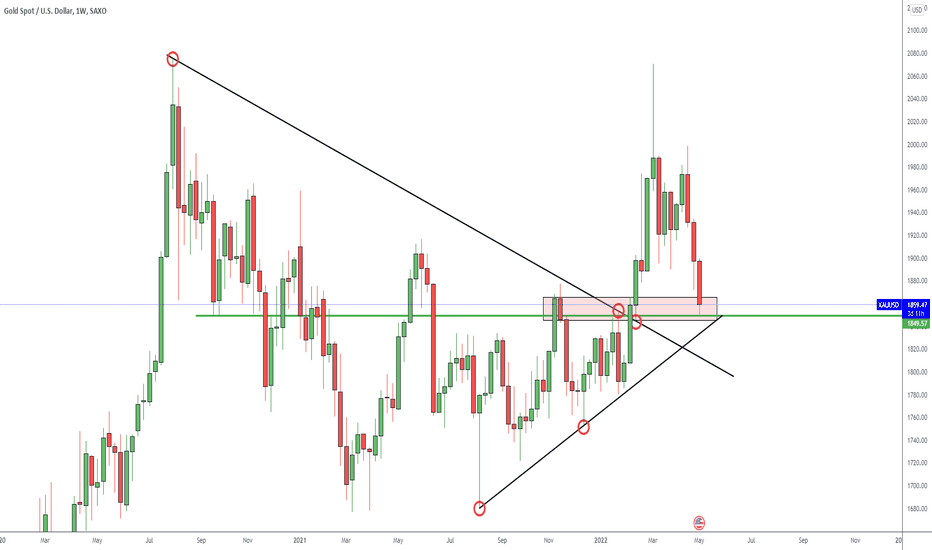
Breakout after descending trendline. Price breaks out after third touch and created equal high before retesting the trendline. Price is currently at the nearest zone. Possibility 1: retrace back up to make a LH or new high Possibility 2: Price will continue down to retouch the trendline before pushing up.
Xauusd hits HTF supply and fibs retracement level Monday tuesday should be a retracement and depending on structural change there will be a push up
In correspondence with the published video, CMP is a LH after a htf double bottom correction ltf sell and look for a LH formation under the base to start a swing sell trade
Respecting market structure to form a LH pullabck continuation down or a HL and HL Immediate moves are shown on chart
H1 view shows Price is moving down as expected - shown in MOVE A. This move is completed by touching LTF demand area, shown in grey. An additional confirmation would be when the pullback respects previous structure and completed MOVE B as a lower high. This confirms a down trend move.
H4 shows a new set of supply areas that have been respected along a strong S/R area at 1795/1803 Sitting below this area is a highter timeframe fresh nested demand area. This would need to be tested and would act as the catalyst to push up, thus completing stage 2 correction
The Daily view shows price rejecting HTF supply zone and moved down. According to S/D rules, once supply is touched then the demand area below is touched. This may be a weak demand or fresh demand area depending on set up. Descending trendline shows price respected two touches on a uptrend and broke on the third; thus touching the nearest supply zone. However...
Price is in a channel and I expect a LH , LL formed before pushing up to the Weekly/Monthly supply area
Current Market Price has closed above a S/R Level, there is the possibility of price retesting this level before continuing up movement idenified by arrows on chart
Monthly supply area is nested with a Weekly supply area The weekly area has been breached and approaching the monthly supply area This is also inline with key weekly and monthly fib levels. There are many valid trendlines on daily but these are weak representations so not applying them into my analysis. I expect Price to continue up and based on a reaction...
Price is ranging between two higher timeframe key levels. Price is also in a triangle pattern The structural moves are shown as arrows on the chart
Market structure is respecting key levels if this current level holds then expect elliot wave correction to occur and price to move as shown on charts
Equal high formation completed so either a HL will form to push up and form a new high or form a equal low/new low
With the last daily candle closing orders within the supply area - also support turned resistance area - todays daily candle would need to close ABOVE the base bottom to encourage further bullish movement
Price has been respecting bullish movements and breaking through each key level. Price will continue up to the next key level - this is also in line with a descending trendline, 3rd touch, break out will create more bearish momentum


