brendan_ellich
Hey guys! This is what I expected to happen to gold based off my last post - reach support 1, however not in this little amount of time. Gold prices are getting heavily sold off recently, as the Dow and Nasdaq have had solid green days for the past 4 days. However, gold broke support and pulled back and is currently trading right on support. We could see a...
Hey guys! Below is an analysis of gold that I've decided to update from my previous posts. Points that are non-TA: - Golds looking strong with recession fears going through the roof and Trump having a constant affect on the value of gold causing a 52 week high to be reached in the last 2 days. - Expecting more trump hits which should send gold prices higher as...
Bitcoin breakout expected! Descending triangle formation is coming to a close with touches to break 38.2% fib level. Volume has begun to slowly pick up with an engulfing candle appearing after a doji. This is also after a consolidation after a pullback from testing the 78% level Should expect a breakout to push upwards to 12,000 at least may see further. Entry...
above 21/50 day EMA. Gold prices have now broken its 52 week high at US$1546 this will see DCN to have more volume roll in as people run to gold to invest However has slightly fallen from its upward trend channel, but is still above higher low support so it's a pull back. In my opinion, DCN is a possible buy as the tensions are continuing to increase drastically,...
From the chart, there has been an increase in gold in a close-knit candlestick pattern, with it increasing value. This has caused a bearish flag to arise. This is recognised due to: 1. quick increase to reach the basis of the flag. 2. once it was reached began forming an upwards flag shape with close-knit candlestick high/ low closes. 3. once the flag lines...
Broke out with a engulfing candlestick Backed with volume could go for a strong run to .83c ^ provided volume continues backing
Recent trade negotiations caused a spike in the XAUUSD. Could see it break the high of 1536, if so can see a decent run Low support and unlikely with current trading circumstances for it to be reached. Long trade with trade wars heating up causing pressure on the commodity to rise in price. Will probably see a reach of 1580 in the coming two weeks if such...
Looks like it’s reaching a bottom. Also could be forming a double bottom if more volume is attracted
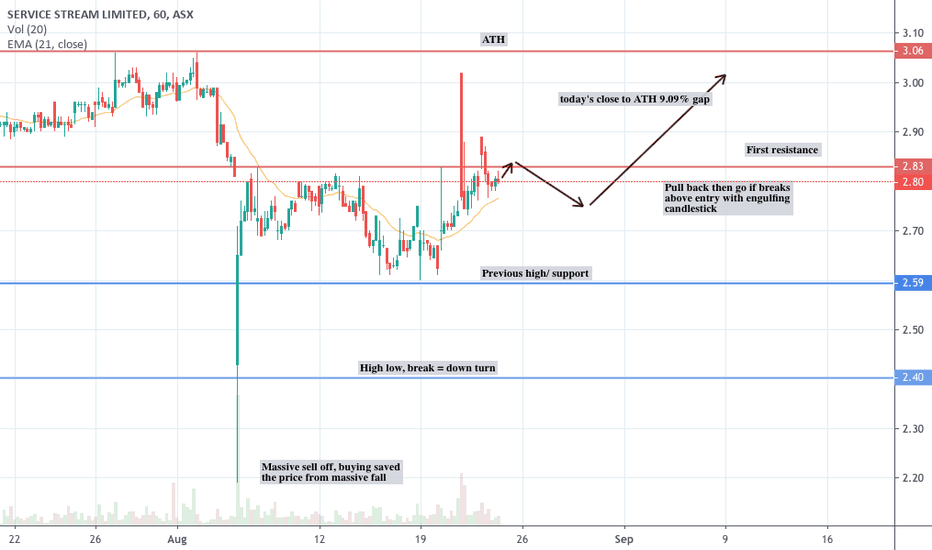
- testing of resistance at 2.83 - touched previous high and bounced off support. - been breaking resistance in the past two days. - above 21 day EMA with a strong volume backing it - should see a pull back and needs to cover a 9% increase to break ATH


