decadura
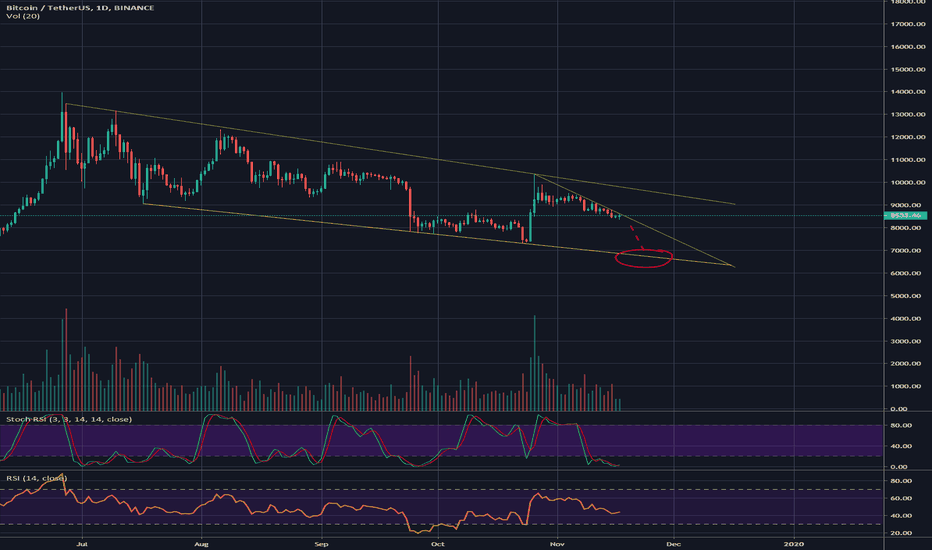
chart is telling you everything easiest short of history!
just look at the chart the arrow is telling everything
lets let the fib level pull us down to 19k.
the similarities are there. lets see how this plays out
just look chart. dont need any explaination.
keep it always simple guys and dont create charts where people getting eyecancer from looking at it. the third contact on that weekly line occured and a rejection from it took already place and the break to the upside is extreme unlikely cuz its the third contact which holds almost every time!
huge bearflag about to play out to the downside!
As long as that yellow line holds its bullish imo. as soon as it breaks and closes under that a correction phase will begin.
hi guys. in my last TA which i published i said that the yellow line will be touched but this time also be bropken to the downside. that didnt happened yet but maybe it wont. btc bounced of of that line so far and the probability of retest of the yellow line at the top is valid and possible.
no volume at all in btc trading although we have a bullish formation. Means bears will take control and try to break the support line (yellow line) very likely at the next contact (if that happens). But if BTC breaks the decending trendline it could lead to the breakout of that bullish formation (falling wedge).
hi guys. as you can easily see on my chart there is a rising wedge forming on the hourly and also the stoch RSI is overbought. its very possible that this will play out.


