team_USA
BITTREX:XRPBTC is looking like it wants to start a major trend reversal soon. As you can see on the chart, it is currently bouncing off a major long-term uptrend line. Additionally, if you look at the BITSTAMP:XRPUSD pair, there was a recent golden cross of the 50 and 200 SMA, which we can take as further evidence of a trend reversal soon. Price targets are...
BTC/USD is showing a potential inverse head and shoulders here, which is a major reversal pattern. It looks like the right shoulder may still be forming, but it also looks like it could have already broken out of the neckline. So, we may see a retest of the neckline, but if it breaks out of the neckline, the target level is $5.4k Shorts still haven't been...
BTC/USD is showing a potential double bottom here. It has to break the labeled resistance to confirm the target. Additionally, this is the first chart I've published in a while. I'm coming out of hibernation because I think the bears are about to hibernate for a couple years. I am making this general market prediction based off of buy volume from Binance,...
GC1! (Gold futures) is likely to begin breaking out of this multi-year accumulation zone. go long, hold for a couple years. trade at your own risk
BTC/USD is showing a potential inverse head & shoulders here. it is fractally very similar in movements to the inverse head and shoulders that took it from around $6k to around $12k. if the neckline is broken, target is labeled on the chart. trade at your own risk.
BTC/USD is showing a clear bearish flag here. if labeled support is broken (and it probably will considering overall market conditions), target level is labeled on the chart. trade at your own risk
BTC/USD is looking like it wants to reject the upper trendline of the downtrend channel here. if it can break below 11k , 3 target prices are labeled on the chart. trade at your own risk
ETH/USD has been holding up very well during this overall market bloodbath. it is showing a potential double bottom here. if the top resistance line labeled in the pattern is broken, target level should be ~$1764. trade at your own risk.
LINK/BTC is showing what looks like a very strong long-term ascending scallop; it wants to go hugely parabolic. based on the intersections between this fib extension and the scallop's trendline, we have the following targets (in BTC): 0.0001284 0.00018281 0.00027086 0.00035891 0.00041332 trade at your own risk.
BTC/USD is now showing a very strong-looking bearish flag. 1st target level is labeled on the chart. 2nd target level is a somewhat less likely target based on a head & shoulders pattern that I outlined a couple weeks ago and have linked to this chart below. trade at your own risk.
BTC/USD looks like it wants to make a new all time high again. I had to revise my chart and medium-term outlook as the potential head & shoulders pattern was invalidated. price has already reached the equivalent of $26k USD on major Korean exchanges. trade at your own risk.
ETH/USD is showing a clear head & shoulders reversal here. target level if the neckline of the pattern is broken is labeled on the chart. trade at your own risk.
BTC/USD is showing a potential head & shoulders reversal pattern here. bearish confirmation & target are labeled on the chart, as well as bullish confirmation (IMO the bearish projection here is more likely statistically). bullish confirmation would likely bring it to at least $20k. I might add a bigger write-up later if I have time, currently busy with my...
ETH/USD is about to go through a classic dead cat bounce. target based on pattern projection of the rising wedge here is labeled on the chart. most major coins that follow the lead of Bitcoin are showing a similar pattern right now. volume is descending across the wedge, which should confirm the pattern as the price is diverging from volume. trade at your own risk.
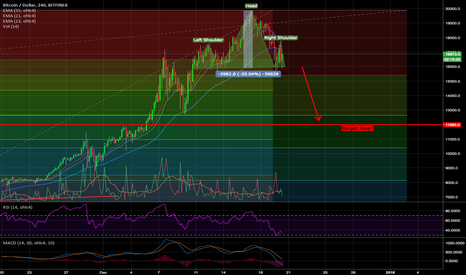
BTC/USD is showing a clear head & shoulders reversal pattern here. target level is labeled on the chart if the neckline of the pattern is broken. trade at your own risk.
ETH/USD is showing a clear bullish continuation flag here. target level is shown on the chart. trade at your own risk.
ETH/USD is showing a clear bullish continuation flag here. target level and stop loss are labeled. in my opinion, there is a very significant chance that there will be an announcement of either futures trading or an ETF for Ethereum in the near-ish future. CBOE & CME are proving that it worked with Bitcoin, and investors are hungry for more. also the Winklevoss...
BTC/USD is showing a potential double top reversal here. if labeled support is broken, target level is around $7.9k additionally, we have: bearish divergence on volume bearish divergence on MACD & its momentum oscillator bearish divergence on RSI AND (this is very important): koreans and japanese are nowhere to be seen in this secondary pump. USD spot price has...


