USOIL nearly looking for target Hey there on 1hTF the USOIL has looking for all target completed target
So we can observe the oil look for upside and then will drop continue
Futures market

Gold trading strategy today!Gold prices saw a modest increase on Friday due to a weaker US dollar and lower US bond yields. Traders are increasingly betting that the Federal Reserve will cut interest rates this year following the recent weaker US GDP data. Additionally, geopolitical risks and conflicts in the Middle East could further support the precious metal.
However, in the short term, we may see gold move sideways with a crucial support level at $2,330. If this level is breached, gold could weaken significantly. Therefore, investors with a bullish outlook need to focus on protecting this support level to maintain the upward trend.

Hellena | GOLD (4H): Long to resistance area 2404.446.Dear colleagues, the markup turned out to be rather unusual, but I still assume that the price is headed for a correction in wave “4” (2328.823). This may mean that the price will soon start an upward movement at least to the area of the nearest resistance at 2404.446.
After confirmation of this movement we will consider options for further upward movement.
Manage your capital correctly and competently! Only enter trades based on reliable patterns!

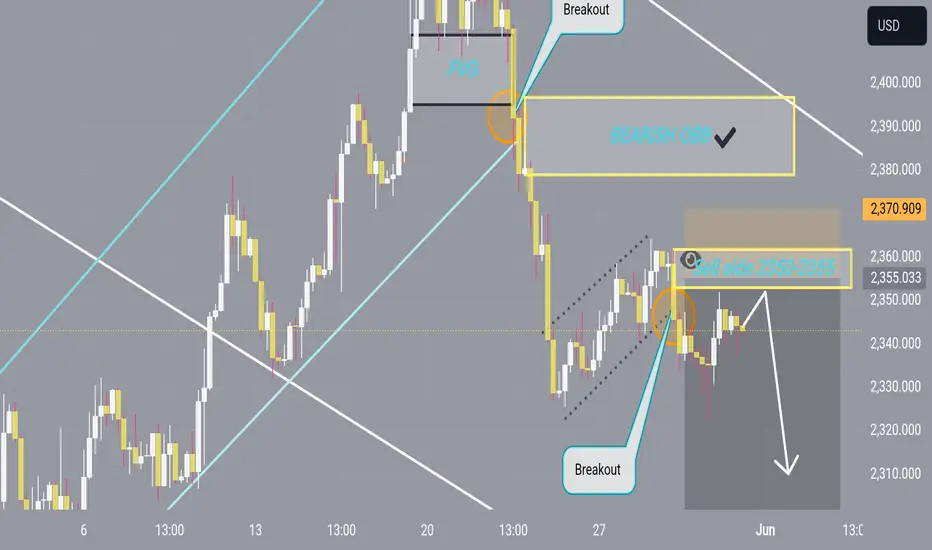
TODAY GOLD SELL AREAHey there on 4hTF the Gold has looking forward to be retest 2350 and 2355
So we can observe that Gold has returned back from 2350 and next target is 2300

Gold price moves sideways before the falling thresholdWorld gold fees inched up barely once more in today`s buying and selling session. Macquarie commodity strategists stated in a file that at the same time as expectancies for hobby price cuts have lately dwindled amid consistently excessive inflation, gold fees retain to expose power because of diverse underlying effective factors.
The studies corporation determined that gold fees have hit new highs, pushed with the aid of using drivers aside from US hobby prices and the dollar. The yellow metallic has benefited from a broader threat-on sentiment in metals markets.
Gold fees have outperformed throughout diverse asset training and on the macroeconomic level. It implicitly trades on its recognition as a secure asset with out a counterparty threat, instead of the possibility prices related to maintaining a zero-yielding asset.
Furthermore, gold fees were supported with the aid of using threat assets. Macquarie highlighted that crucial financial institution gold purchases are nonetheless monitoring above pronounced levels, suggesting institutional hobby withinside the valuable metallic stays sustained.
The gold derivatives marketplace is right here to stay, in particular while measured in notional quantities in US greenbacks instead of in lots. However, the marketplace role is stated to have end up much less worrying after current rate adjustments.
Trading volumes at the Shanghai Futures Exchange (SHFE) have stabilized after a giant boom in April, however spreads in China stay excessive, suggesting persevered hobby and pastime withinside the gold marketplace from Chinese traders.
Gold fees' resilience, notwithstanding a more potent Dollar supported with the aid of using variations in relative US financial policy, indicates buyers are searching past the United States hobby price marketplace in relation to to gold.

Today's trading strategy, sell XAUUSDWorld gold prices increased slightly with spot gold increasing by 5.7 USD to 2,342.6 USD/ounce. Gold futures last traded at 2,364.5 USD/ounce, up 27.6 USD compared to yesterday morning.
Gold prices reversed to increase after the latest published data showed that economic growth in the US has slowed down from the beginning of the year until now. According to preliminary data on first quarter GDP released by the US Bureau of Economic Analysis on May 30 (US time), the US economy achieved growth of 1.3% in the first 3 months of the year, lower than the previous quarter. The previous forecast was 1.6% and down from 3.4% reported in the fourth quarter of 2023. Both the dollar and Treasury yields fell on expectations the US Federal Reserve (Fed) will cut interest rates this year increased after the report.
ActivTrades senior analyst Ricardo Evangelista said that recently, traders' views have increasingly favored the scenario that the Fed will keep interest rates higher for longer, increasing the opportunity cost of holdings of the yellow metal and creating strong price resistance.
However, this expert said that gold has benefited from strong safe-haven demand due to fears of geopolitical instability and economic instability, as well as large state purchases. He hopes that these factors will likely continue in the near future.

$XAUUSD - Today’s Setup - 31/05Good morning Traders 😎
This is my setup for today 🙌🏻
Trade smarter, not harder! 💼📈
Don't miss out on potential gains - Hit that BOOST button if you like the idea 👍 Share these 👉 and make sure to Follow me for your daily dose of gold trading analysis! 💯
Remember, always conduct your own analysis before jumping in. No financial advice here.

XAUUSD - lost bullish positionThis morning I noticed that there has been a moderate downtrend, barely trying out the 2338>2340 region once more.
As I shared yesterday, if Gold breaks via the forty five.forty five Zone and can't be strong, it'll surely lower to retest the Buyer`s Zone and the MA Wave.
>Currently, the Trend in H4 and D1 is displaying a lower and in quick spans, I suppose Gold can nevertheless increase.
>I Will Watch To Buy GOLD 2332>2336
SL 2300
TP 2346>236x
>If Gold declines beyond 2330 or will increase once more with out breaking beyond 2346>2350, I can even sell.
Watch to Sell When Gold retests at 46>50 or breaks via 2330 at this rate, I will watch for greater reactions to Sell. Temporarily, I'm looking out to Buy GOLD in keeping with RSI too. Sell at Frame M15 and the Buyer's Resistance Zone, everyone 👌

GOLD (XAUUSD): Support & Resistance Analysis
Here is my latest structure analysis and important
key levels to focus on and trade on Gold.
Support 1: 2322 - 2328 area
Support 2: 2303 - 2308 area
Support 3: 2266 - 2286 area
Resistance 1: 2361 - 2364 area
Resistance 2: 2426 - 2450 area
Consider these structures for pullback/breakout trading.
❤️Please, support my work with like, thank you!❤️

NQ Power Range Report with FIB Ext - 5/31/2024 SessionCME_MINI:NQM2024
- PR High: 18592.75
- PR Low: 18557.75
- NZ Spread: 78.5
Key economic calendar events
08:30 | Core PCE Price Index
09:45 | Chicago PMI
Value decline back into May 17 lows
- Extending from 19000 pivot
- Near daily Keltner 20 avg
Evening Stats (As of 1:05 AM)
- Weekend Gap: N/A
- Gap 10/30/23 +0.47% (open < 14272)
- Session Open ATR: 226.73
- Volume: 36K
- Open Int: 253K
- Trend Grade: Bull
- From BA ATH: -2.4% (Rounded)
Key Levels (Rounded - Think of these as ranges)
- Long: 19246
- Mid: 18106
- Short: 17533
Keep in mind this is not speculation or a prediction. Only a report of the Power Range with Fib extensions for target hunting. Do your DD! You determine your risk tolerance. You are fully capable of making your own decisions.
BA: Back Adjusted
BuZ/BeZ: Bull Zone / Bear Zone
NZ: Neutral Zone

Does silver correct?
Hello my dears
We are at your service with silver analysis. In the drawn diagram, we considered 3 goals that there is a possibility of seeing these goals in the future.
There are 9 black dotted lines that are placed as resistance in the way of candles. We want to check the reaction of silver price when reaching these diagonal resistance levels.
If you like my analysis, support me with likes and comments. thank you

Will gold fall?
Hello buddy
We are in a very important area for gold. Wait for a trigger to start pouring. In the graph, an orange line is drawn. If this area is broken with a good candle, we can set a loss limit and seek to achieve the intended goals. The black dotted lines drawn show the resistance levels ahead.
This may take several months, but if the above happens, i.e. breaking the specified area, we can hope to be in a downward trend.
what do you think?

"HOT UPDATE: XAUUSD MODESTLY RISES, US PCE DATA ATTRACTS ATTENTIWelcome investors to today's market update, where we will delve into the developments of the XAUUSD forex pair.
The XAUUSD currency pair is drawing special attention from the Forex trading community. Meanwhile, data on the Personal Consumption Expenditures (PCE) index of the United States is also the focus of the market. XAUUSD has experienced a modest growth phase, with gold prices edging slightly higher against the US dollar.
Today, global gold prices have seen a slight increase of 0.11%, equivalent to a rise of 2.62 USD/Ounce. However, the Relative Strength Index (RSI) over the past 14 days fluctuates around the midpoint of 50, indicating a lack of direction in gold prices, with further consolidation seeming favorable.
Based on US PCE data, forecasts for the XAUUSD market could see significant fluctuations in the near future. If PCE data exceeds expectations, it may lead to a decline in gold prices due to concerns about the Fed possibly raising interest rates sooner than expected.
Thank you to our esteemed readers for following today's world gold bulletin. Join us as we continue to provide the latest and most accurate information about this market."

Wait for the long-term BUY point after the recovery wave endsGold prices temporarily halted their recovery streak as the USD increased slightly, in addition to the FED's hawkish comments, and stronger-than-expected US economic data reduced expectations of a FED interest rate cut in September. This creates momentum for the USD to put pressure on gold.
On the other hand, geopolitical tensions and instability may promote gold buying as a safe haven, and banks' demand will continue to boost gold prices.
Gold is continuing to maintain the recovery of wave 4 in the elliot wave model, investors are waiting for a trendline break around 2350 to catch the SELL retest with the expectation that gold will fall to the support area of 2325 and 2305.
Our long-term BUY point is around 2305 when the recovery wave of the buying trend ends.
SELL price range 2370 - 2472 stoploss 2376
SELL price range 2386 - 2488 stoploss 2392
BUY price range 2324 - 2322 stoploss 2318
BUY price range 2305 - 2307 stoploss 2301

Gold Prices Edge Up SlightlyHi guys, this is my overview for XAUUSD.
Gold prices are exhibiting a slight upward trend this morning. Global gold prices have increased by 0.16% compared to yesterday, reaching $2,342.52/ounce. The primary drivers behind this price increase are concerns over high inflation and geopolitical tensions. However, the upward momentum of gold prices could be restricted by the pressure from interest rate hikes by the US Federal Reserve (Fed).
What are your thoughts? Let's discuss and share your opinions in the comments section below!

Gold continues to be under selling pressureDear traders! Gold experienced significant volatility yesterday with a sharp slide above the $2347 support level and reaching the $2334 mark in line with a classic bearish flag structure. At the time of writing the price is aiming to test the $2,325 mark amid a correction and sell-off supported by a firmer US Dollar and higher US bond yields. Diminishing expectations of a Federal Reserve interest rate cut in September caused some selling pressure on the precious metal as it would increase the opportunity cost of gold.
Accordingly, the resistance area at 2347 USD continues to hold the price and is actively defended by sellers on the basis of the down wave. I expect a test of horizontal support and a bounce aimed at retesting the 34.89 EMA levels, the price reaction to the liquidity zone will be consistent with our selling strategy. It is expected that the price will reach 2325 and 2307 at least.

GOLD H2 route mapIn this analysis, we'll be focusing on the H2 timeframe for XAUUSD, with key levels at 2331.00 and 2320.00 If the price breaks above 2331.00, the target is set at 2348.00, indicating a potential upward movement.
Conversely, if it breaks below 2320.00, the sell target is identified at 2306, suggesting a bearish trend. Let's delve deeper into these levels and potential outcomes.

ICT CONCEPT / LIQUIDITY SWEEPIn this analysis we are focusing on H1 time frame, if price reject the demand OB upside than we look for buy. And the target is set at 2438. If market price break below the demand OB key level downside than market will move further in downside direction. Let's delve deeper into these level and potential out come.
Unmitigated supply OB key level: 2438 - 2446
Demand OB key level: 2408 - 2414

SUPPLY AND DEMAND / PARALLEL CHANNELIn this analysis we are focusing on M30 time frame. Here we have parallel channel, which shows market internally structure was bullish. If market price come back and retrace the (2406 - 2400) key level zone than after confirmation we look for buy. And the target is set at 2430. If there is no retracement and market will directly move upside then we will wait, when market will touch our POI zone then we look for sell. let's delve deeper into these level and potential outcome.
KEY LEVEL OF POI ZONE: 2428 - 2432
RETRACEMENT AREA KEY LEVEL: 2406 - 2400

SUPPLY AND DEMAND / SMC CONCEPTIn daily timeframe we have POI zone and inside the daily POI zone we have two supply zone. Recently market break the previous high so BOS was formed. once the BOS was formed market will come back to take the inducement. after taking the inducement market will make another higher high which indicate that market is in bullish trend.
In this analysis, we'll be focusing on the H1 timeframe for XAUUSD. We are looking for SELL opportunity from supply zone area (2392 - 2400). If the market price reject (2392 - 2400) supply zone area, than we go for sell and the target is set at 2380.00. But if market price break the area of supply zone toward upside than market price will go further in upward direction and we have another supply zone area at (2410 - 2416). Let's delve deeper into these levels and potential outcomes . Without any confirmation we can not execute our trade.
IN DAILY POI ZONE WE HAVE TWO SUPPLY ZONE:
Supply zone(1) key level: 2392 - 2400
Supply zone(2) key level: 2410 - 2416
----------------------------------------------------------
BREAKER BLOCK KEY LEVEL:2380 -2375

SUPPORT AND RESISTANCE / PRICE ACTION✅Gold managed to create a New All-Time High(ATH) at the beginning of the week.
🏃♂️Currently, Gold is moving near the 🔴PDL previous day low 🔴.
🌊According to the SMC / ICT concept, when market price sweep the liquidity, once the sell side liquidity has been swept completely then market will move further according to the direction of the trend.
💡Also, we can see Bearish momentum is very strong.
🔔I expect Gold to continue falling to at least the 🟢SUPPORT AREA🟢.
Gold Analyze ( XAUUSD ), 4-hour time frame ⏰.
Do not forget to put Stop loss for your positions.

Gold will likely resume its upward trendThe recent short-term uptrend is showing signs of reversing when gold prices have dropped more than 4% from the historic peak of 2,450 USD, set just a few trading sessions ago. This adjustment shows that investor psychology is changing, as buyers tend to take profits and look for investment channels with higher profitability.
Tonight, 19:30 Vietnam time, the US core PCE index will be announced. With the return of fundamental factors, gold may continue to decline in the short term. Persistent inflation will likely force the Fed to maintain a "hawkish" stance for longer, adding to the bearish bias in non-yielding assets, creating an unfavorable environment for the precious metal.
